Runge, TX Map & Demographics
Runge Map
Runge Overview
$19,284
PER CAPITA INCOME
$37,575
AVG FAMILY INCOME
$36,638
AVG HOUSEHOLD INCOME
62.1%
WAGE / INCOME GAP [ % ]
37.9¢/ $1
WAGE / INCOME GAP [ $ ]
0.49
INEQUALITY / GINI INDEX
1,201
TOTAL POPULATION
396
MALE POPULATION
805
FEMALE POPULATION
49.19
MALES / 100 FEMALES
203.28
FEMALES / 100 MALES
25.6
MEDIAN AGE
2.4
AVG FAMILY SIZE
2.2
AVG HOUSEHOLD SIZE
531
LABOR FORCE [ PEOPLE ]
60.3%
PERCENT IN LABOR FORCE
1.1%
UNEMPLOYMENT RATE
Runge Zip Codes
Income in Runge
Income Overview in Runge
Per Capita Income in Runge is $19,284, while median incomes of families and households are $37,575 and $36,638 respectively.
| Characteristic | Number | Measure |
| Per Capita Income | 1,201 | $19,284 |
| Median Family Income | 437 | $37,575 |
| Mean Family Income | 437 | $44,319 |
| Median Household Income | 546 | $36,638 |
| Mean Household Income | 546 | $45,624 |
| Income Deficit | 437 | $0 |
| Wage / Income Gap (%) | 1,201 | 62.12% |
| Wage / Income Gap ($) | 1,201 | 37.88¢ per $1 |
| Gini / Inequality Index | 1,201 | 0.49 |
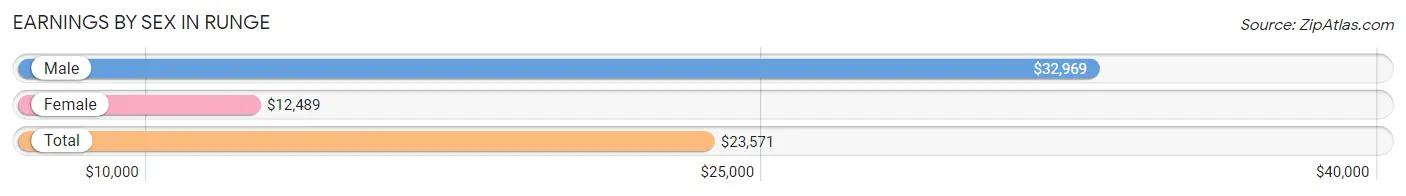
Earnings by Sex in Runge
Average Earnings in Runge are $23,571, $32,969 for men and $12,489 for women, a difference of 62.1%.
| Sex | Number | Average Earnings |
| Male | 197 (35.6%) | $32,969 |
| Female | 357 (64.4%) | $12,489 |
| Total | 554 (100.0%) | $23,571 |
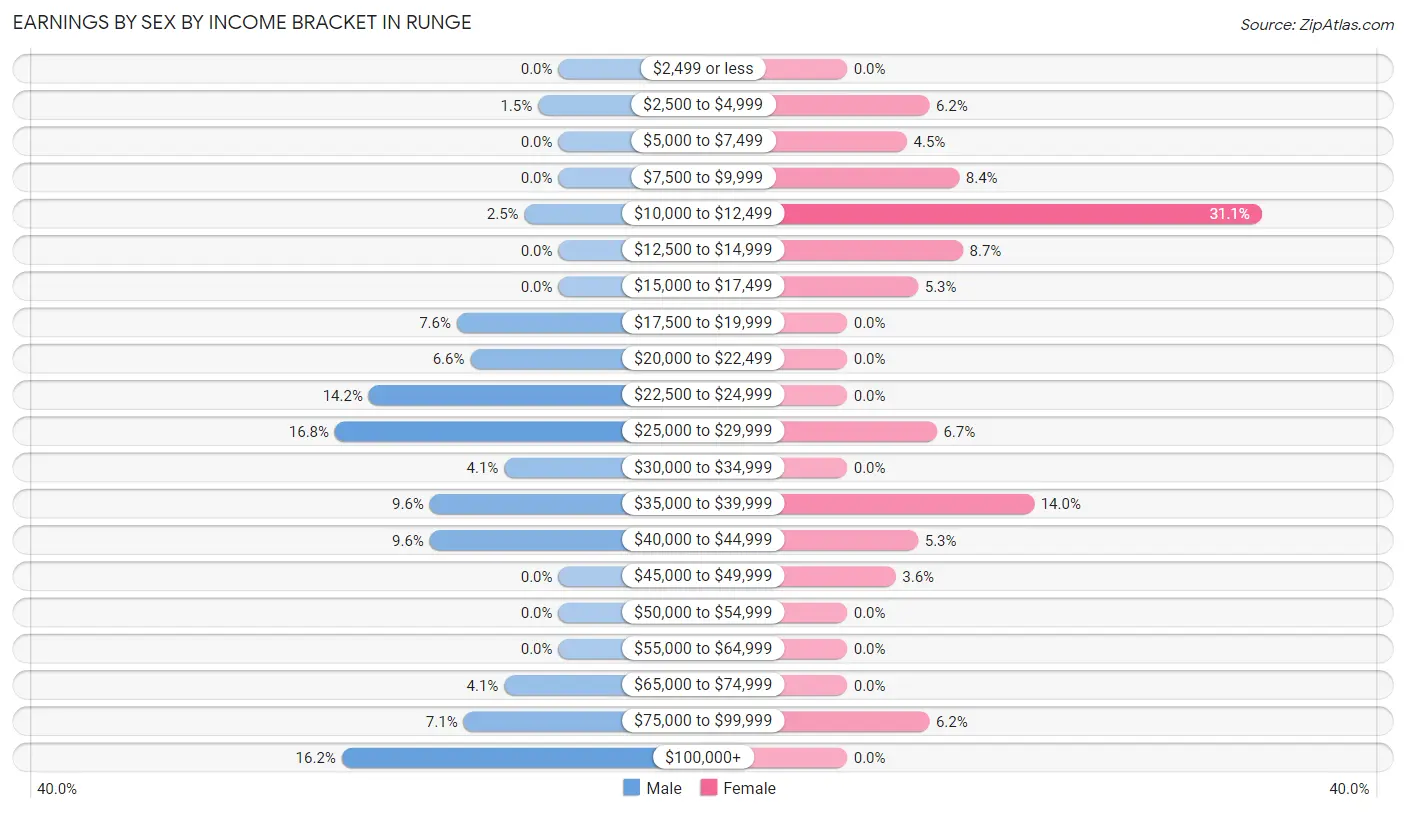
Earnings by Sex by Income Bracket in Runge
The most common earnings brackets in Runge are $25,000 to $29,999 for men (33 | 16.8%) and $10,000 to $12,499 for women (111 | 31.1%).
| Income | Male | Female |
| $2,499 or less | 0 (0.0%) | 0 (0.0%) |
| $2,500 to $4,999 | 3 (1.5%) | 22 (6.2%) |
| $5,000 to $7,499 | 0 (0.0%) | 16 (4.5%) |
| $7,500 to $9,999 | 0 (0.0%) | 30 (8.4%) |
| $10,000 to $12,499 | 5 (2.5%) | 111 (31.1%) |
| $12,500 to $14,999 | 0 (0.0%) | 31 (8.7%) |
| $15,000 to $17,499 | 0 (0.0%) | 19 (5.3%) |
| $17,500 to $19,999 | 15 (7.6%) | 0 (0.0%) |
| $20,000 to $22,499 | 13 (6.6%) | 0 (0.0%) |
| $22,500 to $24,999 | 28 (14.2%) | 0 (0.0%) |
| $25,000 to $29,999 | 33 (16.8%) | 24 (6.7%) |
| $30,000 to $34,999 | 8 (4.1%) | 0 (0.0%) |
| $35,000 to $39,999 | 19 (9.6%) | 50 (14.0%) |
| $40,000 to $44,999 | 19 (9.6%) | 19 (5.3%) |
| $45,000 to $49,999 | 0 (0.0%) | 13 (3.6%) |
| $50,000 to $54,999 | 0 (0.0%) | 0 (0.0%) |
| $55,000 to $64,999 | 0 (0.0%) | 0 (0.0%) |
| $65,000 to $74,999 | 8 (4.1%) | 0 (0.0%) |
| $75,000 to $99,999 | 14 (7.1%) | 22 (6.2%) |
| $100,000+ | 32 (16.2%) | 0 (0.0%) |
| Total | 197 (100.0%) | 357 (100.0%) |
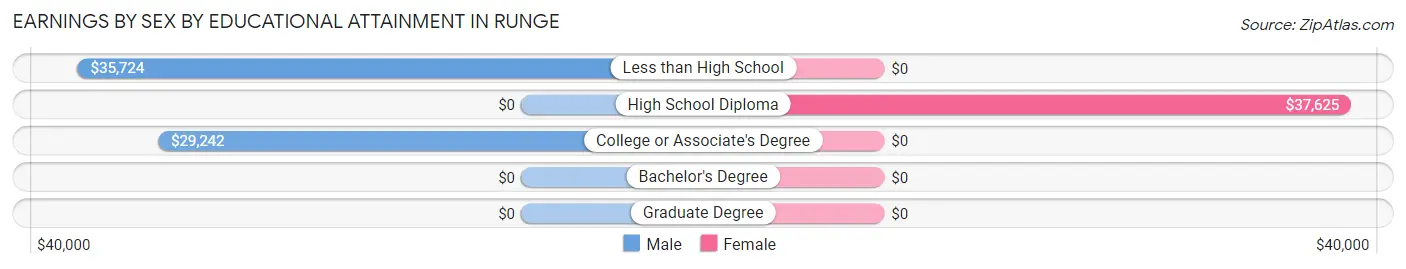
Earnings by Sex by Educational Attainment in Runge
Average earnings in Runge are $35,461 for men and $37,600 for women, a difference of 5.7%. Men with an educational attainment of less than high school enjoy the highest average annual earnings of $35,724, while those with college or associate's degree education earn the least with $29,242. Women with an educational attainment of high school diploma earn the most with the average annual earnings of $37,625, while those with high school diploma education have the smallest earnings of $37,625.
| Educational Attainment | Male Income | Female Income |
| Less than High School | $35,724 | $0 |
| High School Diploma | - | - |
| College or Associate's Degree | $29,242 | $0 |
| Bachelor's Degree | - | - |
| Graduate Degree | - | - |
| Total | $35,461 | $37,600 |
Family Income in Runge
Family Income Brackets in Runge
According to the Runge family income data, there are 117 families falling into the $35,000 to $49,999 income range, which is the most common income bracket and makes up 26.8% of all families. Conversely, the $75,000 to $99,999 income bracket is the least frequent group with only 8 families (1.8%) belonging to this category.
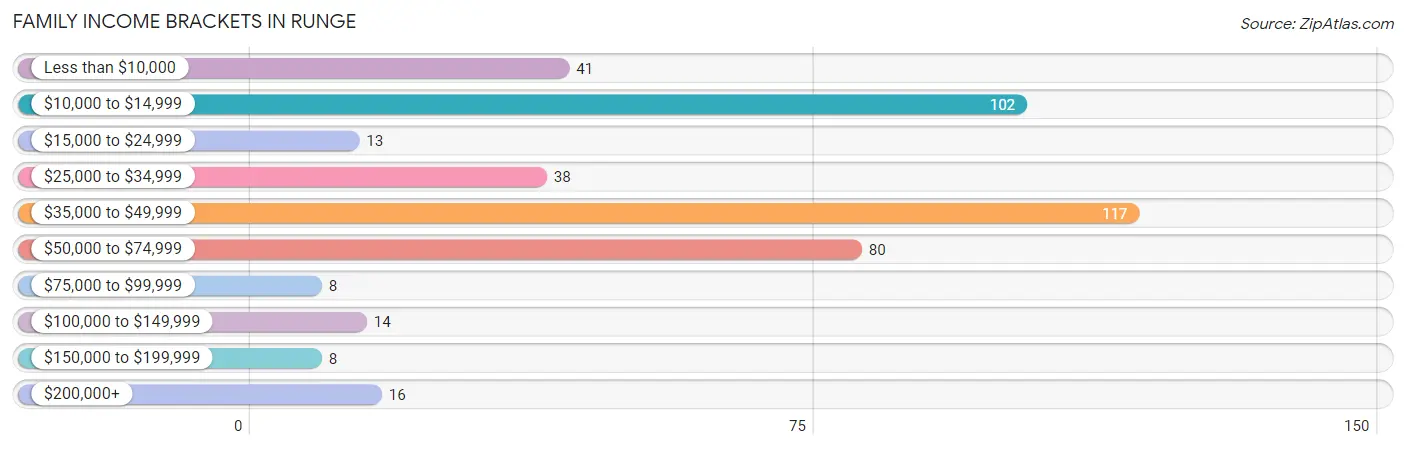
| Income Bracket | # Families | % Families |
| Less than $10,000 | 41 | 9.4% |
| $10,000 to $14,999 | 102 | 23.3% |
| $15,000 to $24,999 | 13 | 3.0% |
| $25,000 to $34,999 | 38 | 8.7% |
| $35,000 to $49,999 | 117 | 26.8% |
| $50,000 to $74,999 | 80 | 18.3% |
| $75,000 to $99,999 | 8 | 1.8% |
| $100,000 to $149,999 | 14 | 3.2% |
| $150,000 to $199,999 | 8 | 1.8% |
| $200,000+ | 16 | 3.7% |
Family Income by Famaliy Size in Runge
3-person families (108 | 24.7%) account for the highest median family income in Runge with $65,263 per family, while 3-person families (108 | 24.7%) have the highest median income of $21,754 per family member.
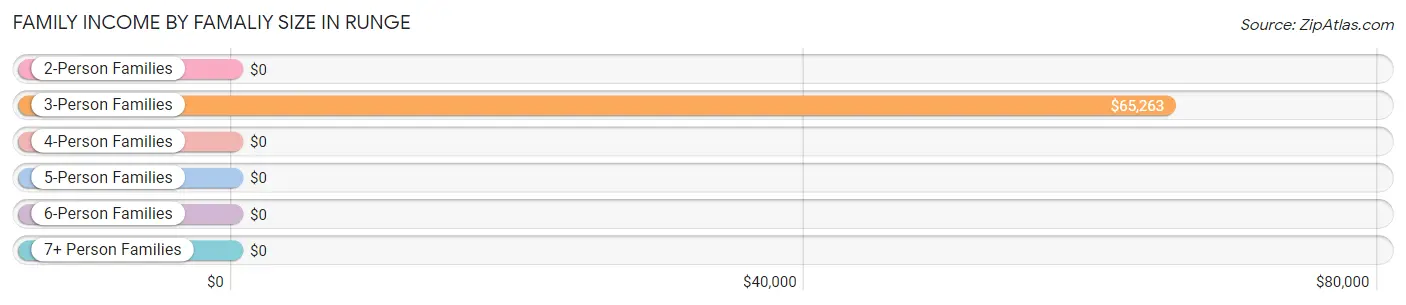
| Income Bracket | # Families | Median Income |
| 2-Person Families | 254 (58.1%) | $0 |
| 3-Person Families | 108 (24.7%) | $65,263 |
| 4-Person Families | 46 (10.5%) | $0 |
| 5-Person Families | 20 (4.6%) | $0 |
| 6-Person Families | 9 (2.1%) | $0 |
| 7+ Person Families | 0 (0.0%) | $0 |
| Total | 437 (100.0%) | $37,575 |
Family Income by Number of Earners in Runge
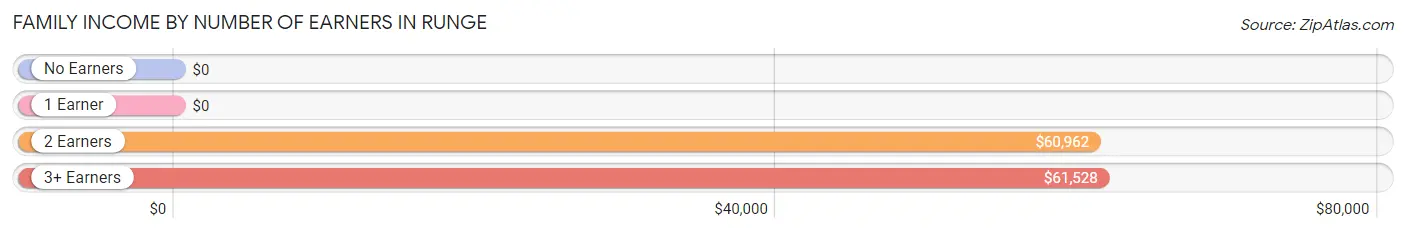
| Number of Earners | # Families | Median Income |
| No Earners | 89 (20.4%) | $0 |
| 1 Earner | 201 (46.0%) | $0 |
| 2 Earners | 120 (27.5%) | $60,962 |
| 3+ Earners | 27 (6.2%) | $61,528 |
| Total | 437 (100.0%) | $37,575 |
Household Income in Runge
Household Income Brackets in Runge
With 136 households falling in the category, the $35,000 to $49,999 income range is the most frequent in Runge, accounting for 24.9% of all households. In contrast, only 8 households (1.5%) fall into the $75,000 to $99,999 income bracket, making it the least populous group.
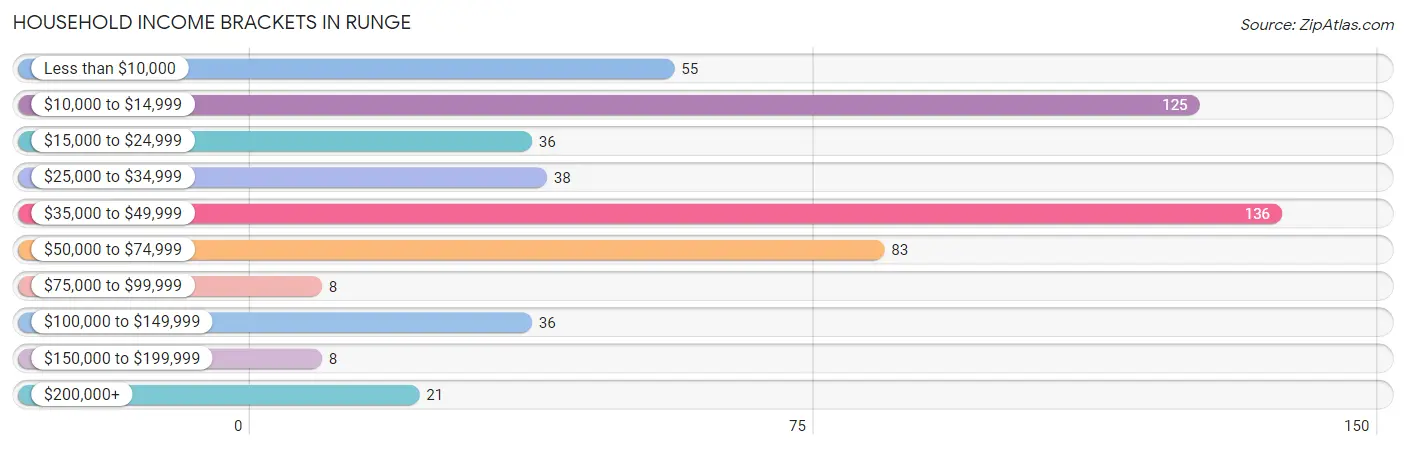
| Income Bracket | # Households | % Households |
| Less than $10,000 | 55 | 10.1% |
| $10,000 to $14,999 | 125 | 22.9% |
| $15,000 to $24,999 | 36 | 6.6% |
| $25,000 to $34,999 | 38 | 7.0% |
| $35,000 to $49,999 | 136 | 24.9% |
| $50,000 to $74,999 | 83 | 15.2% |
| $75,000 to $99,999 | 8 | 1.5% |
| $100,000 to $149,999 | 36 | 6.6% |
| $150,000 to $199,999 | 8 | 1.5% |
| $200,000+ | 21 | 3.8% |
Household Income by Householder Age in Runge
The median household income in Runge is $36,638, with the highest median household income of $44,113 found in the 25 to 44 years age bracket for the primary householder. A total of 184 households (33.7%) fall into this category. Meanwhile, the 15 to 24 years age bracket for the primary householder has the lowest median household income of $0, with 111 households (20.3%) in this group.
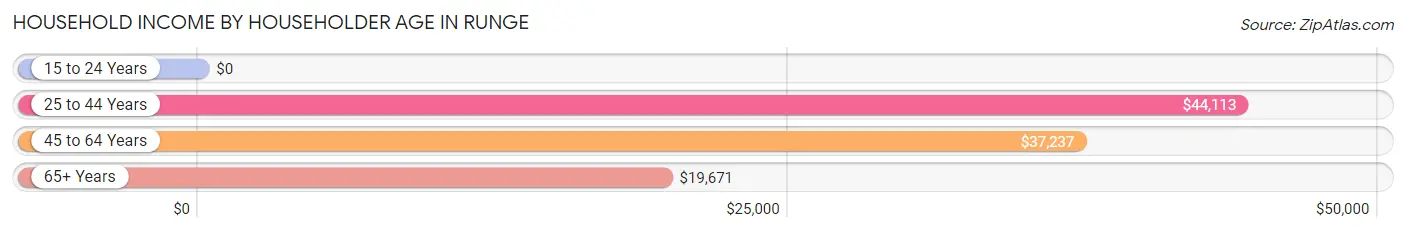
| Income Bracket | # Households | Median Income |
| 15 to 24 Years | 111 (20.3%) | $0 |
| 25 to 44 Years | 184 (33.7%) | $44,113 |
| 45 to 64 Years | 120 (22.0%) | $37,237 |
| 65+ Years | 131 (24.0%) | $19,671 |
| Total | 546 (100.0%) | $36,638 |
Poverty in Runge
Income Below Poverty by Sex and Age in Runge
With 10.4% poverty level for males and 43.5% for females among the residents of Runge, 18 to 24 year old males and under 5 year old females are the most vulnerable to poverty, with 29 males (59.2%) and 82 females (83.7%) in their respective age groups living below the poverty level.
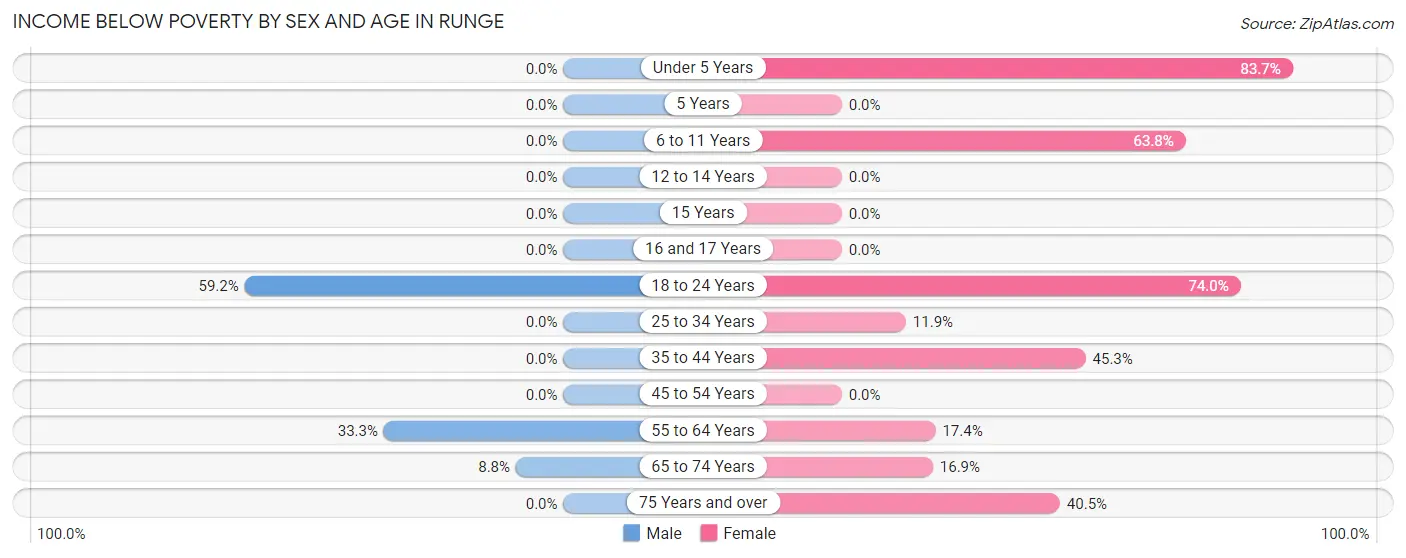
| Age Bracket | Male | Female |
| Under 5 Years | 0 (0.0%) | 82 (83.7%) |
| 5 Years | 0 (0.0%) | 0 (0.0%) |
| 6 to 11 Years | 0 (0.0%) | 67 (63.8%) |
| 12 to 14 Years | 0 (0.0%) | 0 (0.0%) |
| 15 Years | 0 (0.0%) | 0 (0.0%) |
| 16 and 17 Years | 0 (0.0%) | 0 (0.0%) |
| 18 to 24 Years | 29 (59.2%) | 111 (74.0%) |
| 25 to 34 Years | 0 (0.0%) | 10 (11.9%) |
| 35 to 44 Years | 0 (0.0%) | 43 (45.3%) |
| 45 to 54 Years | 0 (0.0%) | 0 (0.0%) |
| 55 to 64 Years | 7 (33.3%) | 8 (17.4%) |
| 65 to 74 Years | 3 (8.8%) | 12 (16.9%) |
| 75 Years and over | 0 (0.0%) | 17 (40.5%) |
| Total | 39 (10.4%) | 350 (43.5%) |
Income Above Poverty by Sex and Age in Runge
According to the poverty statistics in Runge, males aged under 5 years and females aged 16 and 17 years are the age groups that are most secure financially, with 100.0% of males and 100.0% of females in these age groups living above the poverty line.
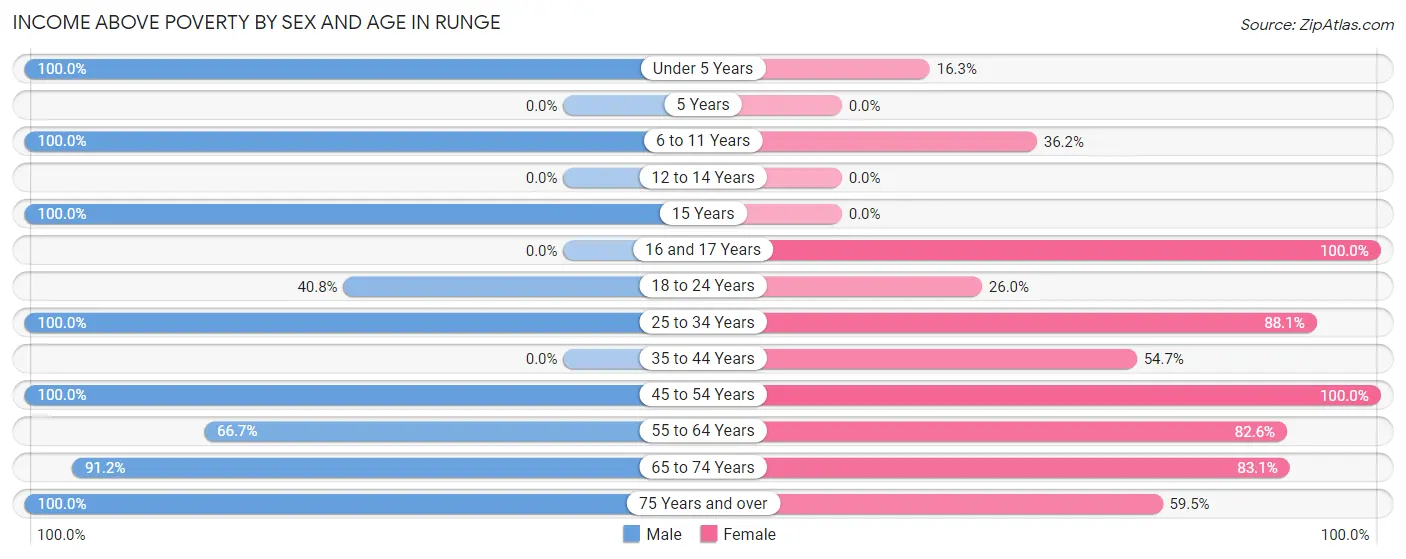
| Age Bracket | Male | Female |
| Under 5 Years | 50 (100.0%) | 16 (16.3%) |
| 5 Years | 0 (0.0%) | 0 (0.0%) |
| 6 to 11 Years | 36 (100.0%) | 38 (36.2%) |
| 12 to 14 Years | 0 (0.0%) | 0 (0.0%) |
| 15 Years | 9 (100.0%) | 0 (0.0%) |
| 16 and 17 Years | 0 (0.0%) | 43 (100.0%) |
| 18 to 24 Years | 20 (40.8%) | 39 (26.0%) |
| 25 to 34 Years | 80 (100.0%) | 74 (88.1%) |
| 35 to 44 Years | 0 (0.0%) | 52 (54.7%) |
| 45 to 54 Years | 78 (100.0%) | 71 (100.0%) |
| 55 to 64 Years | 14 (66.7%) | 38 (82.6%) |
| 65 to 74 Years | 31 (91.2%) | 59 (83.1%) |
| 75 Years and over | 17 (100.0%) | 25 (59.5%) |
| Total | 335 (89.6%) | 455 (56.5%) |
Income Below Poverty Among Married-Couple Families in Runge
The poverty statistics for married-couple families in Runge show that 4.0% or 7 of the total 176 families live below the poverty line. Families with 1 or 2 children have the highest poverty rate of 8.2%, comprising of 7 families. On the other hand, families with no children have the lowest poverty rate of 0.0%, which includes 0 families.
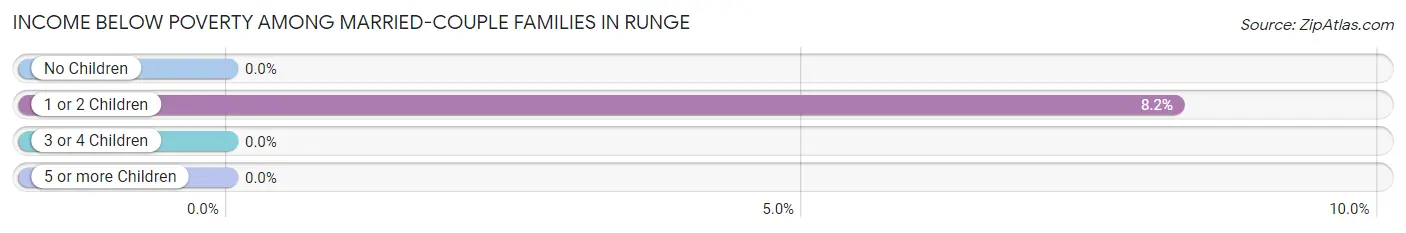
| Children | Above Poverty | Below Poverty |
| No Children | 91 (100.0%) | 0 (0.0%) |
| 1 or 2 Children | 78 (91.8%) | 7 (8.2%) |
| 3 or 4 Children | 0 (0.0%) | 0 (0.0%) |
| 5 or more Children | 0 (0.0%) | 0 (0.0%) |
| Total | 169 (96.0%) | 7 (4.0%) |
Income Below Poverty Among Single-Parent Households in Runge
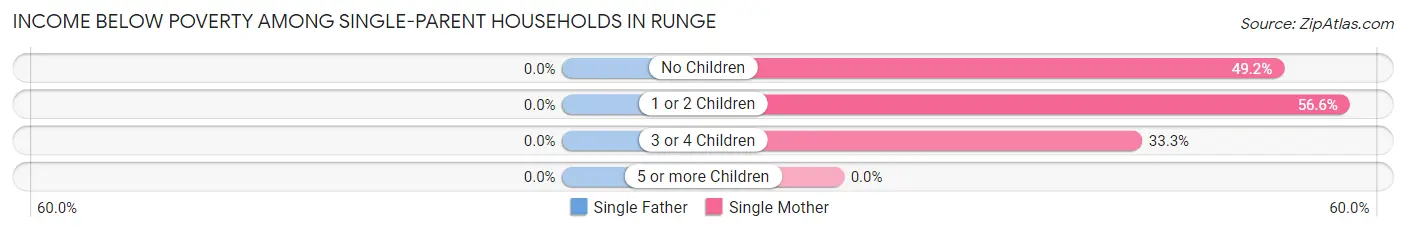
| Children | Single Father | Single Mother |
| No Children | 0 (0.0%) | 31 (49.2%) |
| 1 or 2 Children | 0 (0.0%) | 95 (56.6%) |
| 3 or 4 Children | 0 (0.0%) | 10 (33.3%) |
| 5 or more Children | 0 (0.0%) | 0 (0.0%) |
| Total | 0 (0.0%) | 136 (52.1%) |
Income Below Poverty Among Married-Couple vs Single-Parent Households in Runge
The poverty data for Runge shows that 7 of the married-couple family households (4.0%) and 136 of the single-parent households (52.1%) are living below the poverty level. Within the married-couple family households, those with 1 or 2 children have the highest poverty rate, with 7 households (8.2%) falling below the poverty line. Among the single-parent households, those with 1 or 2 children have the highest poverty rate, with 95 household (56.6%) living below poverty.
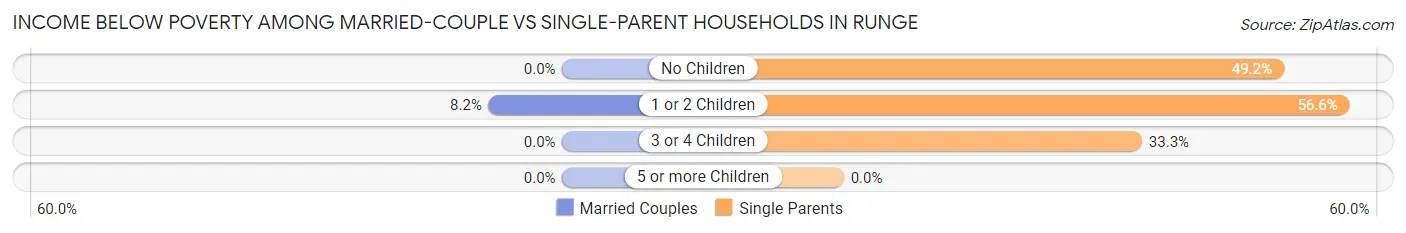
| Children | Married-Couple Families | Single-Parent Households |
| No Children | 0 (0.0%) | 31 (49.2%) |
| 1 or 2 Children | 7 (8.2%) | 95 (56.6%) |
| 3 or 4 Children | 0 (0.0%) | 10 (33.3%) |
| 5 or more Children | 0 (0.0%) | 0 (0.0%) |
| Total | 7 (4.0%) | 136 (52.1%) |
Race in Runge
The most populous races in Runge are Hispanic or Latino (1,048 | 87.3%), White / Caucasian (734 | 61.1%), and Two or more Races (275 | 22.9%).
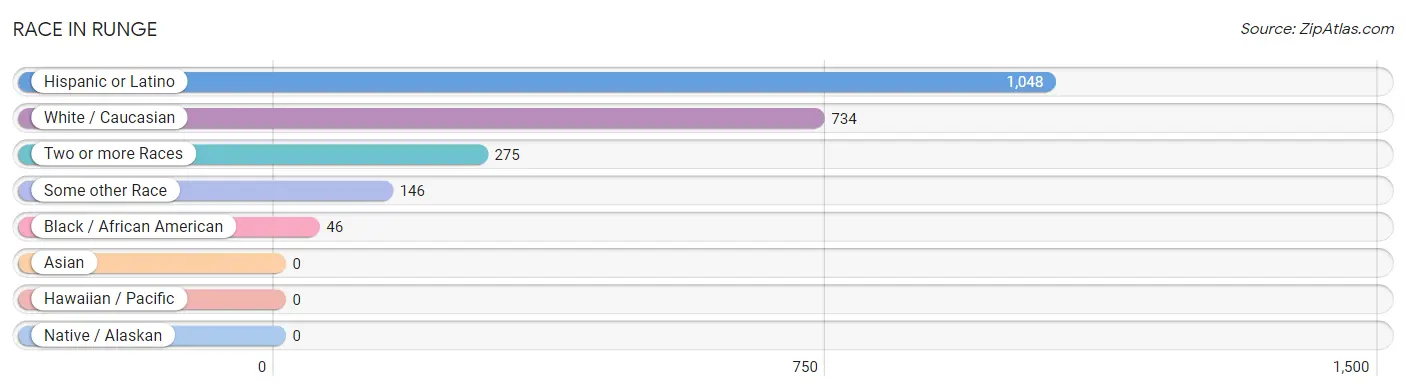
| Race | # Population | % Population |
| Asian | 0 | 0.0% |
| Black / African American | 46 | 3.8% |
| Hawaiian / Pacific | 0 | 0.0% |
| Hispanic or Latino | 1,048 | 87.3% |
| Native / Alaskan | 0 | 0.0% |
| White / Caucasian | 734 | 61.1% |
| Two or more Races | 275 | 22.9% |
| Some other Race | 146 | 12.2% |
| Total | 1,201 | 100.0% |
Ancestry in Runge
The most populous ancestries reported in Runge are Mexican (1,048 | 87.3%), American (31 | 2.6%), Cajun (30 | 2.5%), Czech (17 | 1.4%), and French Canadian (16 | 1.3%), together accounting for 95.1% of all Runge residents.
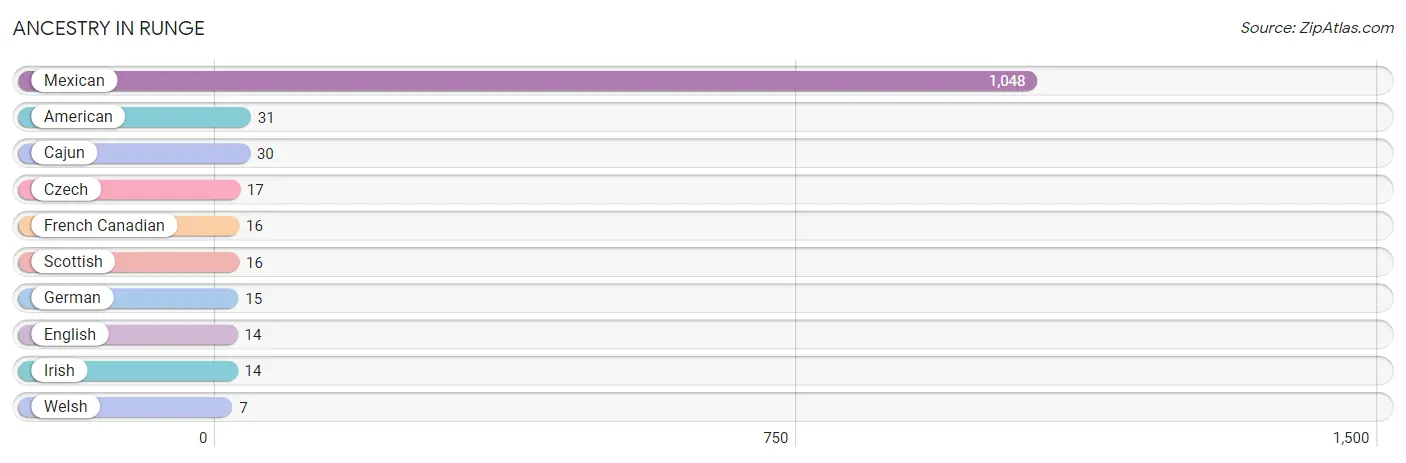
| Ancestry | # Population | % Population |
| American | 31 | 2.6% |
| Cajun | 30 | 2.5% |
| Czech | 17 | 1.4% |
| English | 14 | 1.2% |
| French Canadian | 16 | 1.3% |
| German | 15 | 1.3% |
| Irish | 14 | 1.2% |
| Mexican | 1,048 | 87.3% |
| Scottish | 16 | 1.3% |
| Welsh | 7 | 0.6% | View All 10 Rows |
Immigrants in Runge

| Immigration Origin | # Population | % Population | View All 0 Rows |
Sex and Age in Runge
Sex and Age in Runge
The most populous age groups in Runge are Under 5 Years (57 | 14.4%) for men and 20 to 24 Years (135 | 16.8%) for women.
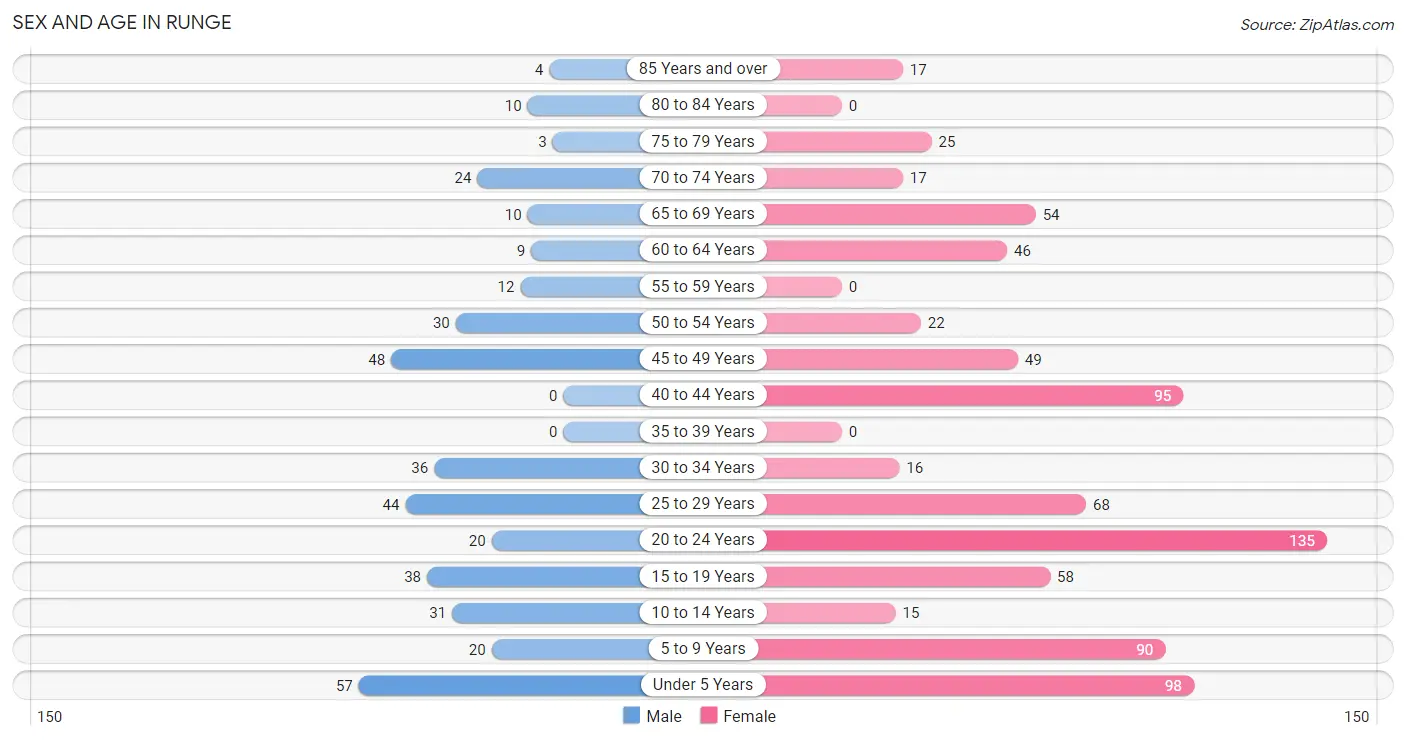
| Age Bracket | Male | Female |
| Under 5 Years | 57 (14.4%) | 98 (12.2%) |
| 5 to 9 Years | 20 (5.1%) | 90 (11.2%) |
| 10 to 14 Years | 31 (7.8%) | 15 (1.9%) |
| 15 to 19 Years | 38 (9.6%) | 58 (7.2%) |
| 20 to 24 Years | 20 (5.1%) | 135 (16.8%) |
| 25 to 29 Years | 44 (11.1%) | 68 (8.5%) |
| 30 to 34 Years | 36 (9.1%) | 16 (2.0%) |
| 35 to 39 Years | 0 (0.0%) | 0 (0.0%) |
| 40 to 44 Years | 0 (0.0%) | 95 (11.8%) |
| 45 to 49 Years | 48 (12.1%) | 49 (6.1%) |
| 50 to 54 Years | 30 (7.6%) | 22 (2.7%) |
| 55 to 59 Years | 12 (3.0%) | 0 (0.0%) |
| 60 to 64 Years | 9 (2.3%) | 46 (5.7%) |
| 65 to 69 Years | 10 (2.5%) | 54 (6.7%) |
| 70 to 74 Years | 24 (6.1%) | 17 (2.1%) |
| 75 to 79 Years | 3 (0.8%) | 25 (3.1%) |
| 80 to 84 Years | 10 (2.5%) | 0 (0.0%) |
| 85 Years and over | 4 (1.0%) | 17 (2.1%) |
| Total | 396 (100.0%) | 805 (100.0%) |
Families and Households in Runge
Median Family Size in Runge
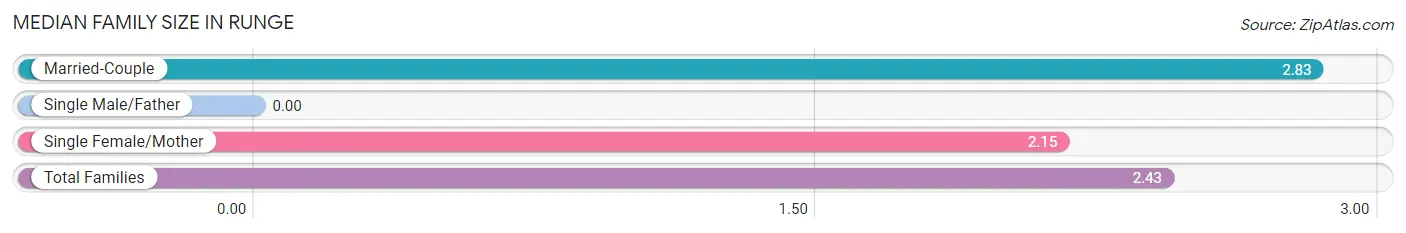
| Family Type | # Families | Family Size |
| Married-Couple | 176 (40.3%) | 2.83 |
| Single Male/Father | 0 (0.0%) | - |
| Single Female/Mother | 261 (59.7%) | 2.15 |
| Total Families | 437 (100.0%) | 2.43 |
Median Household Size in Runge
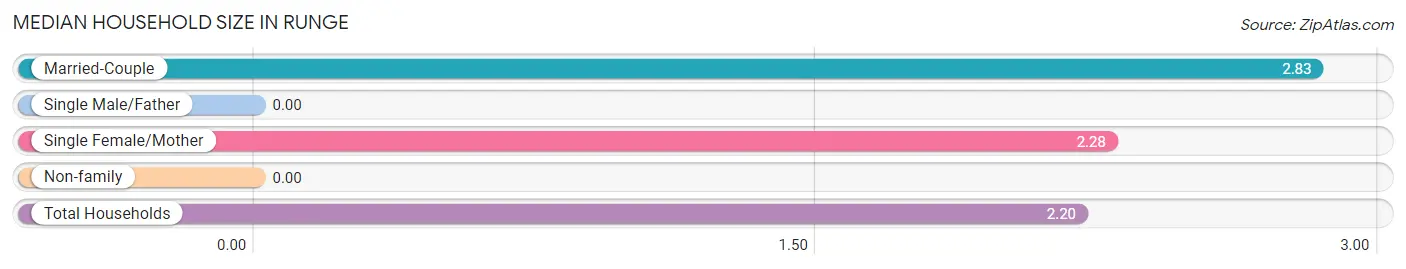
| Household Type | # Households | Household Size |
| Married-Couple | 176 (32.2%) | 2.83 |
| Single Male/Father | 0 (0.0%) | - |
| Single Female/Mother | 261 (47.8%) | 2.28 |
| Non-family | 109 (20.0%) | - |
| Total Households | 546 (100.0%) | 2.20 |
Household Size by Marriage Status in Runge
Out of a total of 546 households in Runge, 437 (80.0%) are family households, while 109 (20.0%) are nonfamily households. The most numerous type of family households are 2-person households, comprising 224, and the most common type of nonfamily households are 1-person households, comprising 109.
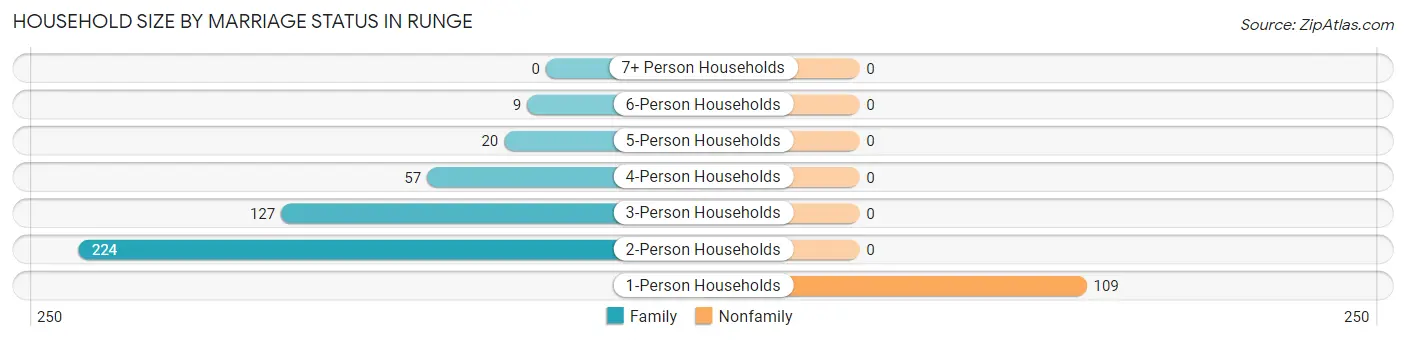
| Household Size | Family Households | Nonfamily Households |
| 1-Person Households | - | 109 (20.0%) |
| 2-Person Households | 224 (41.0%) | 0 (0.0%) |
| 3-Person Households | 127 (23.3%) | 0 (0.0%) |
| 4-Person Households | 57 (10.4%) | 0 (0.0%) |
| 5-Person Households | 20 (3.7%) | 0 (0.0%) |
| 6-Person Households | 9 (1.7%) | 0 (0.0%) |
| 7+ Person Households | 0 (0.0%) | 0 (0.0%) |
| Total | 437 (80.0%) | 109 (20.0%) |
Female Fertility in Runge
Fertility by Age in Runge
Average fertility rate in Runge is 318.0 births per 1,000 women. Women in the age bracket of 20 to 34 years have the highest fertility rate with 598.0 births per 1,000 women. Women in the age bracket of 20 to 34 years acount for 95.6% of all women with births.
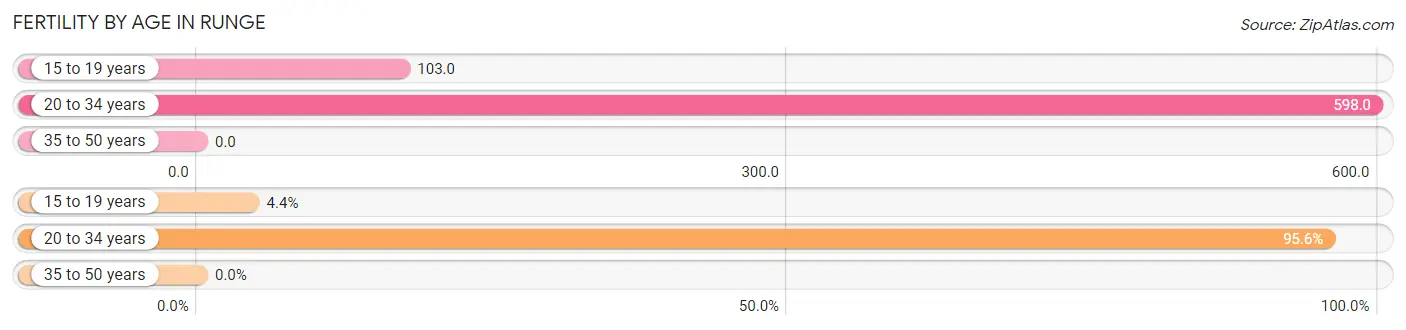
| Age Bracket | Women with Births | Births / 1,000 Women |
| 15 to 19 years | 6 (4.4%) | 103.0 |
| 20 to 34 years | 131 (95.6%) | 598.0 |
| 35 to 50 years | 0 (0.0%) | 0.0 |
| Total | 137 (100.0%) | 318.0 |
Fertility by Age by Marriage Status in Runge
11.7% of women with births (137) in Runge are married. The highest percentage of unmarried women with births falls into 15 to 19 years age bracket with 100.0% of them unmarried at the time of birth, while the lowest percentage of unmarried women with births belong to 20 to 34 years age bracket with 87.8% of them unmarried.
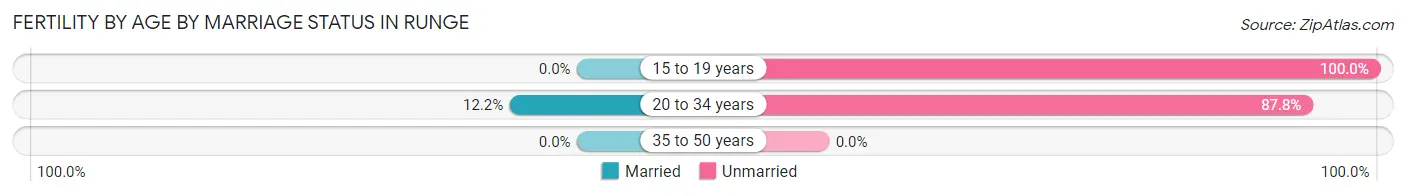
| Age Bracket | Married | Unmarried |
| 15 to 19 years | 0 (0.0%) | 6 (100.0%) |
| 20 to 34 years | 16 (12.2%) | 115 (87.8%) |
| 35 to 50 years | 0 (0.0%) | 0 (0.0%) |
| Total | 16 (11.7%) | 121 (88.3%) |
Fertility by Education in Runge
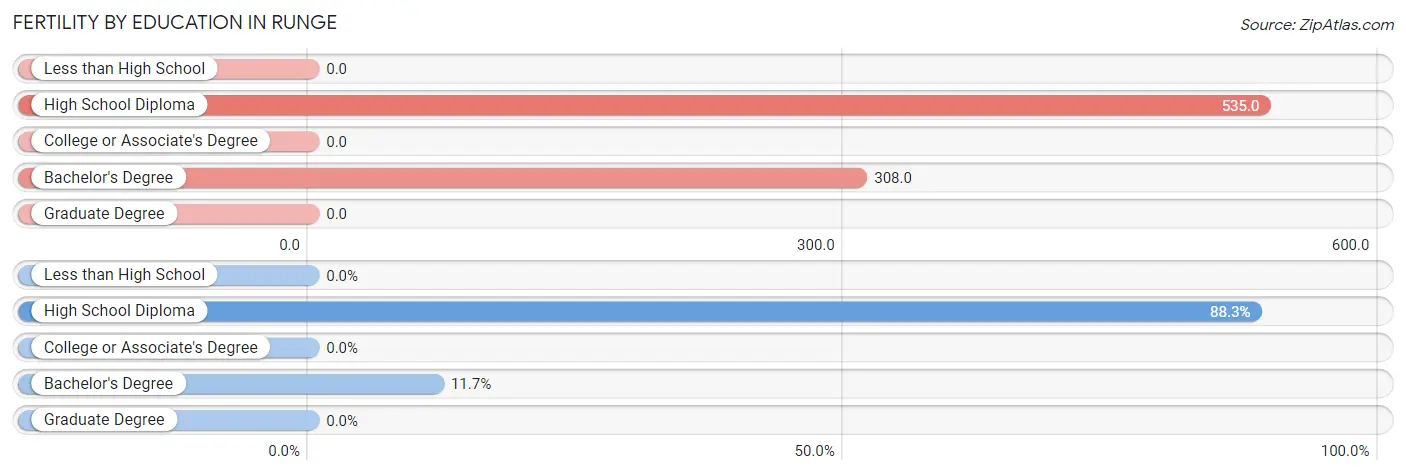
| Educational Attainment | Women with Births | Births / 1,000 Women |
| Less than High School | 0 (0.0%) | 0.0 |
| High School Diploma | 121 (88.3%) | 535.0 |
| College or Associate's Degree | 0 (0.0%) | 0.0 |
| Bachelor's Degree | 16 (11.7%) | 308.0 |
| Graduate Degree | 0 (0.0%) | 0.0 |
| Total | 137 (100.0%) | 318.0 |
Fertility by Education by Marriage Status in Runge
88.3% of women with births in Runge are unmarried. Women with the educational attainment of bachelor's degree are most likely to be married with 100.0% of them married at childbirth, while women with the educational attainment of high school diploma are least likely to be married with 100.0% of them unmarried at childbirth.
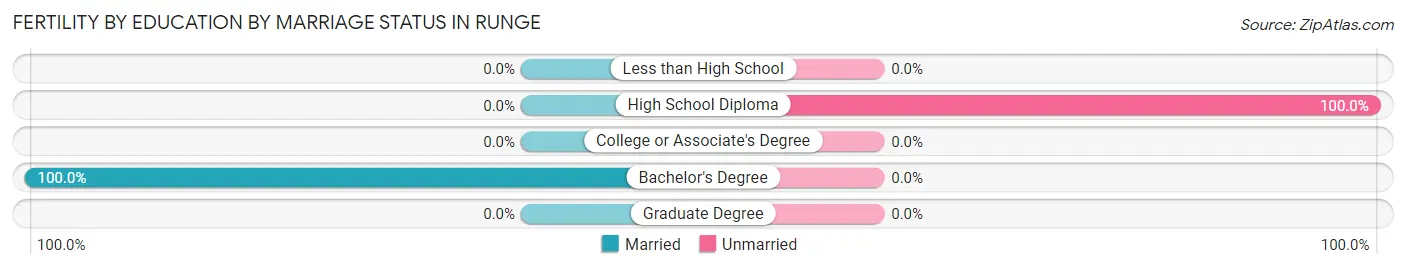
| Educational Attainment | Married | Unmarried |
| Less than High School | 0 (0.0%) | 0 (0.0%) |
| High School Diploma | 0 (0.0%) | 121 (100.0%) |
| College or Associate's Degree | 0 (0.0%) | 0 (0.0%) |
| Bachelor's Degree | 16 (100.0%) | 0 (0.0%) |
| Graduate Degree | 0 (0.0%) | 0 (0.0%) |
| Total | 16 (11.7%) | 121 (88.3%) |
Employment Characteristics in Runge
Employment by Class of Employer in Runge
Among the 525 employed individuals in Runge, private company employees (331 | 63.0%), local government employees (94 | 17.9%), and not-for-profit organizations (49 | 9.3%) make up the most common classes of employment.
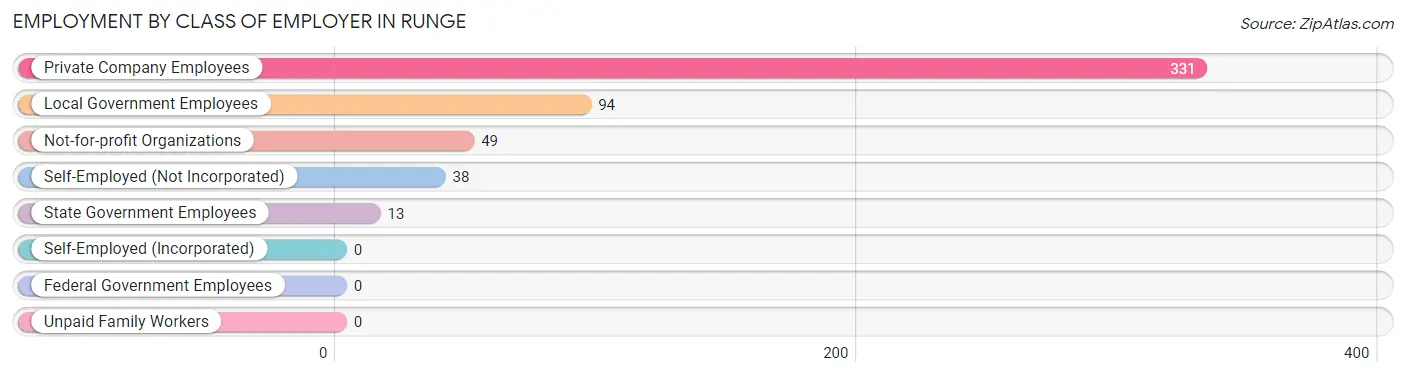
| Employer Class | # Employees | % Employees |
| Private Company Employees | 331 | 63.0% |
| Self-Employed (Incorporated) | 0 | 0.0% |
| Self-Employed (Not Incorporated) | 38 | 7.2% |
| Not-for-profit Organizations | 49 | 9.3% |
| Local Government Employees | 94 | 17.9% |
| State Government Employees | 13 | 2.5% |
| Federal Government Employees | 0 | 0.0% |
| Unpaid Family Workers | 0 | 0.0% |
| Total | 525 | 100.0% |
Employment Status by Age in Runge
According to the labor force statistics for Runge, out of the total population over 16 years of age (881), 60.3% or 531 individuals are in the labor force, with 1.1% or 6 of them unemployed. The age group with the highest labor force participation rate is 20 to 24 years, with 100.0% or 155 individuals in the labor force. Within the labor force, the 16 to 19 years age range has the highest percentage of unemployed individuals, with 40.0% or 6 of them being unemployed.
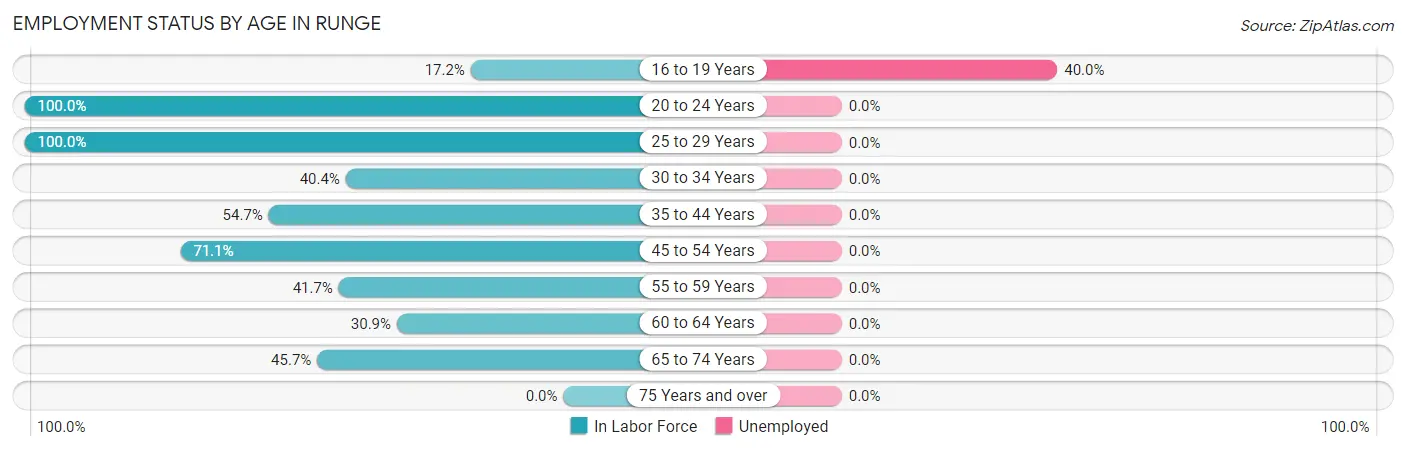
| Age Bracket | In Labor Force | Unemployed |
| 16 to 19 Years | 15 (17.2%) | 6 (40.0%) |
| 20 to 24 Years | 155 (100.0%) | 0 (0.0%) |
| 25 to 29 Years | 112 (100.0%) | 0 (0.0%) |
| 30 to 34 Years | 21 (40.4%) | 0 (0.0%) |
| 35 to 44 Years | 52 (54.7%) | 0 (0.0%) |
| 45 to 54 Years | 106 (71.1%) | 0 (0.0%) |
| 55 to 59 Years | 5 (41.7%) | 0 (0.0%) |
| 60 to 64 Years | 17 (30.9%) | 0 (0.0%) |
| 65 to 74 Years | 48 (45.7%) | 0 (0.0%) |
| 75 Years and over | 0 (0.0%) | 0 (0.0%) |
| Total | 531 (60.3%) | 6 (1.1%) |
Employment Status by Educational Attainment in Runge
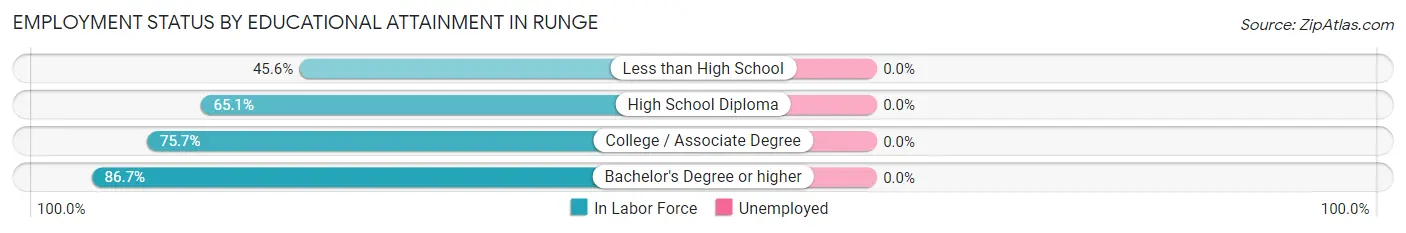
| Educational Attainment | In Labor Force | Unemployed |
| Less than High School | 47 (45.6%) | 0 (0.0%) |
| High School Diploma | 136 (65.1%) | 0 (0.0%) |
| College / Associate Degree | 78 (75.7%) | 0 (0.0%) |
| Bachelor's Degree or higher | 52 (86.7%) | 0 (0.0%) |
| Total | 313 (65.9%) | 0 (0.0%) |
Employment Occupations by Sex in Runge
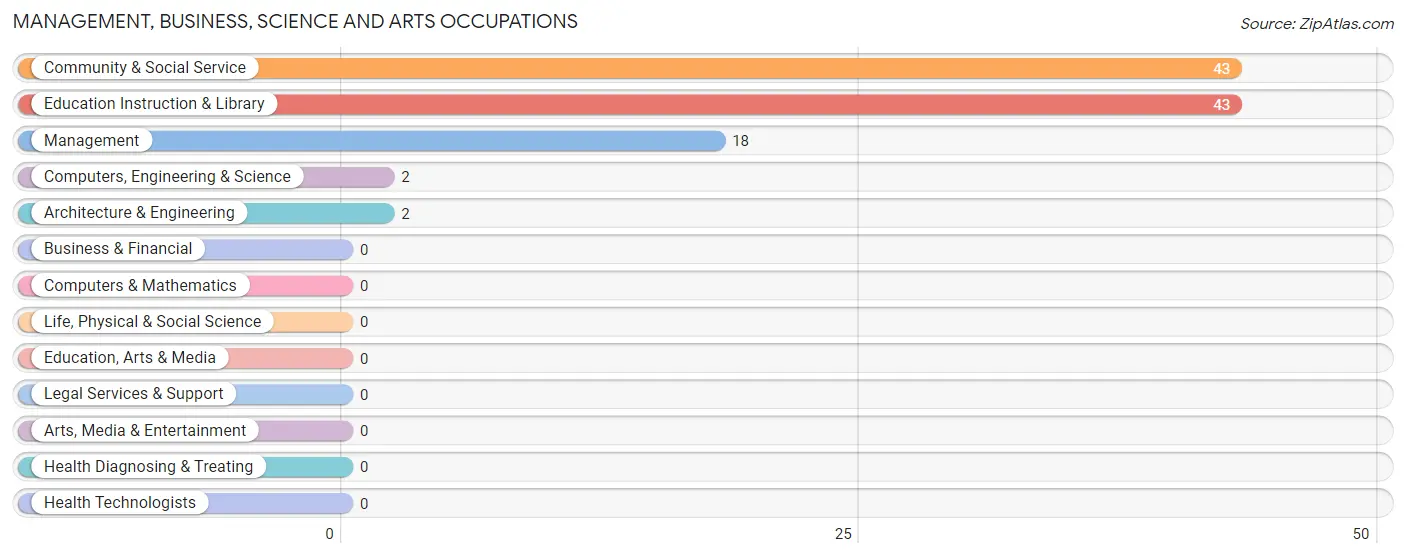
Management, Business, Science and Arts Occupations
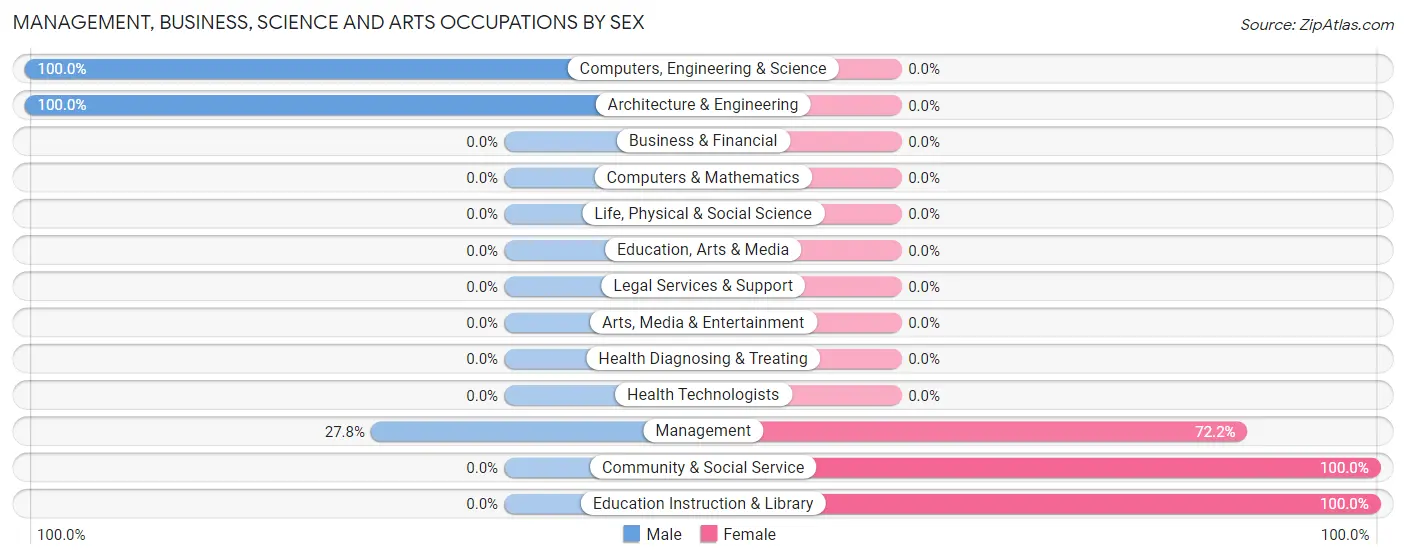
The most common Management, Business, Science and Arts occupations in Runge are Community & Social Service (43 | 8.2%), Education Instruction & Library (43 | 8.2%), Management (18 | 3.4%), Computers, Engineering & Science (2 | 0.4%), and Architecture & Engineering (2 | 0.4%).
Management, Business, Science and Arts Occupations by Sex
Within the Management, Business, Science and Arts occupations in Runge, the most male-oriented occupations are Computers, Engineering & Science (100.0%), Architecture & Engineering (100.0%), and Management (27.8%), while the most female-oriented occupations are Community & Social Service (100.0%), Education Instruction & Library (100.0%), and Management (72.2%).
| Occupation | Male | Female |
| Management | 5 (27.8%) | 13 (72.2%) |
| Business & Financial | 0 (0.0%) | 0 (0.0%) |
| Computers, Engineering & Science | 2 (100.0%) | 0 (0.0%) |
| Computers & Mathematics | 0 (0.0%) | 0 (0.0%) |
| Architecture & Engineering | 2 (100.0%) | 0 (0.0%) |
| Life, Physical & Social Science | 0 (0.0%) | 0 (0.0%) |
| Community & Social Service | 0 (0.0%) | 43 (100.0%) |
| Education, Arts & Media | 0 (0.0%) | 0 (0.0%) |
| Legal Services & Support | 0 (0.0%) | 0 (0.0%) |
| Education Instruction & Library | 0 (0.0%) | 43 (100.0%) |
| Arts, Media & Entertainment | 0 (0.0%) | 0 (0.0%) |
| Health Diagnosing & Treating | 0 (0.0%) | 0 (0.0%) |
| Health Technologists | 0 (0.0%) | 0 (0.0%) |
| Total (Category) | 7 (11.1%) | 56 (88.9%) |
| Total (Overall) | 177 (33.7%) | 348 (66.3%) |
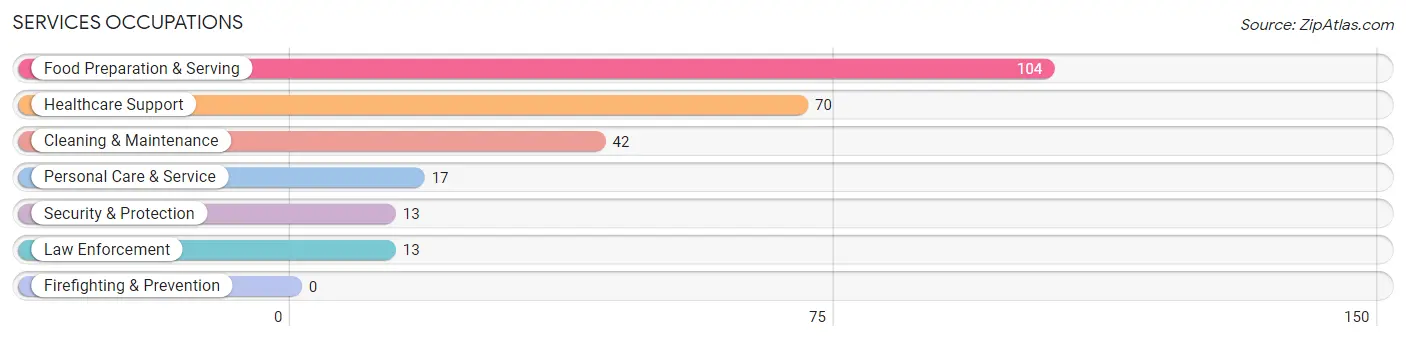
Services Occupations
The most common Services occupations in Runge are Food Preparation & Serving (104 | 19.8%), Healthcare Support (70 | 13.3%), Cleaning & Maintenance (42 | 8.0%), Personal Care & Service (17 | 3.2%), and Security & Protection (13 | 2.5%).
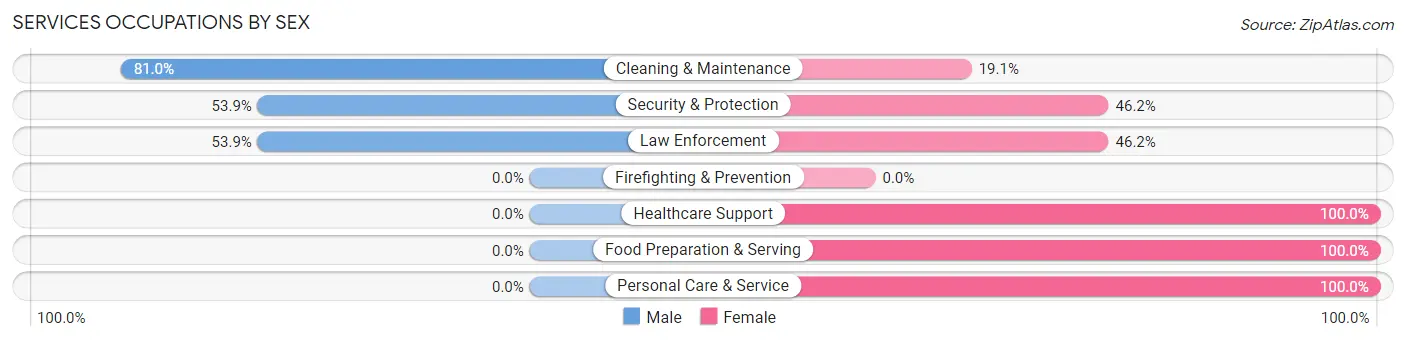
Services Occupations by Sex
Within the Services occupations in Runge, the most male-oriented occupations are Cleaning & Maintenance (80.9%), Security & Protection (53.8%), and Law Enforcement (53.8%), while the most female-oriented occupations are Healthcare Support (100.0%), Food Preparation & Serving (100.0%), and Personal Care & Service (100.0%).
| Occupation | Male | Female |
| Healthcare Support | 0 (0.0%) | 70 (100.0%) |
| Security & Protection | 7 (53.8%) | 6 (46.2%) |
| Firefighting & Prevention | 0 (0.0%) | 0 (0.0%) |
| Law Enforcement | 7 (53.8%) | 6 (46.2%) |
| Food Preparation & Serving | 0 (0.0%) | 104 (100.0%) |
| Cleaning & Maintenance | 34 (80.9%) | 8 (19.1%) |
| Personal Care & Service | 0 (0.0%) | 17 (100.0%) |
| Total (Category) | 41 (16.7%) | 205 (83.3%) |
| Total (Overall) | 177 (33.7%) | 348 (66.3%) |
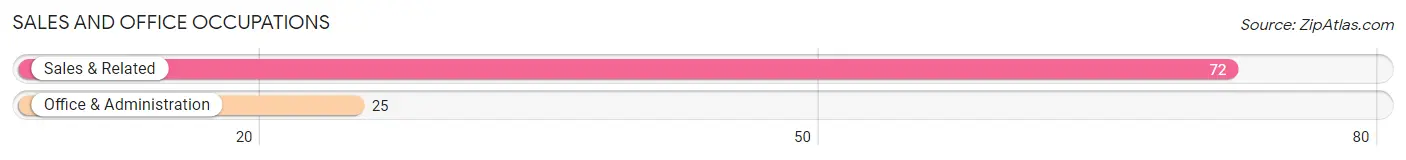
Sales and Office Occupations
The most common Sales and Office occupations in Runge are Sales & Related (72 | 13.7%), and Office & Administration (25 | 4.8%).
Sales and Office Occupations by Sex
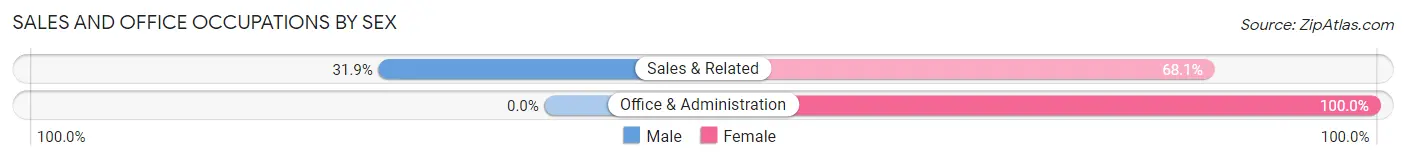
| Occupation | Male | Female |
| Sales & Related | 23 (31.9%) | 49 (68.1%) |
| Office & Administration | 0 (0.0%) | 25 (100.0%) |
| Total (Category) | 23 (23.7%) | 74 (76.3%) |
| Total (Overall) | 177 (33.7%) | 348 (66.3%) |
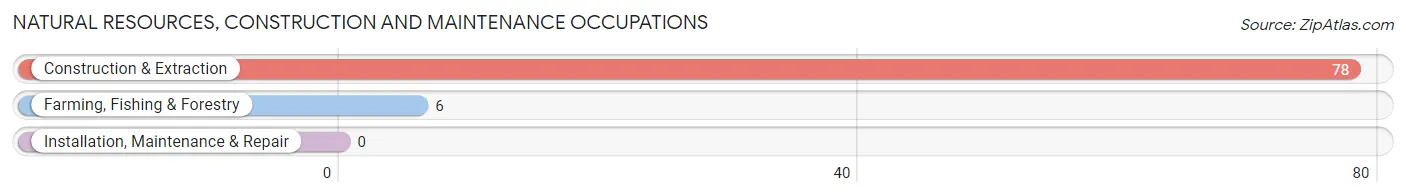
Natural Resources, Construction and Maintenance Occupations
The most common Natural Resources, Construction and Maintenance occupations in Runge are Construction & Extraction (78 | 14.9%), and Farming, Fishing & Forestry (6 | 1.1%).
Natural Resources, Construction and Maintenance Occupations by Sex
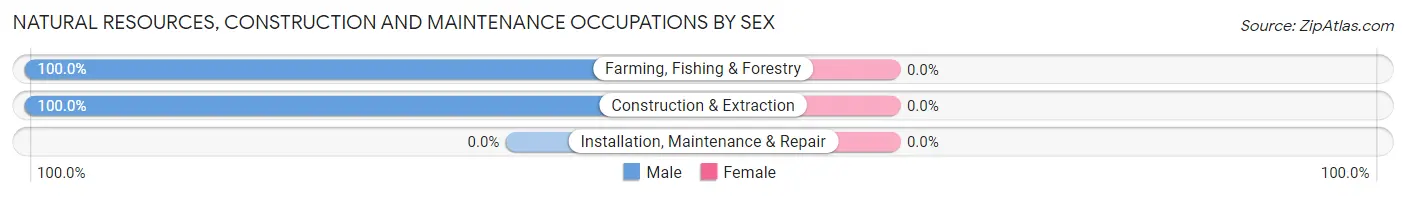
| Occupation | Male | Female |
| Farming, Fishing & Forestry | 6 (100.0%) | 0 (0.0%) |
| Construction & Extraction | 78 (100.0%) | 0 (0.0%) |
| Installation, Maintenance & Repair | 0 (0.0%) | 0 (0.0%) |
| Total (Category) | 84 (100.0%) | 0 (0.0%) |
| Total (Overall) | 177 (33.7%) | 348 (66.3%) |
Production, Transportation and Moving Occupations
The most common Production, Transportation and Moving occupations in Runge are Production (21 | 4.0%), and Transportation (14 | 2.7%).
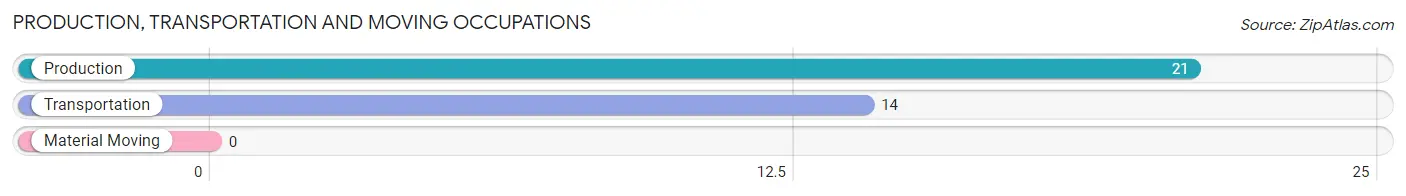
Production, Transportation and Moving Occupations by Sex
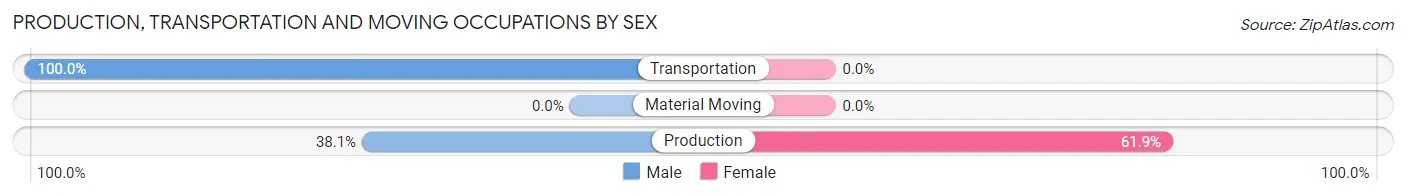
| Occupation | Male | Female |
| Production | 8 (38.1%) | 13 (61.9%) |
| Transportation | 14 (100.0%) | 0 (0.0%) |
| Material Moving | 0 (0.0%) | 0 (0.0%) |
| Total (Category) | 22 (62.9%) | 13 (37.1%) |
| Total (Overall) | 177 (33.7%) | 348 (66.3%) |
Employment Industries by Sex in Runge
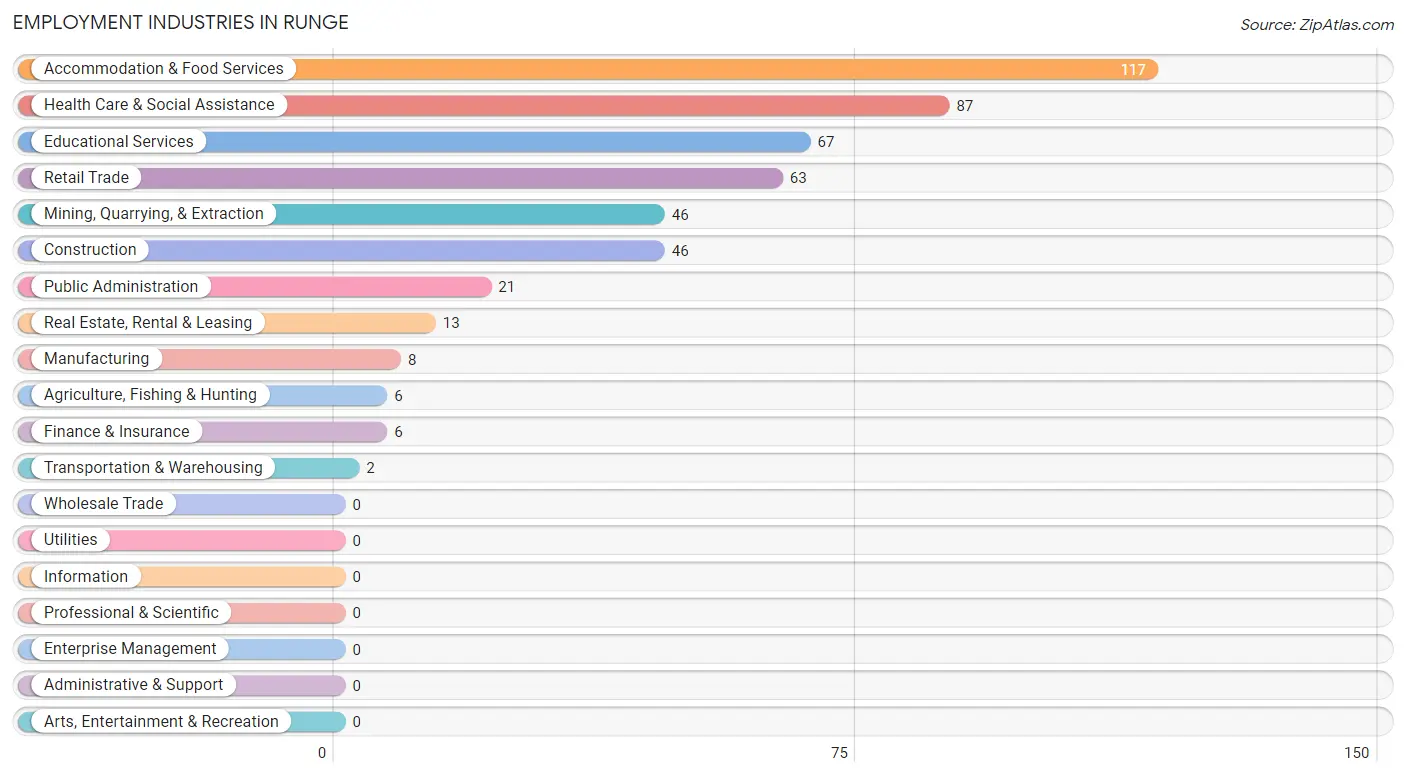
Employment Industries in Runge
The major employment industries in Runge include Accommodation & Food Services (117 | 22.3%), Health Care & Social Assistance (87 | 16.6%), Educational Services (67 | 12.8%), Retail Trade (63 | 12.0%), and Mining, Quarrying, & Extraction (46 | 8.8%).
Employment Industries by Sex in Runge
The Runge industries that see more men than women are Agriculture, Fishing & Hunting (100.0%), Mining, Quarrying, & Extraction (100.0%), and Construction (100.0%), whereas the industries that tend to have a higher number of women are Finance & Insurance (100.0%), Health Care & Social Assistance (100.0%), and Accommodation & Food Services (100.0%).
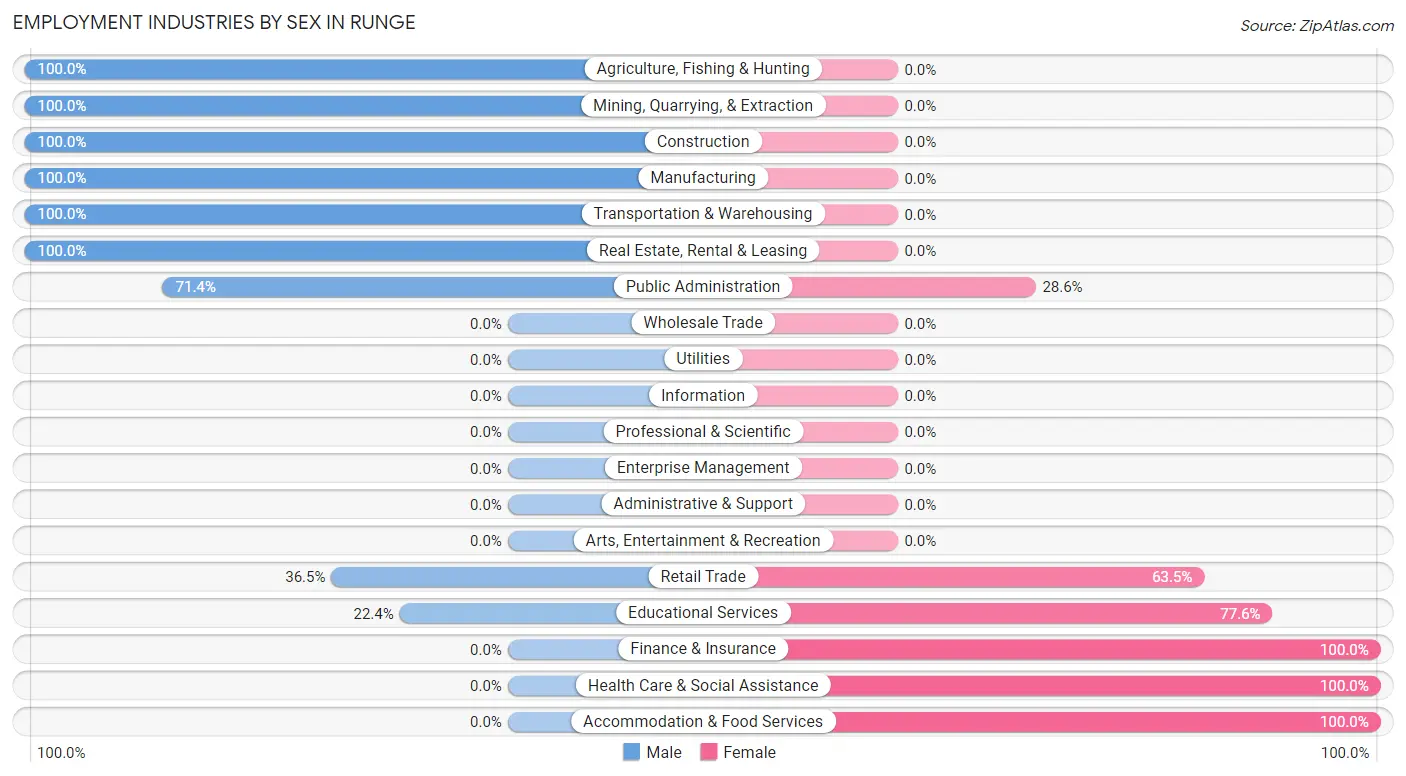
| Industry | Male | Female |
| Agriculture, Fishing & Hunting | 6 (100.0%) | 0 (0.0%) |
| Mining, Quarrying, & Extraction | 46 (100.0%) | 0 (0.0%) |
| Construction | 46 (100.0%) | 0 (0.0%) |
| Manufacturing | 8 (100.0%) | 0 (0.0%) |
| Wholesale Trade | 0 (0.0%) | 0 (0.0%) |
| Retail Trade | 23 (36.5%) | 40 (63.5%) |
| Transportation & Warehousing | 2 (100.0%) | 0 (0.0%) |
| Utilities | 0 (0.0%) | 0 (0.0%) |
| Information | 0 (0.0%) | 0 (0.0%) |
| Finance & Insurance | 0 (0.0%) | 6 (100.0%) |
| Real Estate, Rental & Leasing | 13 (100.0%) | 0 (0.0%) |
| Professional & Scientific | 0 (0.0%) | 0 (0.0%) |
| Enterprise Management | 0 (0.0%) | 0 (0.0%) |
| Administrative & Support | 0 (0.0%) | 0 (0.0%) |
| Educational Services | 15 (22.4%) | 52 (77.6%) |
| Health Care & Social Assistance | 0 (0.0%) | 87 (100.0%) |
| Arts, Entertainment & Recreation | 0 (0.0%) | 0 (0.0%) |
| Accommodation & Food Services | 0 (0.0%) | 117 (100.0%) |
| Public Administration | 15 (71.4%) | 6 (28.6%) |
| Total | 177 (33.7%) | 348 (66.3%) |
Education in Runge
School Enrollment in Runge
The most common levels of schooling among the 235 students in Runge are elementary school (125 | 53.2%), high school (79 | 33.6%), and middle school (31 | 13.2%).
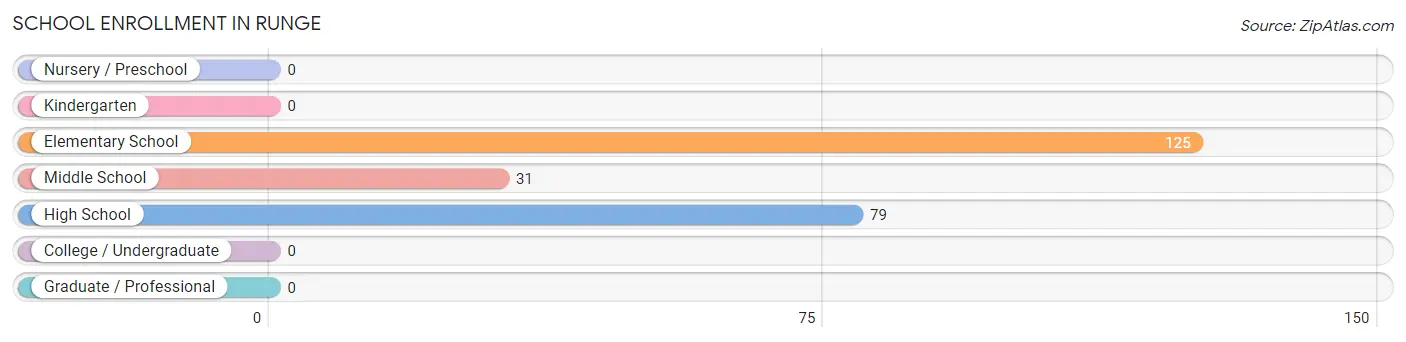
| School Level | # Students | % Students |
| Nursery / Preschool | 0 | 0.0% |
| Kindergarten | 0 | 0.0% |
| Elementary School | 125 | 53.2% |
| Middle School | 31 | 13.2% |
| High School | 79 | 33.6% |
| College / Undergraduate | 0 | 0.0% |
| Graduate / Professional | 0 | 0.0% |
| Total | 235 | 100.0% |
School Enrollment by Age by Funding Source in Runge
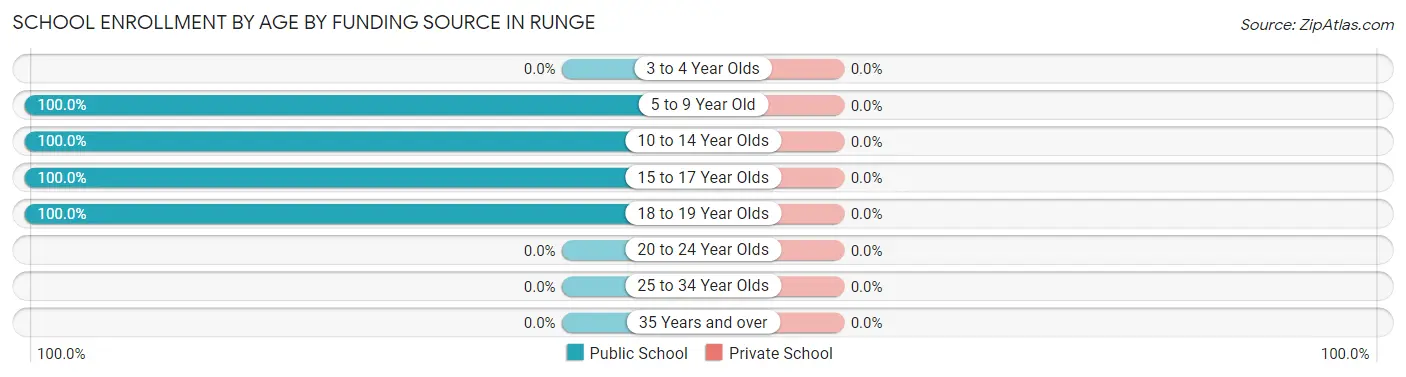
| Age Bracket | Public School | Private School |
| 3 to 4 Year Olds | 0 (0.0%) | 0 (0.0%) |
| 5 to 9 Year Old | 110 (100.0%) | 0 (0.0%) |
| 10 to 14 Year Olds | 46 (100.0%) | 0 (0.0%) |
| 15 to 17 Year Olds | 52 (100.0%) | 0 (0.0%) |
| 18 to 19 Year Olds | 27 (100.0%) | 0 (0.0%) |
| 20 to 24 Year Olds | 0 (0.0%) | 0 (0.0%) |
| 25 to 34 Year Olds | 0 (0.0%) | 0 (0.0%) |
| 35 Years and over | 0 (0.0%) | 0 (0.0%) |
| Total | 235 (100.0%) | 0 (0.0%) |
Educational Attainment by Field of Study in Runge
Business (30 | 46.2%), education (30 | 46.2%), and engineering (5 | 7.7%) are the most common fields of study among 65 individuals in Runge who have obtained a bachelor's degree or higher.
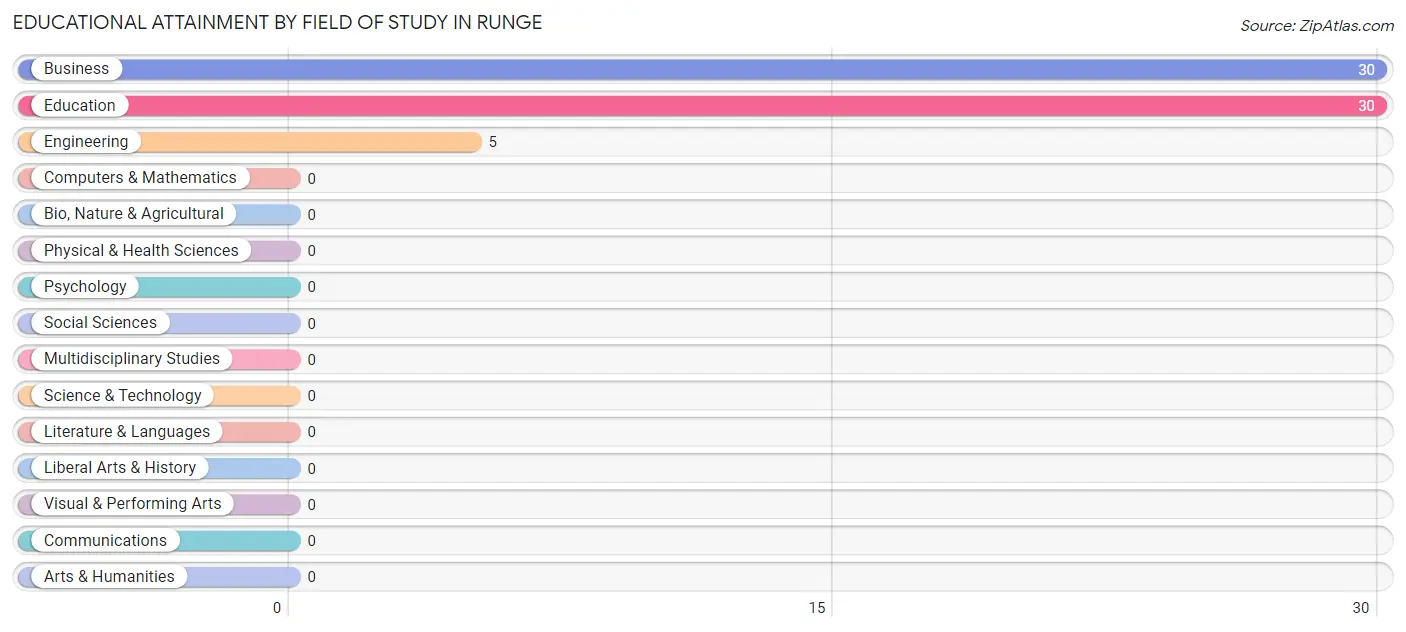
| Field of Study | # Graduates | % Graduates |
| Computers & Mathematics | 0 | 0.0% |
| Bio, Nature & Agricultural | 0 | 0.0% |
| Physical & Health Sciences | 0 | 0.0% |
| Psychology | 0 | 0.0% |
| Social Sciences | 0 | 0.0% |
| Engineering | 5 | 7.7% |
| Multidisciplinary Studies | 0 | 0.0% |
| Science & Technology | 0 | 0.0% |
| Business | 30 | 46.2% |
| Education | 30 | 46.2% |
| Literature & Languages | 0 | 0.0% |
| Liberal Arts & History | 0 | 0.0% |
| Visual & Performing Arts | 0 | 0.0% |
| Communications | 0 | 0.0% |
| Arts & Humanities | 0 | 0.0% |
| Total | 65 | 100.0% |
Transportation & Commute in Runge
Vehicle Availability by Sex in Runge
The most prevalent vehicle ownership categories in Runge are males with 2 vehicles (75, accounting for 42.4%) and females with 2 vehicles (118, making up 21.5%).
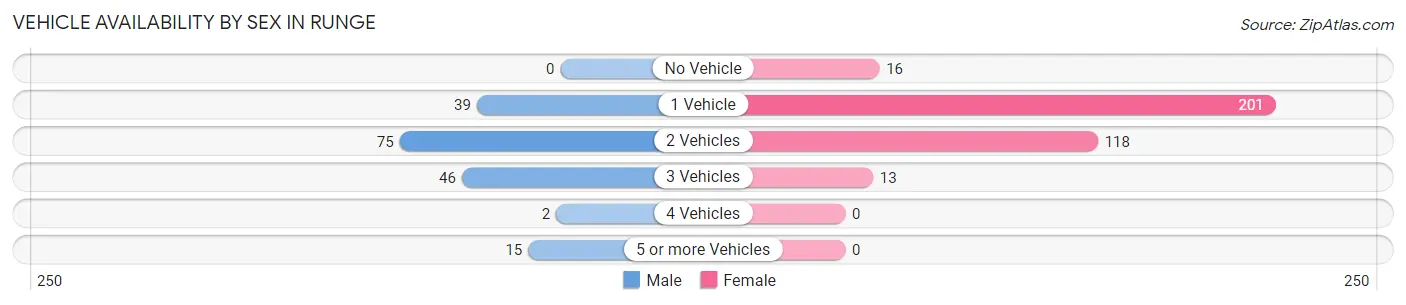
| Vehicles Available | Male | Female |
| No Vehicle | 0 (0.0%) | 16 (4.6%) |
| 1 Vehicle | 39 (22.0%) | 201 (57.8%) |
| 2 Vehicles | 75 (42.4%) | 118 (33.9%) |
| 3 Vehicles | 46 (26.0%) | 13 (3.7%) |
| 4 Vehicles | 2 (1.1%) | 0 (0.0%) |
| 5 or more Vehicles | 15 (8.5%) | 0 (0.0%) |
| Total | 177 (100.0%) | 348 (100.0%) |
Commute Time in Runge
The most frequently occuring commute durations in Runge are 20 to 24 minutes (117 commuters, 23.4%), 30 to 34 minutes (101 commuters, 20.2%), and 10 to 14 minutes (90 commuters, 18.0%).
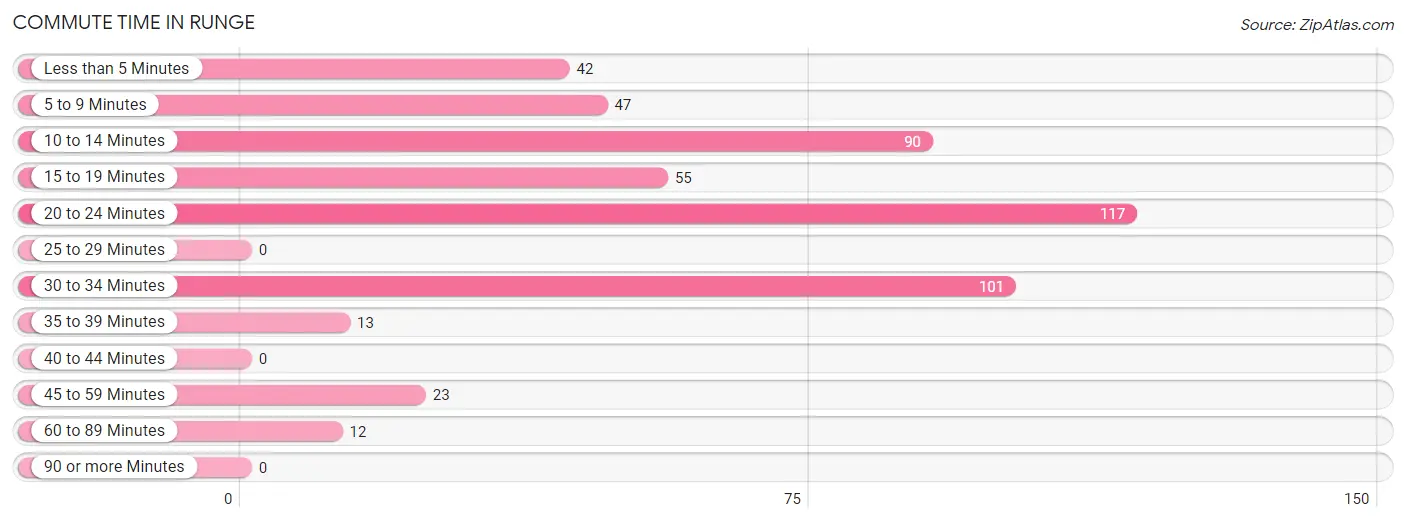
| Commute Time | # Commuters | % Commuters |
| Less than 5 Minutes | 42 | 8.4% |
| 5 to 9 Minutes | 47 | 9.4% |
| 10 to 14 Minutes | 90 | 18.0% |
| 15 to 19 Minutes | 55 | 11.0% |
| 20 to 24 Minutes | 117 | 23.4% |
| 25 to 29 Minutes | 0 | 0.0% |
| 30 to 34 Minutes | 101 | 20.2% |
| 35 to 39 Minutes | 13 | 2.6% |
| 40 to 44 Minutes | 0 | 0.0% |
| 45 to 59 Minutes | 23 | 4.6% |
| 60 to 89 Minutes | 12 | 2.4% |
| 90 or more Minutes | 0 | 0.0% |
Commute Time by Sex in Runge
The most common commute times in Runge are 10 to 14 minutes (77 commuters, 43.5%) for males and 30 to 34 minutes (101 commuters, 31.3%) for females.
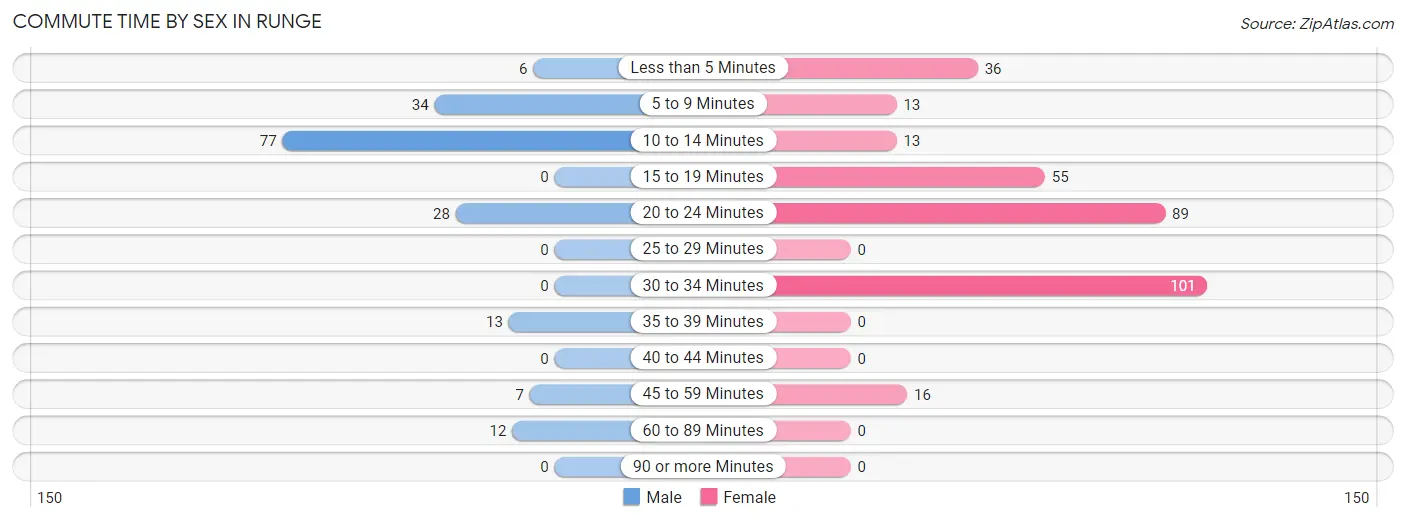
| Commute Time | Male | Female |
| Less than 5 Minutes | 6 (3.4%) | 36 (11.2%) |
| 5 to 9 Minutes | 34 (19.2%) | 13 (4.0%) |
| 10 to 14 Minutes | 77 (43.5%) | 13 (4.0%) |
| 15 to 19 Minutes | 0 (0.0%) | 55 (17.0%) |
| 20 to 24 Minutes | 28 (15.8%) | 89 (27.6%) |
| 25 to 29 Minutes | 0 (0.0%) | 0 (0.0%) |
| 30 to 34 Minutes | 0 (0.0%) | 101 (31.3%) |
| 35 to 39 Minutes | 13 (7.3%) | 0 (0.0%) |
| 40 to 44 Minutes | 0 (0.0%) | 0 (0.0%) |
| 45 to 59 Minutes | 7 (4.0%) | 16 (5.0%) |
| 60 to 89 Minutes | 12 (6.8%) | 0 (0.0%) |
| 90 or more Minutes | 0 (0.0%) | 0 (0.0%) |
Time of Departure to Work by Sex in Runge
The most frequent times of departure to work in Runge are 6:30 AM to 6:59 AM (66, 37.3%) for males and 5:00 AM to 5:29 AM (95, 29.4%) for females.
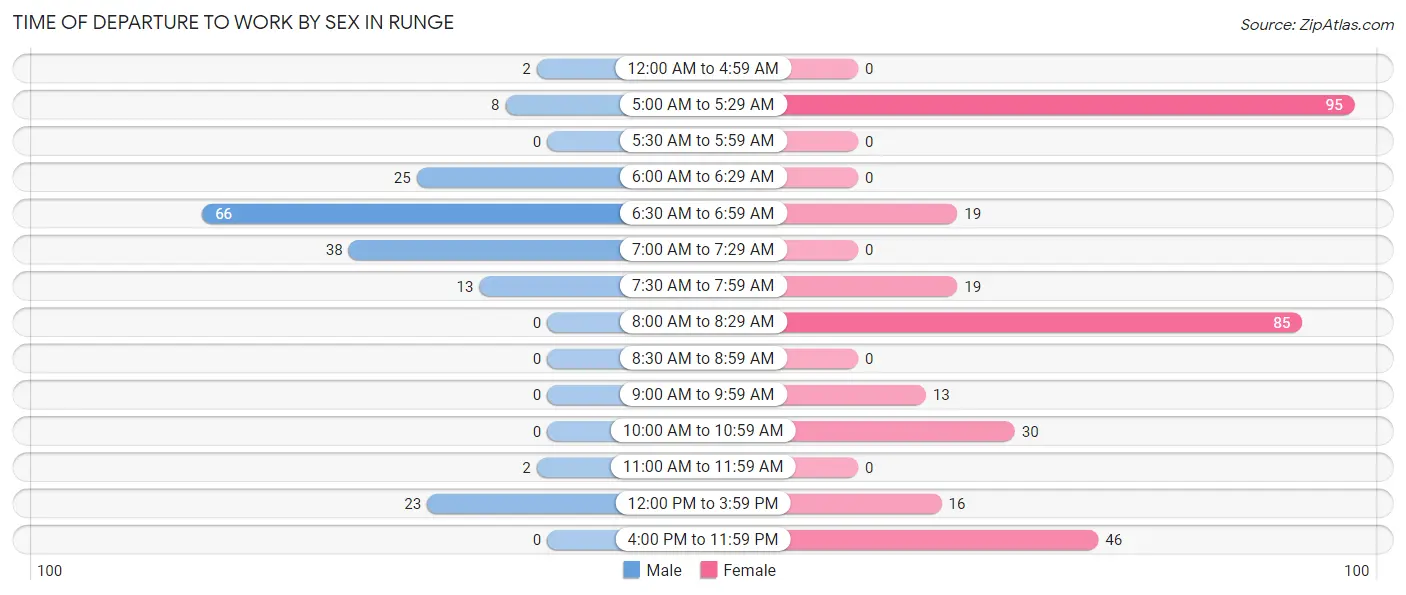
| Time of Departure | Male | Female |
| 12:00 AM to 4:59 AM | 2 (1.1%) | 0 (0.0%) |
| 5:00 AM to 5:29 AM | 8 (4.5%) | 95 (29.4%) |
| 5:30 AM to 5:59 AM | 0 (0.0%) | 0 (0.0%) |
| 6:00 AM to 6:29 AM | 25 (14.1%) | 0 (0.0%) |
| 6:30 AM to 6:59 AM | 66 (37.3%) | 19 (5.9%) |
| 7:00 AM to 7:29 AM | 38 (21.5%) | 0 (0.0%) |
| 7:30 AM to 7:59 AM | 13 (7.3%) | 19 (5.9%) |
| 8:00 AM to 8:29 AM | 0 (0.0%) | 85 (26.3%) |
| 8:30 AM to 8:59 AM | 0 (0.0%) | 0 (0.0%) |
| 9:00 AM to 9:59 AM | 0 (0.0%) | 13 (4.0%) |
| 10:00 AM to 10:59 AM | 0 (0.0%) | 30 (9.3%) |
| 11:00 AM to 11:59 AM | 2 (1.1%) | 0 (0.0%) |
| 12:00 PM to 3:59 PM | 23 (13.0%) | 16 (5.0%) |
| 4:00 PM to 11:59 PM | 0 (0.0%) | 46 (14.2%) |
| Total | 177 (100.0%) | 323 (100.0%) |
Housing Occupancy in Runge
Occupancy by Ownership in Runge
Of the total 546 dwellings in Runge, owner-occupied units account for 238 (43.6%), while renter-occupied units make up 308 (56.4%).
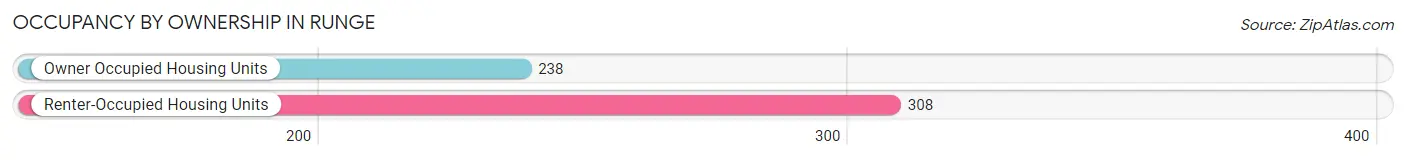
| Occupancy | # Housing Units | % Housing Units |
| Owner Occupied Housing Units | 238 | 43.6% |
| Renter-Occupied Housing Units | 308 | 56.4% |
| Total Occupied Housing Units | 546 | 100.0% |
Occupancy by Household Size in Runge
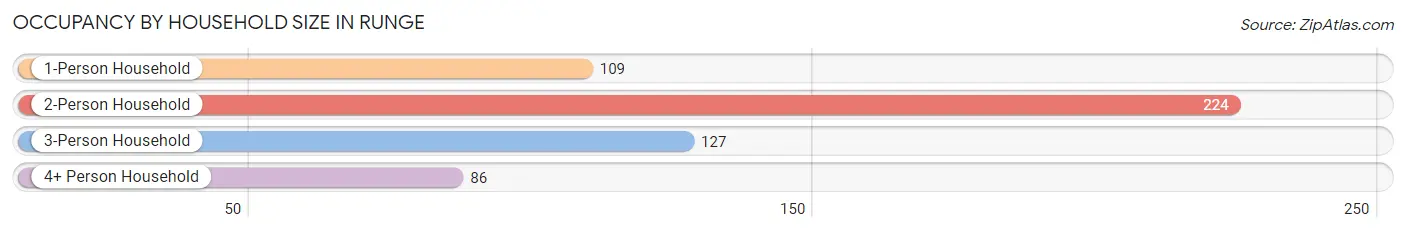
| Household Size | # Housing Units | % Housing Units |
| 1-Person Household | 109 | 20.0% |
| 2-Person Household | 224 | 41.0% |
| 3-Person Household | 127 | 23.3% |
| 4+ Person Household | 86 | 15.8% |
| Total Housing Units | 546 | 100.0% |
Occupancy by Ownership by Household Size in Runge
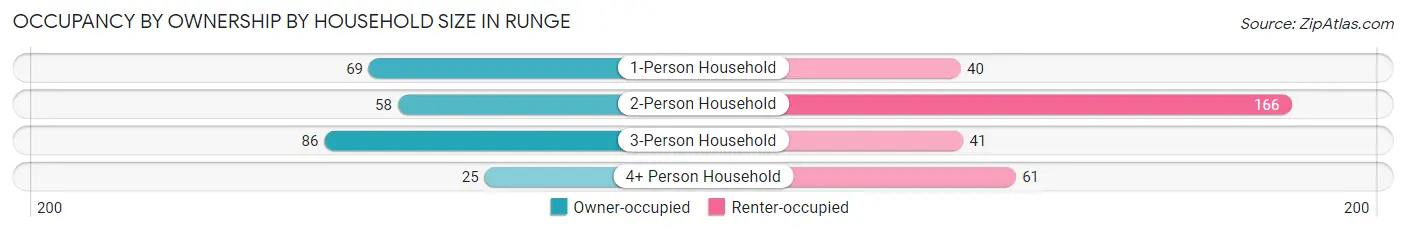
| Household Size | Owner-occupied | Renter-occupied |
| 1-Person Household | 69 (63.3%) | 40 (36.7%) |
| 2-Person Household | 58 (25.9%) | 166 (74.1%) |
| 3-Person Household | 86 (67.7%) | 41 (32.3%) |
| 4+ Person Household | 25 (29.1%) | 61 (70.9%) |
| Total Housing Units | 238 (43.6%) | 308 (56.4%) |
Occupancy by Educational Attainment in Runge
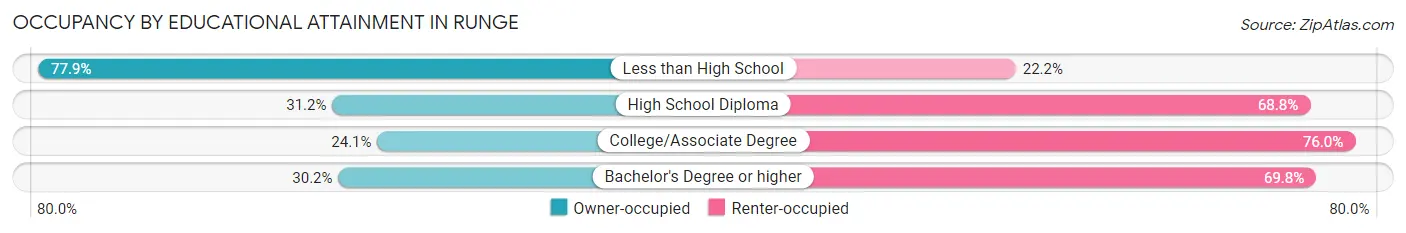
| Household Size | Owner-occupied | Renter-occupied |
| Less than High School | 123 (77.8%) | 35 (22.2%) |
| High School Diploma | 83 (31.2%) | 183 (68.8%) |
| College/Associate Degree | 19 (24.0%) | 60 (75.9%) |
| Bachelor's Degree or higher | 13 (30.2%) | 30 (69.8%) |
Occupancy by Age of Householder in Runge
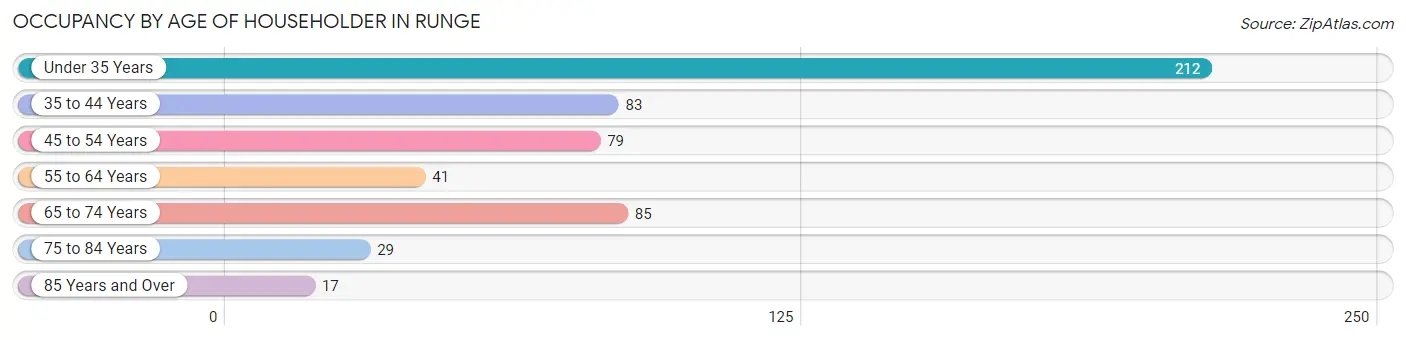
| Age Bracket | # Households | % Households |
| Under 35 Years | 212 | 38.8% |
| 35 to 44 Years | 83 | 15.2% |
| 45 to 54 Years | 79 | 14.5% |
| 55 to 64 Years | 41 | 7.5% |
| 65 to 74 Years | 85 | 15.6% |
| 75 to 84 Years | 29 | 5.3% |
| 85 Years and Over | 17 | 3.1% |
| Total | 546 | 100.0% |
Housing Finances in Runge
Median Income by Occupancy in Runge
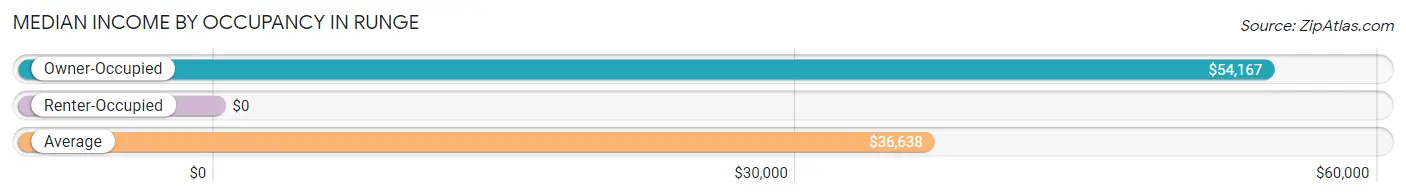
| Occupancy Type | # Households | Median Income |
| Owner-Occupied | 238 (43.6%) | $54,167 |
| Renter-Occupied | 308 (56.4%) | $0 |
| Average | 546 (100.0%) | $36,638 |
Occupancy by Householder Income Bracket in Runge
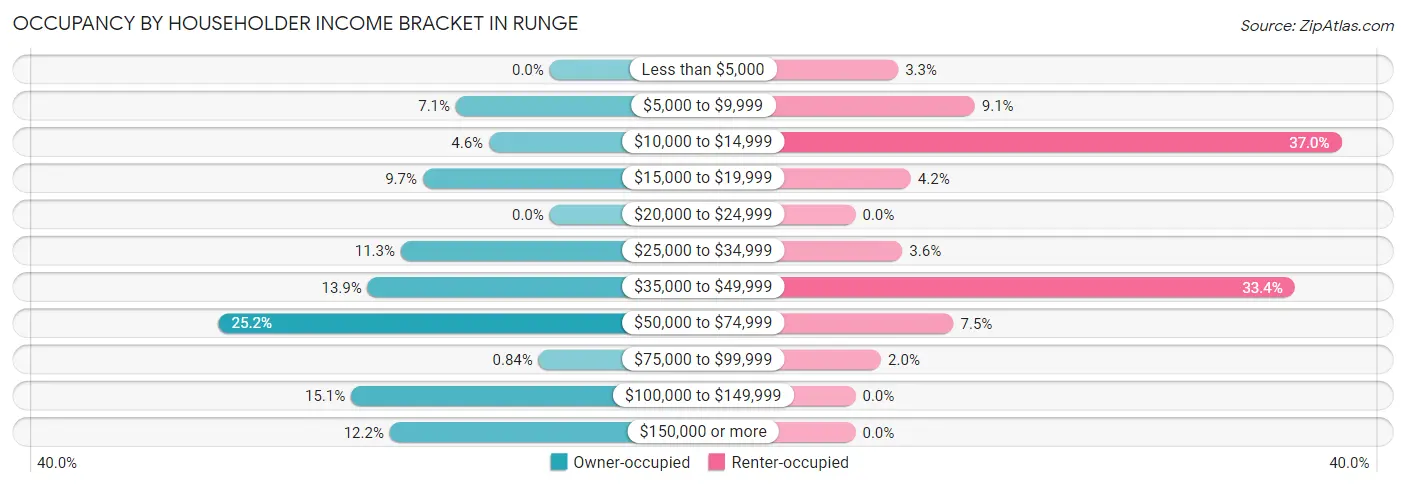
| Income Bracket | Owner-occupied | Renter-occupied |
| Less than $5,000 | 0 (0.0%) | 10 (3.3%) |
| $5,000 to $9,999 | 17 (7.1%) | 28 (9.1%) |
| $10,000 to $14,999 | 11 (4.6%) | 114 (37.0%) |
| $15,000 to $19,999 | 23 (9.7%) | 13 (4.2%) |
| $20,000 to $24,999 | 0 (0.0%) | 0 (0.0%) |
| $25,000 to $34,999 | 27 (11.3%) | 11 (3.6%) |
| $35,000 to $49,999 | 33 (13.9%) | 103 (33.4%) |
| $50,000 to $74,999 | 60 (25.2%) | 23 (7.5%) |
| $75,000 to $99,999 | 2 (0.8%) | 6 (1.9%) |
| $100,000 to $149,999 | 36 (15.1%) | 0 (0.0%) |
| $150,000 or more | 29 (12.2%) | 0 (0.0%) |
| Total | 238 (100.0%) | 308 (100.0%) |
Monthly Housing Cost Tiers in Runge
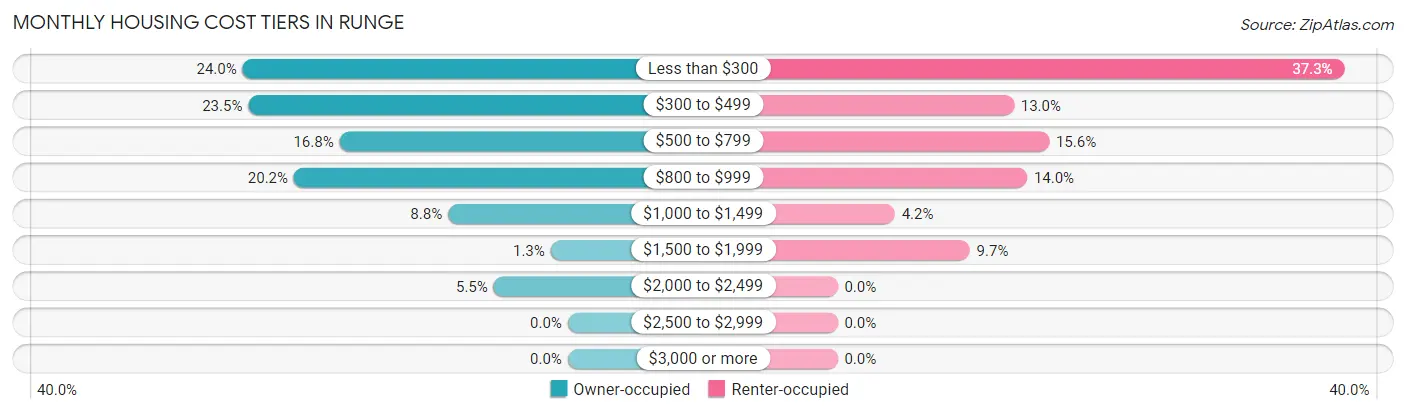
| Monthly Cost | Owner-occupied | Renter-occupied |
| Less than $300 | 57 (23.9%) | 115 (37.3%) |
| $300 to $499 | 56 (23.5%) | 40 (13.0%) |
| $500 to $799 | 40 (16.8%) | 48 (15.6%) |
| $800 to $999 | 48 (20.2%) | 43 (14.0%) |
| $1,000 to $1,499 | 21 (8.8%) | 13 (4.2%) |
| $1,500 to $1,999 | 3 (1.3%) | 30 (9.7%) |
| $2,000 to $2,499 | 13 (5.5%) | 0 (0.0%) |
| $2,500 to $2,999 | 0 (0.0%) | 0 (0.0%) |
| $3,000 or more | 0 (0.0%) | 0 (0.0%) |
| Total | 238 (100.0%) | 308 (100.0%) |
Physical Housing Characteristics in Runge
Housing Structures in Runge
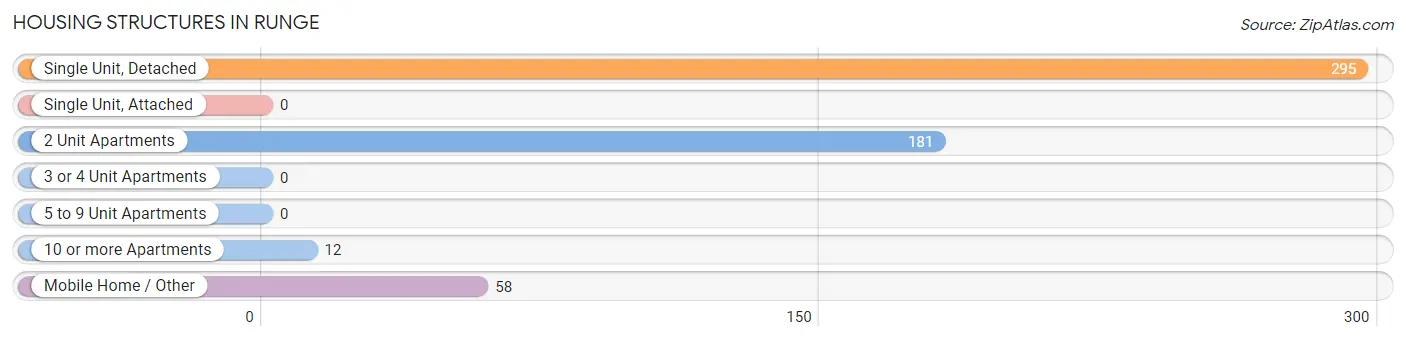
| Structure Type | # Housing Units | % Housing Units |
| Single Unit, Detached | 295 | 54.0% |
| Single Unit, Attached | 0 | 0.0% |
| 2 Unit Apartments | 181 | 33.2% |
| 3 or 4 Unit Apartments | 0 | 0.0% |
| 5 to 9 Unit Apartments | 0 | 0.0% |
| 10 or more Apartments | 12 | 2.2% |
| Mobile Home / Other | 58 | 10.6% |
| Total | 546 | 100.0% |
Housing Structures by Occupancy in Runge
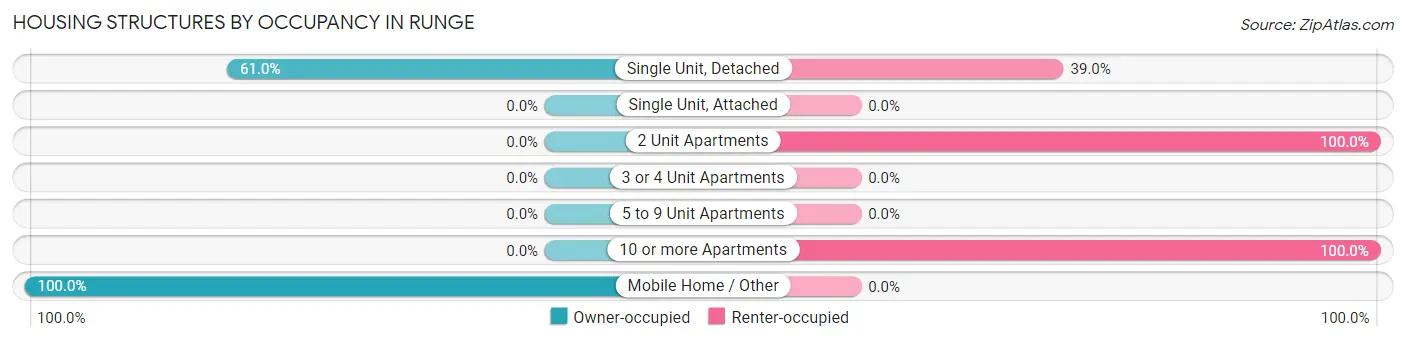
| Structure Type | Owner-occupied | Renter-occupied |
| Single Unit, Detached | 180 (61.0%) | 115 (39.0%) |
| Single Unit, Attached | 0 (0.0%) | 0 (0.0%) |
| 2 Unit Apartments | 0 (0.0%) | 181 (100.0%) |
| 3 or 4 Unit Apartments | 0 (0.0%) | 0 (0.0%) |
| 5 to 9 Unit Apartments | 0 (0.0%) | 0 (0.0%) |
| 10 or more Apartments | 0 (0.0%) | 12 (100.0%) |
| Mobile Home / Other | 58 (100.0%) | 0 (0.0%) |
| Total | 238 (43.6%) | 308 (56.4%) |
Housing Structures by Number of Rooms in Runge
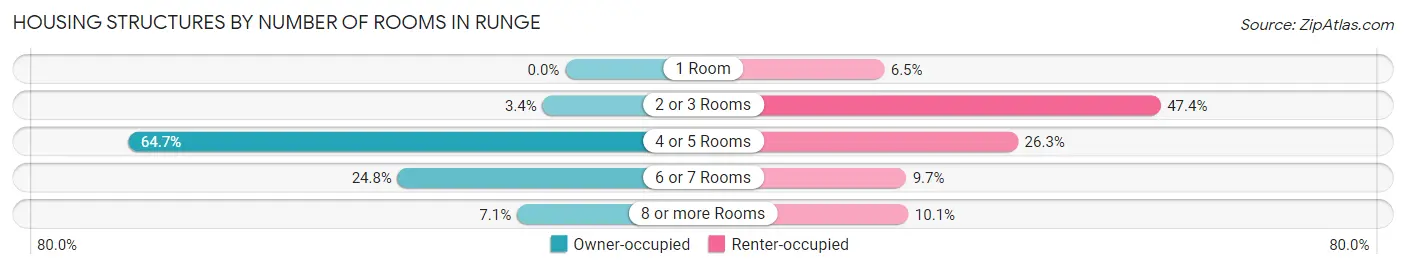
| Number of Rooms | Owner-occupied | Renter-occupied |
| 1 Room | 0 (0.0%) | 20 (6.5%) |
| 2 or 3 Rooms | 8 (3.4%) | 146 (47.4%) |
| 4 or 5 Rooms | 154 (64.7%) | 81 (26.3%) |
| 6 or 7 Rooms | 59 (24.8%) | 30 (9.7%) |
| 8 or more Rooms | 17 (7.1%) | 31 (10.1%) |
| Total | 238 (100.0%) | 308 (100.0%) |
Housing Structure by Heating Type in Runge
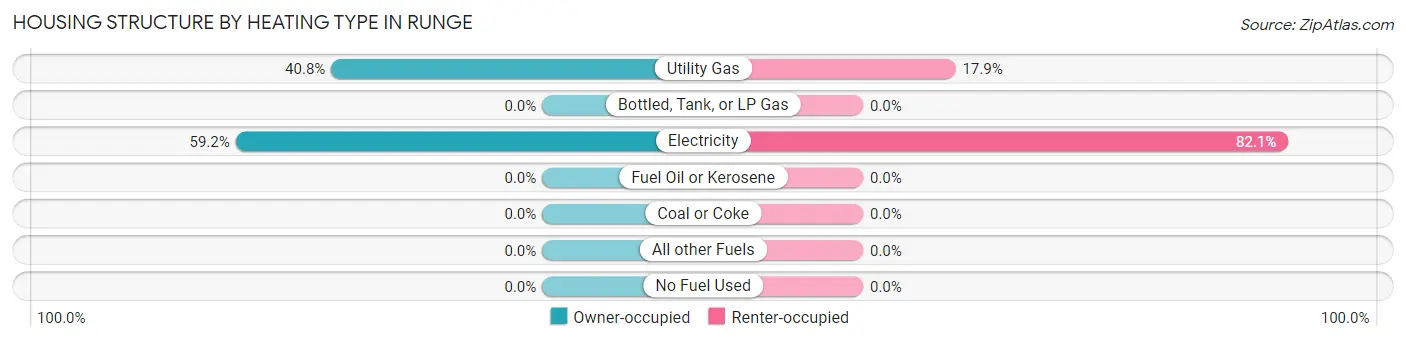
| Heating Type | Owner-occupied | Renter-occupied |
| Utility Gas | 97 (40.8%) | 55 (17.9%) |
| Bottled, Tank, or LP Gas | 0 (0.0%) | 0 (0.0%) |
| Electricity | 141 (59.2%) | 253 (82.1%) |
| Fuel Oil or Kerosene | 0 (0.0%) | 0 (0.0%) |
| Coal or Coke | 0 (0.0%) | 0 (0.0%) |
| All other Fuels | 0 (0.0%) | 0 (0.0%) |
| No Fuel Used | 0 (0.0%) | 0 (0.0%) |
| Total | 238 (100.0%) | 308 (100.0%) |
Household Vehicle Usage in Runge
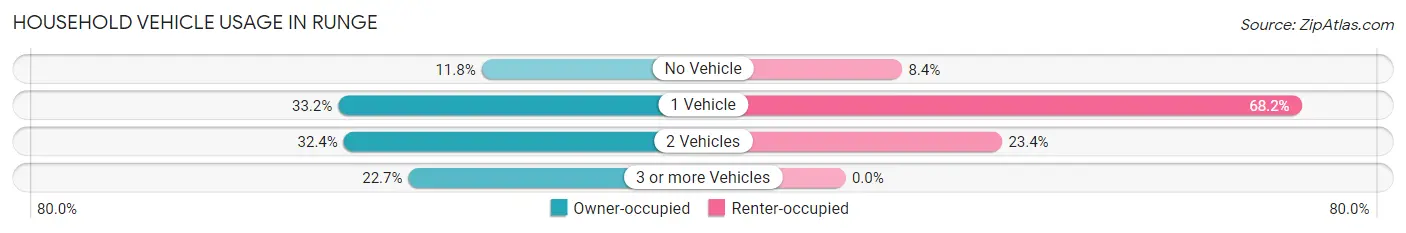
| Vehicles per Household | Owner-occupied | Renter-occupied |
| No Vehicle | 28 (11.8%) | 26 (8.4%) |
| 1 Vehicle | 79 (33.2%) | 210 (68.2%) |
| 2 Vehicles | 77 (32.4%) | 72 (23.4%) |
| 3 or more Vehicles | 54 (22.7%) | 0 (0.0%) |
| Total | 238 (100.0%) | 308 (100.0%) |
Real Estate & Mortgages in Runge
Real Estate and Mortgage Overview in Runge
| Characteristic | Without Mortgage | With Mortgage |
| Housing Units | 162 | 76 |
| Median Property Value | $58,400 | $105,600 |
| Median Household Income | $35,395 | $24 |
| Monthly Housing Costs | $388 | $0 |
| Real Estate Taxes | $268 | $0 |
Property Value by Mortgage Status in Runge
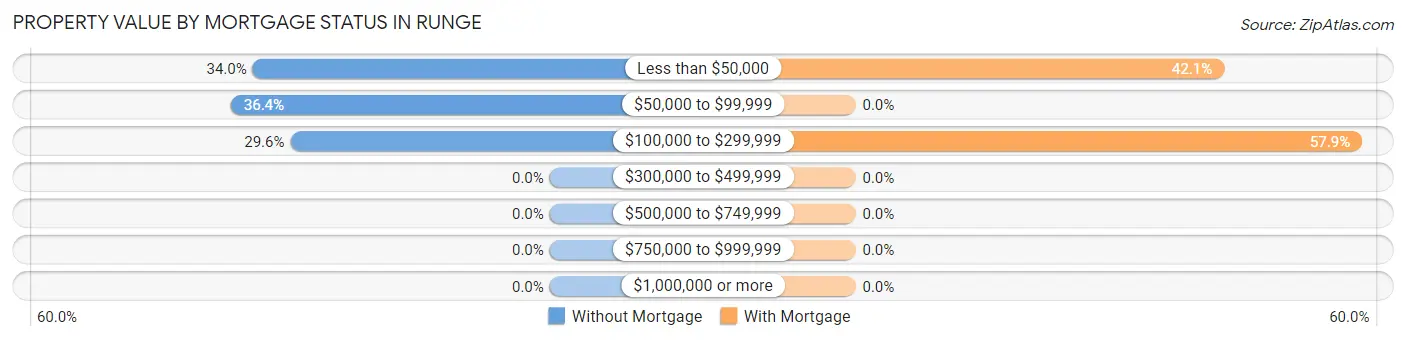
| Property Value | Without Mortgage | With Mortgage |
| Less than $50,000 | 55 (34.0%) | 32 (42.1%) |
| $50,000 to $99,999 | 59 (36.4%) | 0 (0.0%) |
| $100,000 to $299,999 | 48 (29.6%) | 44 (57.9%) |
| $300,000 to $499,999 | 0 (0.0%) | 0 (0.0%) |
| $500,000 to $749,999 | 0 (0.0%) | 0 (0.0%) |
| $750,000 to $999,999 | 0 (0.0%) | 0 (0.0%) |
| $1,000,000 or more | 0 (0.0%) | 0 (0.0%) |
| Total | 162 (100.0%) | 76 (100.0%) |
Household Income by Mortgage Status in Runge
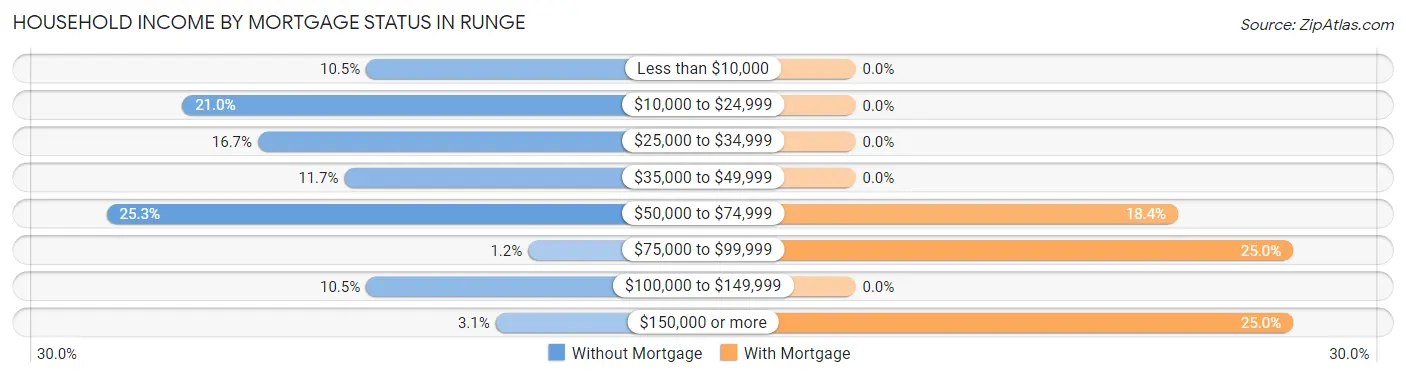
| Household Income | Without Mortgage | With Mortgage |
| Less than $10,000 | 17 (10.5%) | 0 (0.0%) |
| $10,000 to $24,999 | 34 (21.0%) | 0 (0.0%) |
| $25,000 to $34,999 | 27 (16.7%) | 0 (0.0%) |
| $35,000 to $49,999 | 19 (11.7%) | 0 (0.0%) |
| $50,000 to $74,999 | 41 (25.3%) | 14 (18.4%) |
| $75,000 to $99,999 | 2 (1.2%) | 19 (25.0%) |
| $100,000 to $149,999 | 17 (10.5%) | 0 (0.0%) |
| $150,000 or more | 5 (3.1%) | 19 (25.0%) |
| Total | 162 (100.0%) | 76 (100.0%) |
Property Value to Household Income Ratio in Runge
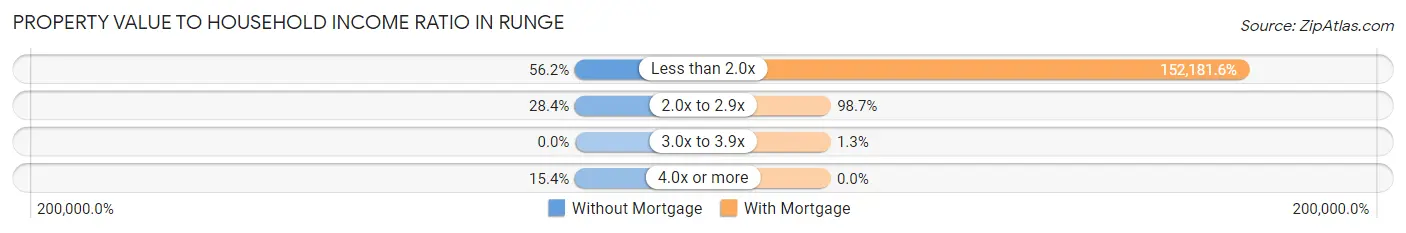
| Value-to-Income Ratio | Without Mortgage | With Mortgage |
| Less than 2.0x | 91 (56.2%) | 115,658 (152,181.6%) |
| 2.0x to 2.9x | 46 (28.4%) | 75 (98.7%) |
| 3.0x to 3.9x | 0 (0.0%) | 1 (1.3%) |
| 4.0x or more | 25 (15.4%) | 0 (0.0%) |
| Total | 162 (100.0%) | 76 (100.0%) |
Real Estate Taxes by Mortgage Status in Runge
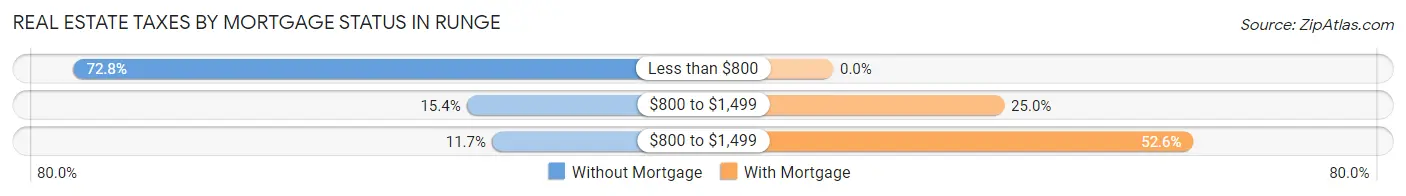
| Property Taxes | Without Mortgage | With Mortgage |
| Less than $800 | 118 (72.8%) | 0 (0.0%) |
| $800 to $1,499 | 25 (15.4%) | 19 (25.0%) |
| $800 to $1,499 | 19 (11.7%) | 40 (52.6%) |
| Total | 162 (100.0%) | 76 (100.0%) |
Health & Disability in Runge
Health Insurance Coverage by Age in Runge
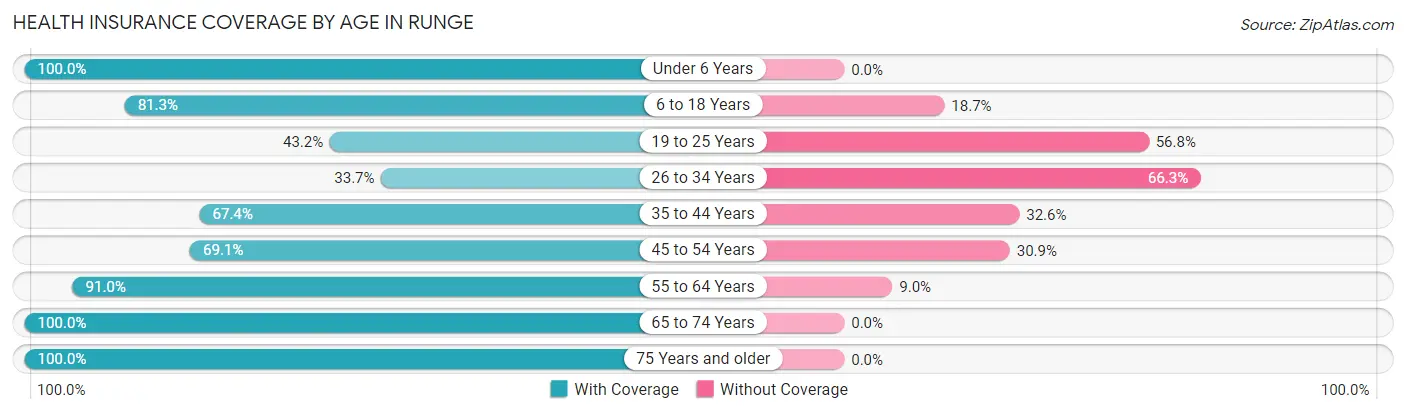
| Age Bracket | With Coverage | Without Coverage |
| Under 6 Years | 155 (100.0%) | 0 (0.0%) |
| 6 to 18 Years | 196 (81.3%) | 45 (18.7%) |
| 19 to 25 Years | 99 (43.2%) | 130 (56.8%) |
| 26 to 34 Years | 34 (33.7%) | 67 (66.3%) |
| 35 to 44 Years | 64 (67.4%) | 31 (32.6%) |
| 45 to 54 Years | 103 (69.1%) | 46 (30.9%) |
| 55 to 64 Years | 61 (91.0%) | 6 (9.0%) |
| 65 to 74 Years | 105 (100.0%) | 0 (0.0%) |
| 75 Years and older | 59 (100.0%) | 0 (0.0%) |
| Total | 876 (72.9%) | 325 (27.1%) |
Health Insurance Coverage by Citizenship Status in Runge
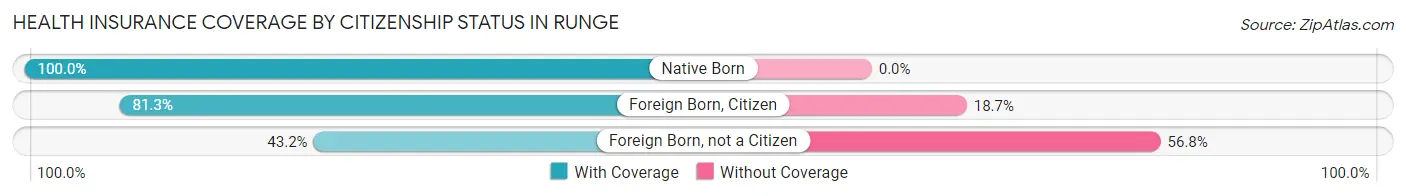
| Citizenship Status | With Coverage | Without Coverage |
| Native Born | 155 (100.0%) | 0 (0.0%) |
| Foreign Born, Citizen | 196 (81.3%) | 45 (18.7%) |
| Foreign Born, not a Citizen | 99 (43.2%) | 130 (56.8%) |
Health Insurance Coverage by Household Income in Runge
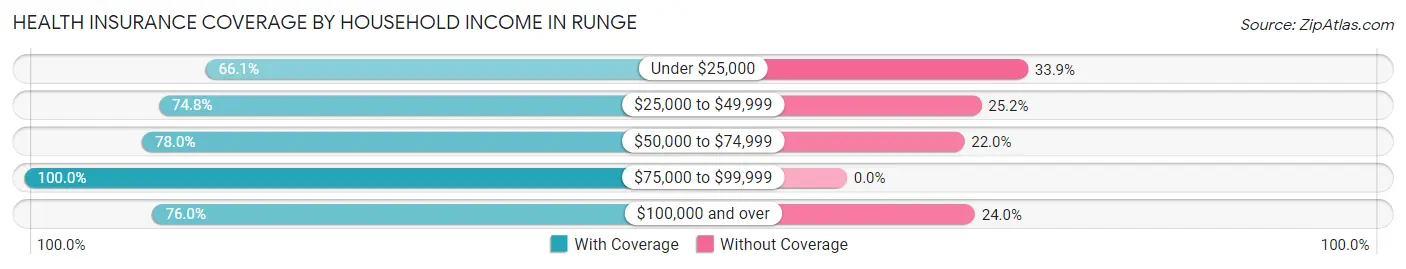
| Household Income | With Coverage | Without Coverage |
| Under $25,000 | 265 (66.1%) | 136 (33.9%) |
| $25,000 to $49,999 | 285 (74.8%) | 96 (25.2%) |
| $50,000 to $74,999 | 163 (78.0%) | 46 (22.0%) |
| $75,000 to $99,999 | 14 (100.0%) | 0 (0.0%) |
| $100,000 and over | 149 (76.0%) | 47 (24.0%) |
Public vs Private Health Insurance Coverage by Age in Runge
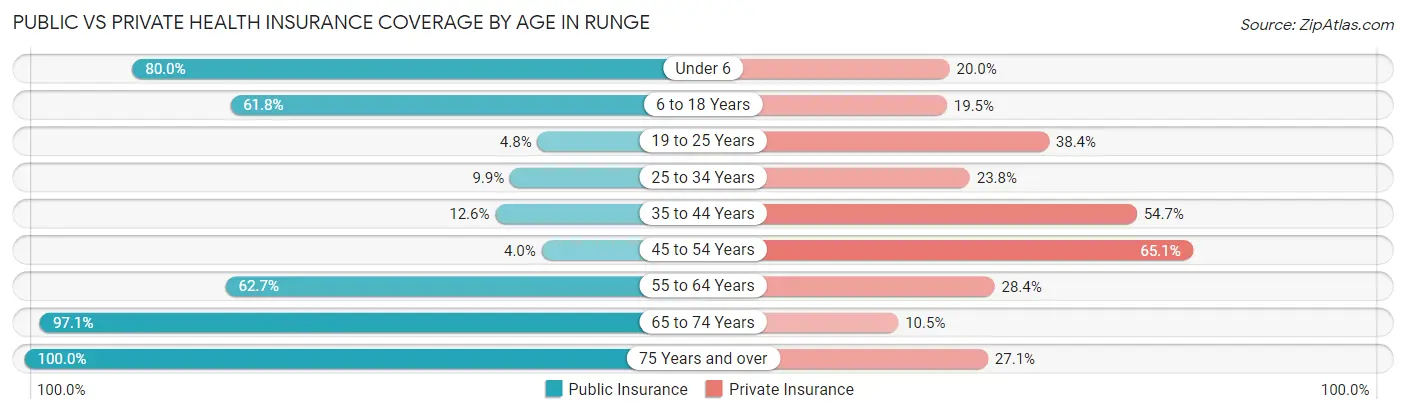
| Age Bracket | Public Insurance | Private Insurance |
| Under 6 | 124 (80.0%) | 31 (20.0%) |
| 6 to 18 Years | 149 (61.8%) | 47 (19.5%) |
| 19 to 25 Years | 11 (4.8%) | 88 (38.4%) |
| 25 to 34 Years | 10 (9.9%) | 24 (23.8%) |
| 35 to 44 Years | 12 (12.6%) | 52 (54.7%) |
| 45 to 54 Years | 6 (4.0%) | 97 (65.1%) |
| 55 to 64 Years | 42 (62.7%) | 19 (28.4%) |
| 65 to 74 Years | 102 (97.1%) | 11 (10.5%) |
| 75 Years and over | 59 (100.0%) | 16 (27.1%) |
| Total | 515 (42.9%) | 385 (32.1%) |
Disability Status by Sex by Age in Runge
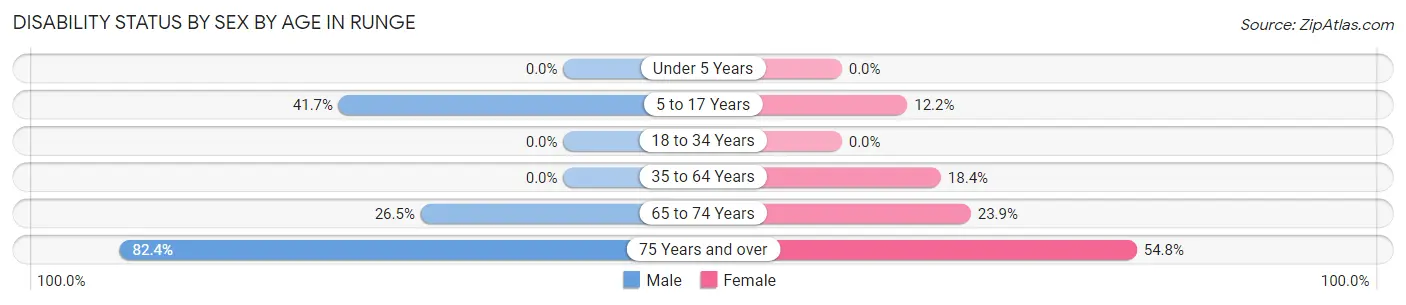
| Age Bracket | Male | Female |
| Under 5 Years | 0 (0.0%) | 0 (0.0%) |
| 5 to 17 Years | 25 (41.7%) | 18 (12.2%) |
| 18 to 34 Years | 0 (0.0%) | 0 (0.0%) |
| 35 to 64 Years | 0 (0.0%) | 39 (18.4%) |
| 65 to 74 Years | 9 (26.5%) | 17 (23.9%) |
| 75 Years and over | 14 (82.4%) | 23 (54.8%) |
Disability Class by Sex by Age in Runge
Disability Class: Hearing Difficulty
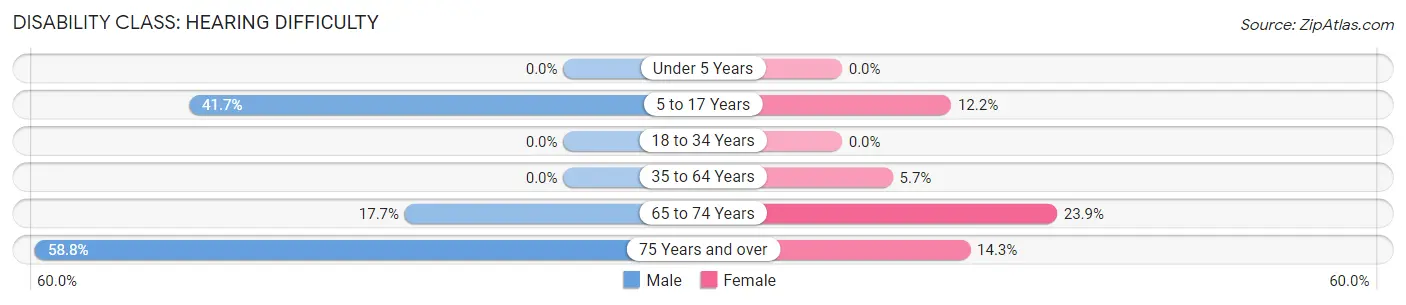
| Age Bracket | Male | Female |
| Under 5 Years | 0 (0.0%) | 0 (0.0%) |
| 5 to 17 Years | 25 (41.7%) | 18 (12.2%) |
| 18 to 34 Years | 0 (0.0%) | 0 (0.0%) |
| 35 to 64 Years | 0 (0.0%) | 12 (5.7%) |
| 65 to 74 Years | 6 (17.6%) | 17 (23.9%) |
| 75 Years and over | 10 (58.8%) | 6 (14.3%) |
Disability Class: Vision Difficulty
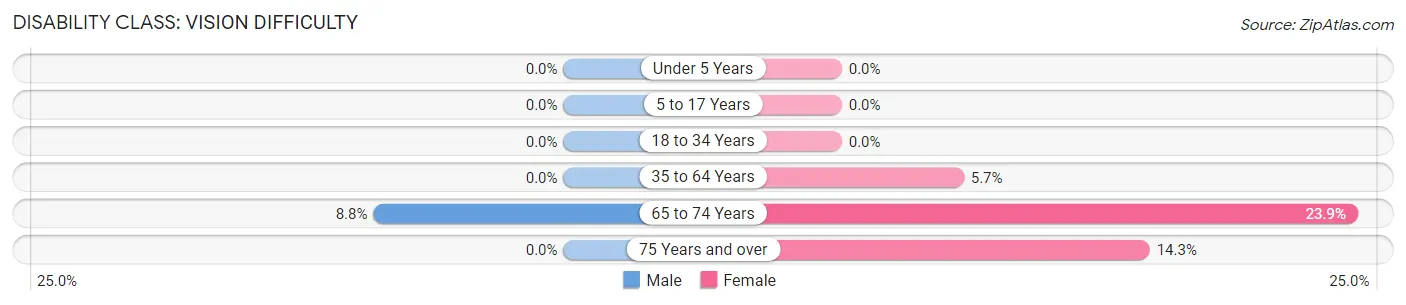
| Age Bracket | Male | Female |
| Under 5 Years | 0 (0.0%) | 0 (0.0%) |
| 5 to 17 Years | 0 (0.0%) | 0 (0.0%) |
| 18 to 34 Years | 0 (0.0%) | 0 (0.0%) |
| 35 to 64 Years | 0 (0.0%) | 12 (5.7%) |
| 65 to 74 Years | 3 (8.8%) | 17 (23.9%) |
| 75 Years and over | 0 (0.0%) | 6 (14.3%) |
Disability Class: Cognitive Difficulty
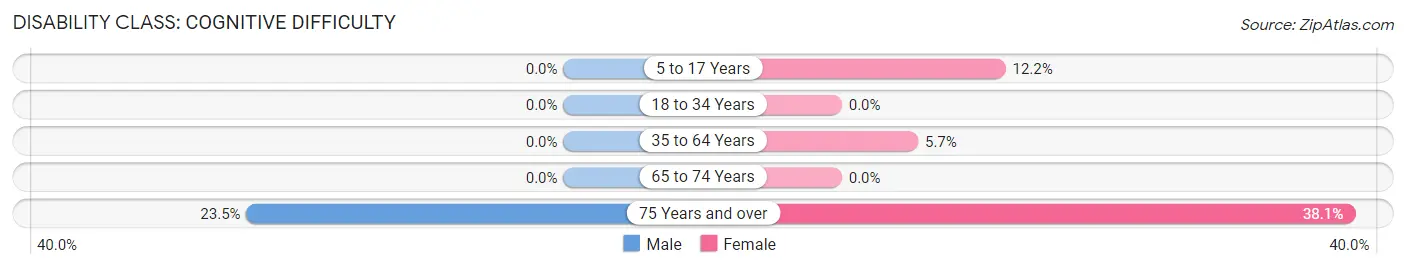
| Age Bracket | Male | Female |
| 5 to 17 Years | 0 (0.0%) | 18 (12.2%) |
| 18 to 34 Years | 0 (0.0%) | 0 (0.0%) |
| 35 to 64 Years | 0 (0.0%) | 12 (5.7%) |
| 65 to 74 Years | 0 (0.0%) | 0 (0.0%) |
| 75 Years and over | 4 (23.5%) | 16 (38.1%) |
Disability Class: Ambulatory Difficulty
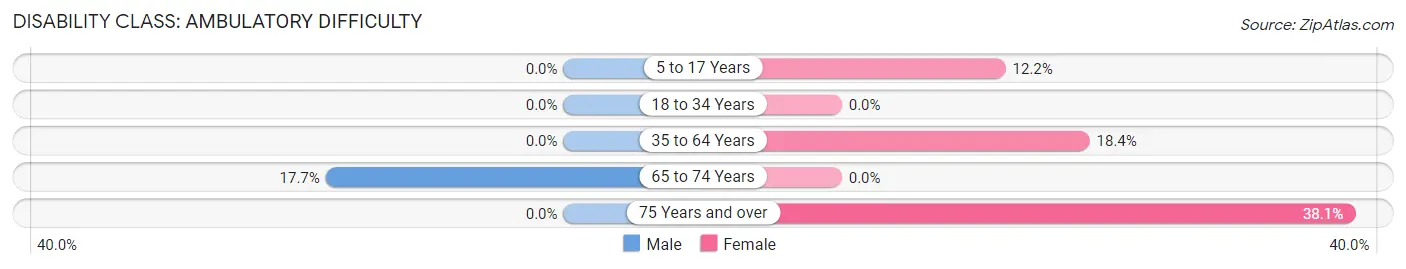
| Age Bracket | Male | Female |
| 5 to 17 Years | 0 (0.0%) | 18 (12.2%) |
| 18 to 34 Years | 0 (0.0%) | 0 (0.0%) |
| 35 to 64 Years | 0 (0.0%) | 39 (18.4%) |
| 65 to 74 Years | 6 (17.6%) | 0 (0.0%) |
| 75 Years and over | 0 (0.0%) | 16 (38.1%) |
Disability Class: Self-Care Difficulty
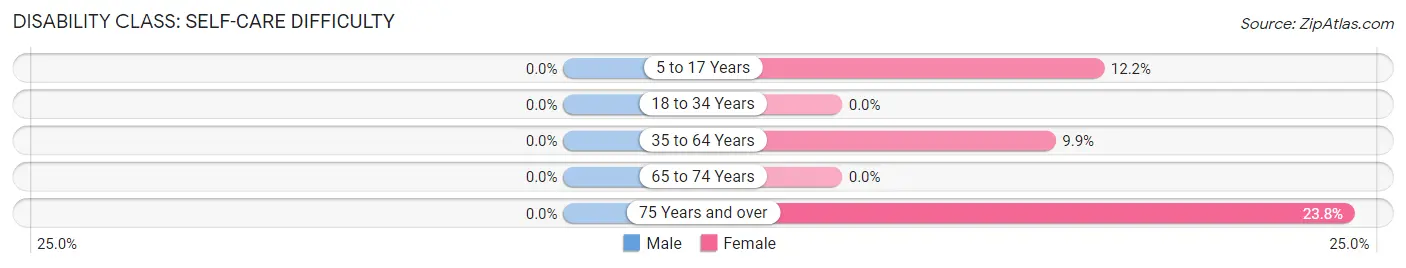
| Age Bracket | Male | Female |
| 5 to 17 Years | 0 (0.0%) | 18 (12.2%) |
| 18 to 34 Years | 0 (0.0%) | 0 (0.0%) |
| 35 to 64 Years | 0 (0.0%) | 21 (9.9%) |
| 65 to 74 Years | 0 (0.0%) | 0 (0.0%) |
| 75 Years and over | 0 (0.0%) | 10 (23.8%) |
Technology Access in Runge
Computing Device Access in Runge
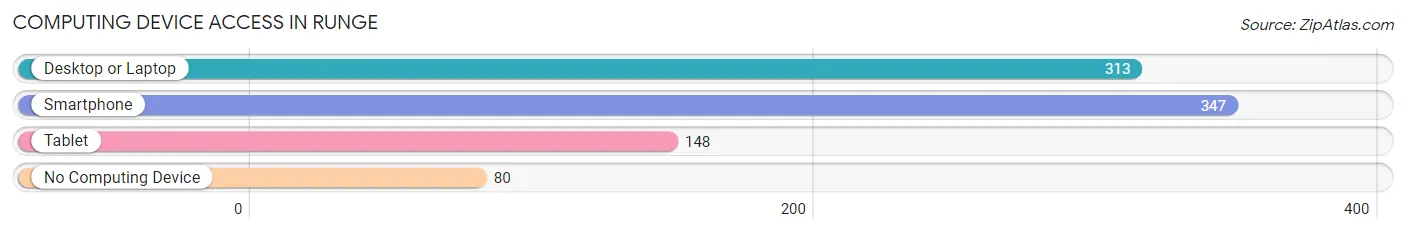
| Device Type | # Households | % Households |
| Desktop or Laptop | 313 | 57.3% |
| Smartphone | 347 | 63.5% |
| Tablet | 148 | 27.1% |
| No Computing Device | 80 | 14.6% |
| Total | 546 | 100.0% |
Internet Access in Runge
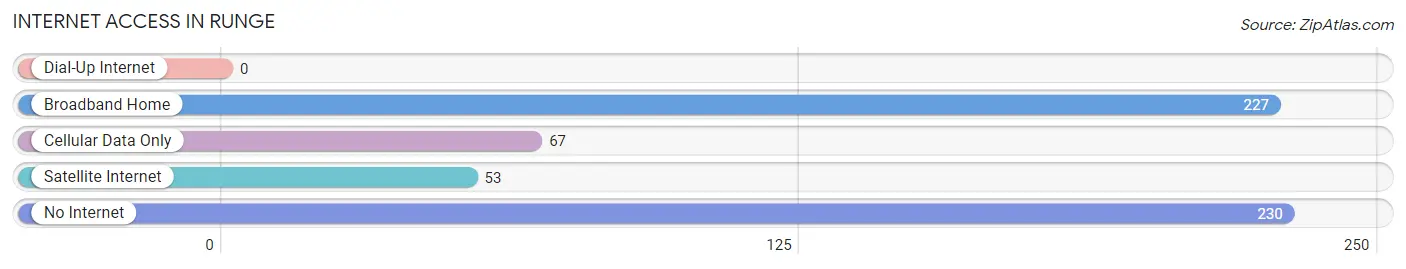
| Internet Type | # Households | % Households |
| Dial-Up Internet | 0 | 0.0% |
| Broadband Home | 227 | 41.6% |
| Cellular Data Only | 67 | 12.3% |
| Satellite Internet | 53 | 9.7% |
| No Internet | 230 | 42.1% |
| Total | 546 | 100.0% |
Runge Summary
Runge is a small town located in Karnes County, Texas, United States. It is situated about 50 miles southeast of San Antonio and about 30 miles northwest of Corpus Christi. The population of Runge was 1,092 at the 2010 census.
History
Runge was founded in 1894 by German immigrants who had settled in the area. The town was named after a local rancher, John Runge, who had donated the land for the town. The first post office was established in 1895.
In the early 1900s, Runge was a thriving agricultural community. Cotton, corn, and sorghum were the main crops grown in the area. The town also had a number of businesses, including a bank, a hotel, a general store, and a blacksmith shop.
In the 1920s, the town began to decline as the Great Depression hit the area. Many of the businesses closed and the population began to dwindle.
In the 1940s, the town began to experience a resurgence as the economy began to improve. The population began to grow again and new businesses opened.
Geography
Runge is located at 28°45'25" North, 97°51'45" West (28.756944, -97.862500). The town is situated in the rolling hills of South Texas, about 50 miles southeast of San Antonio and about 30 miles northwest of Corpus Christi.
The climate in Runge is hot and humid in the summer and mild in the winter. The average temperature in July is 92°F and the average temperature in January is 57°F.
Economy
The economy of Runge is largely based on agriculture. Cotton, corn, and sorghum are the main crops grown in the area. The town also has a number of businesses, including a bank, a hotel, a general store, and a blacksmith shop.
Demographics
As of the 2010 census, the population of Runge was 1,092. The racial makeup of the town was 79.2% White, 0.7% African American, 0.2% Native American, 0.2% Asian, 0.1% Pacific Islander, 17.7% from other races, and 2.0% from two or more races. Hispanic or Latino of any race were 37.2% of the population.
The median income for a household in Runge was $30,938 and the median income for a family was $35,625. The per capita income for the town was $14,945. About 20.2% of families and 24.2% of the population were below the poverty line, including 33.3% of those under age 18 and 16.7% of those age 65 or over.
Common Questions
What is Per Capita Income in Runge?
Per Capita income in Runge is $19,284.
What is the Median Family Income in Runge?
Median Family Income in Runge is $37,575.
What is the Median Household income in Runge?
Median Household Income in Runge is $36,638.
What is Income or Wage Gap in Runge?
Income or Wage Gap in Runge is 62.1%.
Women in Runge earn 37.9 cents for every dollar earned by a man.
What is Inequality or Gini Index in Runge?
Inequality or Gini Index in Runge is 0.49.
What is the Total Population of Runge?
Total Population of Runge is 1,201.
What is the Total Male Population of Runge?
Total Male Population of Runge is 396.
What is the Total Female Population of Runge?
Total Female Population of Runge is 805.
What is the Ratio of Males per 100 Females in Runge?
There are 49.19 Males per 100 Females in Runge.
What is the Ratio of Females per 100 Males in Runge?
There are 203.28 Females per 100 Males in Runge.
What is the Median Population Age in Runge?
Median Population Age in Runge is 25.6 Years.
What is the Average Family Size in Runge
Average Family Size in Runge is 2.4 People.
What is the Average Household Size in Runge
Average Household Size in Runge is 2.2 People.
How Large is the Labor Force in Runge?
There are 531 People in the Labor Forcein in Runge.
What is the Percentage of People in the Labor Force in Runge?
60.3% of People are in the Labor Force in Runge.
What is the Unemployment Rate in Runge?
Unemployment Rate in Runge is 1.1%.