Kenedy, TX Map & Demographics
Kenedy Map
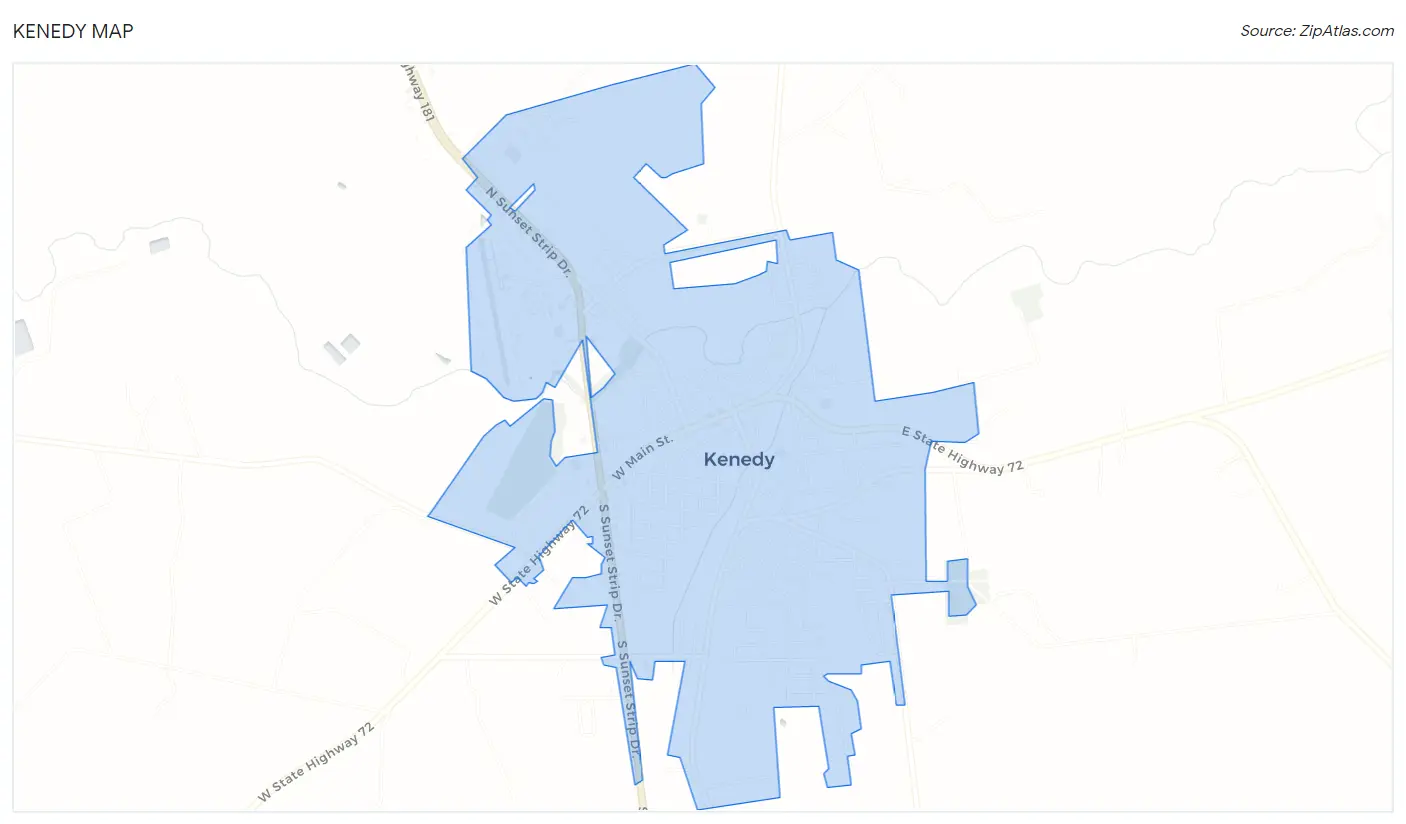
Kenedy Overview
$22,374
PER CAPITA INCOME
$77,625
AVG FAMILY INCOME
13.0%
WAGE / INCOME GAP [ % ]
87.0¢/ $1
WAGE / INCOME GAP [ $ ]
$26,864
FAMILY INCOME DEFICIT
0.47
INEQUALITY / GINI INDEX
3,467
TOTAL POPULATION
1,570
MALE POPULATION
1,897
FEMALE POPULATION
82.76
MALES / 100 FEMALES
120.83
FEMALES / 100 MALES
32.6
MEDIAN AGE
3.4
AVG FAMILY SIZE
2.9
AVG HOUSEHOLD SIZE
1,603
LABOR FORCE [ PEOPLE ]
68.1%
PERCENT IN LABOR FORCE
9.2%
UNEMPLOYMENT RATE
Kenedy Zip Codes
Income in Kenedy
Income Overview in Kenedy
| Characteristic | Number | Measure |
| Per Capita Income | 3,467 | $22,374 |
| Median Family Income | 773 | $77,625 |
| Mean Family Income | 773 | $68,654 |
| Median Household Income | 1,156 | $0 |
| Mean Household Income | 1,156 | $62,208 |
| Income Deficit | 773 | $26,864 |
| Wage / Income Gap (%) | 3,467 | 12.96% |
| Wage / Income Gap ($) | 3,467 | 87.04¢ per $1 |
| Gini / Inequality Index | 3,467 | 0.47 |
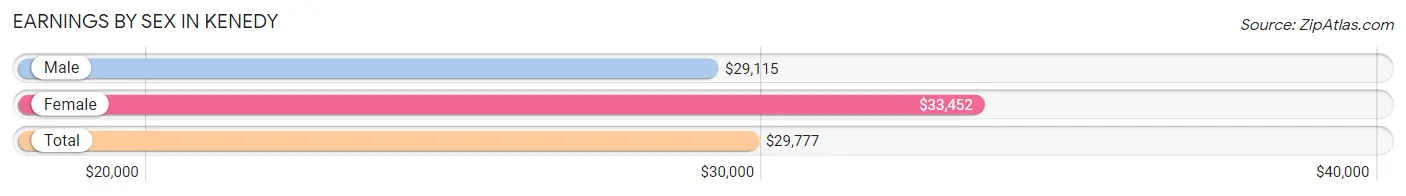
Earnings by Sex in Kenedy
Average Earnings in Kenedy are $29,777, $29,115 for men and $33,452 for women, a difference of 13.0%.
| Sex | Number | Average Earnings |
| Male | 829 (51.0%) | $29,115 |
| Female | 797 (49.0%) | $33,452 |
| Total | 1,626 (100.0%) | $29,777 |
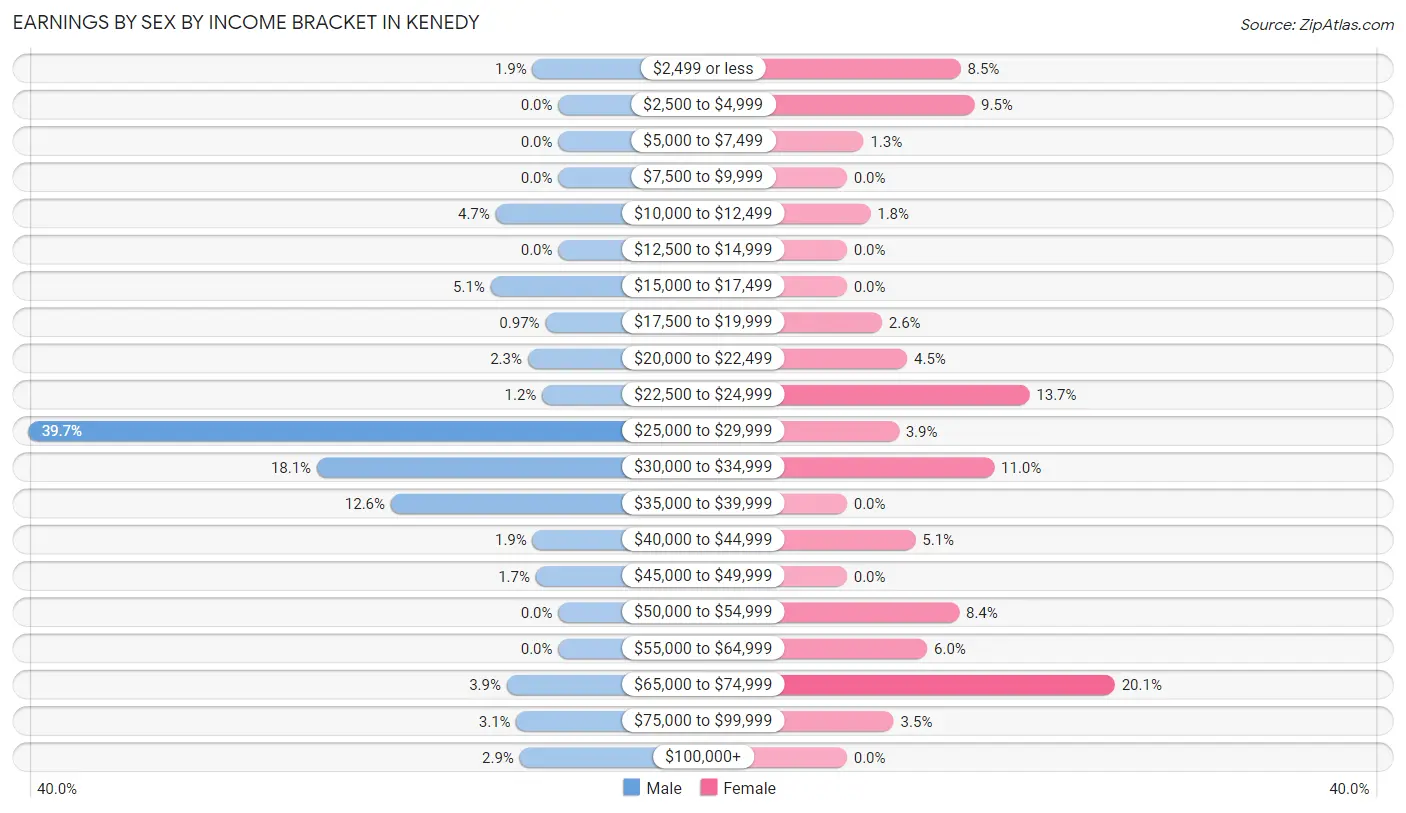
Earnings by Sex by Income Bracket in Kenedy
The most common earnings brackets in Kenedy are $25,000 to $29,999 for men (329 | 39.7%) and $65,000 to $74,999 for women (160 | 20.1%).
| Income | Male | Female |
| $2,499 or less | 16 (1.9%) | 68 (8.5%) |
| $2,500 to $4,999 | 0 (0.0%) | 76 (9.5%) |
| $5,000 to $7,499 | 0 (0.0%) | 10 (1.3%) |
| $7,500 to $9,999 | 0 (0.0%) | 0 (0.0%) |
| $10,000 to $12,499 | 39 (4.7%) | 14 (1.8%) |
| $12,500 to $14,999 | 0 (0.0%) | 0 (0.0%) |
| $15,000 to $17,499 | 42 (5.1%) | 0 (0.0%) |
| $17,500 to $19,999 | 8 (1.0%) | 21 (2.6%) |
| $20,000 to $22,499 | 19 (2.3%) | 36 (4.5%) |
| $22,500 to $24,999 | 10 (1.2%) | 109 (13.7%) |
| $25,000 to $29,999 | 329 (39.7%) | 31 (3.9%) |
| $30,000 to $34,999 | 150 (18.1%) | 88 (11.0%) |
| $35,000 to $39,999 | 104 (12.6%) | 0 (0.0%) |
| $40,000 to $44,999 | 16 (1.9%) | 41 (5.1%) |
| $45,000 to $49,999 | 14 (1.7%) | 0 (0.0%) |
| $50,000 to $54,999 | 0 (0.0%) | 67 (8.4%) |
| $55,000 to $64,999 | 0 (0.0%) | 48 (6.0%) |
| $65,000 to $74,999 | 32 (3.9%) | 160 (20.1%) |
| $75,000 to $99,999 | 26 (3.1%) | 28 (3.5%) |
| $100,000+ | 24 (2.9%) | 0 (0.0%) |
| Total | 829 (100.0%) | 797 (100.0%) |
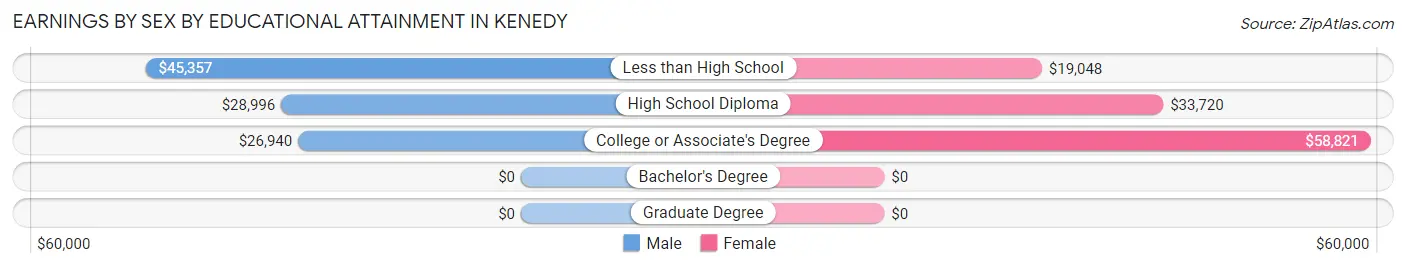
Earnings by Sex by Educational Attainment in Kenedy
Average earnings in Kenedy are $28,230 for men and $33,452 for women, a difference of 15.6%. Men with an educational attainment of less than high school enjoy the highest average annual earnings of $45,357, while those with college or associate's degree education earn the least with $26,940. Women with an educational attainment of college or associate's degree earn the most with the average annual earnings of $58,821, while those with less than high school education have the smallest earnings of $19,048.
| Educational Attainment | Male Income | Female Income |
| Less than High School | $45,357 | $19,048 |
| High School Diploma | $28,996 | $33,720 |
| College or Associate's Degree | $26,940 | $58,821 |
| Bachelor's Degree | - | - |
| Graduate Degree | - | - |
| Total | $28,230 | $33,452 |
Family Income in Kenedy
Family Income Brackets in Kenedy
According to the Kenedy family income data, there are 256 families falling into the $100,000 to $149,999 income range, which is the most common income bracket and makes up 33.1% of all families.
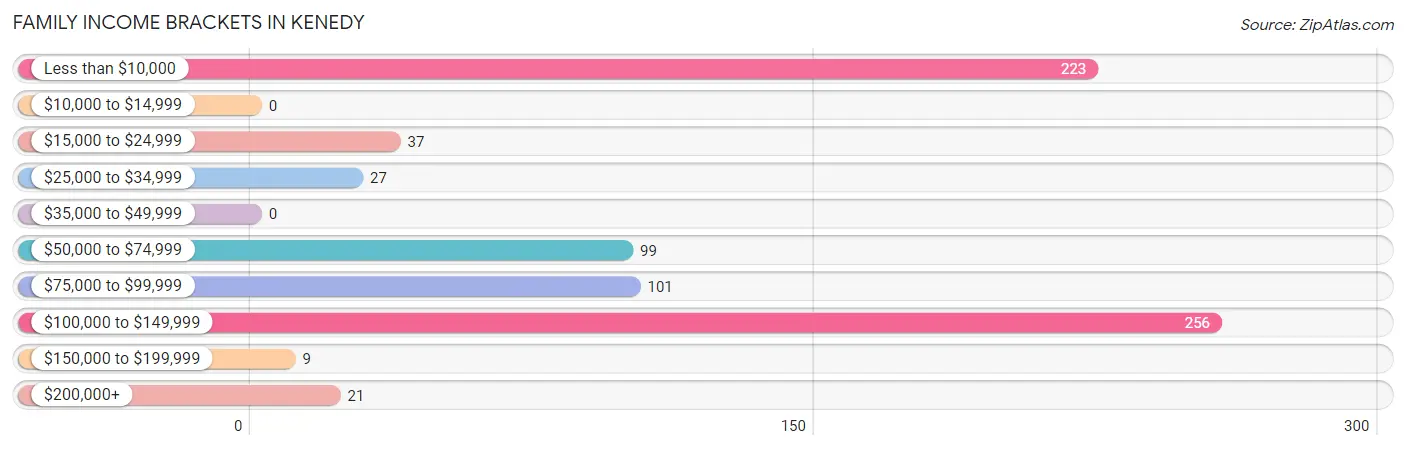
| Income Bracket | # Families | % Families |
| Less than $10,000 | 223 | 28.8% |
| $10,000 to $14,999 | 0 | 0.0% |
| $15,000 to $24,999 | 37 | 4.8% |
| $25,000 to $34,999 | 27 | 3.5% |
| $35,000 to $49,999 | 0 | 0.0% |
| $50,000 to $74,999 | 99 | 12.8% |
| $75,000 to $99,999 | 101 | 13.1% |
| $100,000 to $149,999 | 256 | 33.1% |
| $150,000 to $199,999 | 9 | 1.2% |
| $200,000+ | 21 | 2.7% |
Family Income by Famaliy Size in Kenedy
2-person families (317 | 41.0%) account for the highest median family income in Kenedy with $54,160 per family, while 2-person families (317 | 41.0%) have the highest median income of $27,080 per family member.
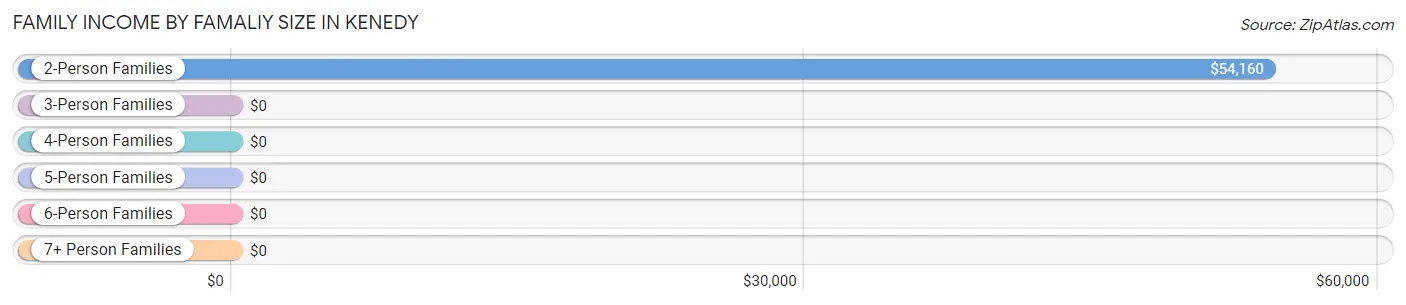
| Income Bracket | # Families | Median Income |
| 2-Person Families | 317 (41.0%) | $54,160 |
| 3-Person Families | 126 (16.3%) | $0 |
| 4-Person Families | 195 (25.2%) | $0 |
| 5-Person Families | 0 (0.0%) | $0 |
| 6-Person Families | 135 (17.5%) | $0 |
| 7+ Person Families | 0 (0.0%) | $0 |
| Total | 773 (100.0%) | $77,625 |
Family Income by Number of Earners in Kenedy
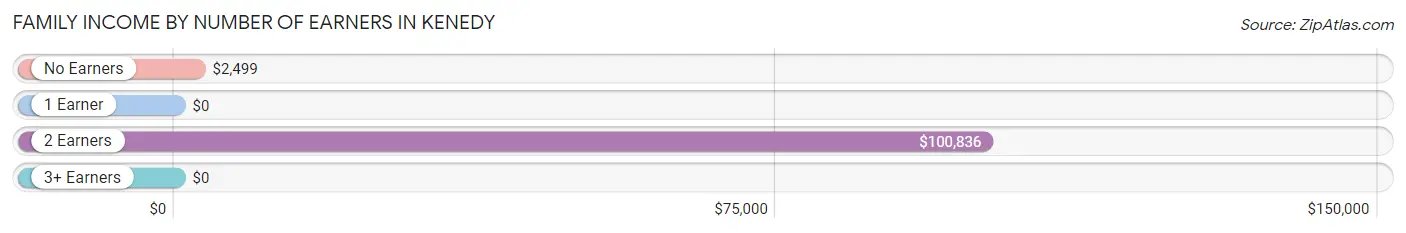
| Number of Earners | # Families | Median Income |
| No Earners | 205 (26.5%) | $2,499 |
| 1 Earner | 217 (28.1%) | $0 |
| 2 Earners | 275 (35.6%) | $100,836 |
| 3+ Earners | 76 (9.8%) | $0 |
| Total | 773 (100.0%) | $77,625 |
Household Income in Kenedy
Household Income Brackets in Kenedy
With 291 households falling in the category, the $100,000 to $149,999 income range is the most frequent in Kenedy, accounting for 25.2% of all households. In contrast, only 9 households (0.8%) fall into the $150,000 to $199,999 income bracket, making it the least populous group.
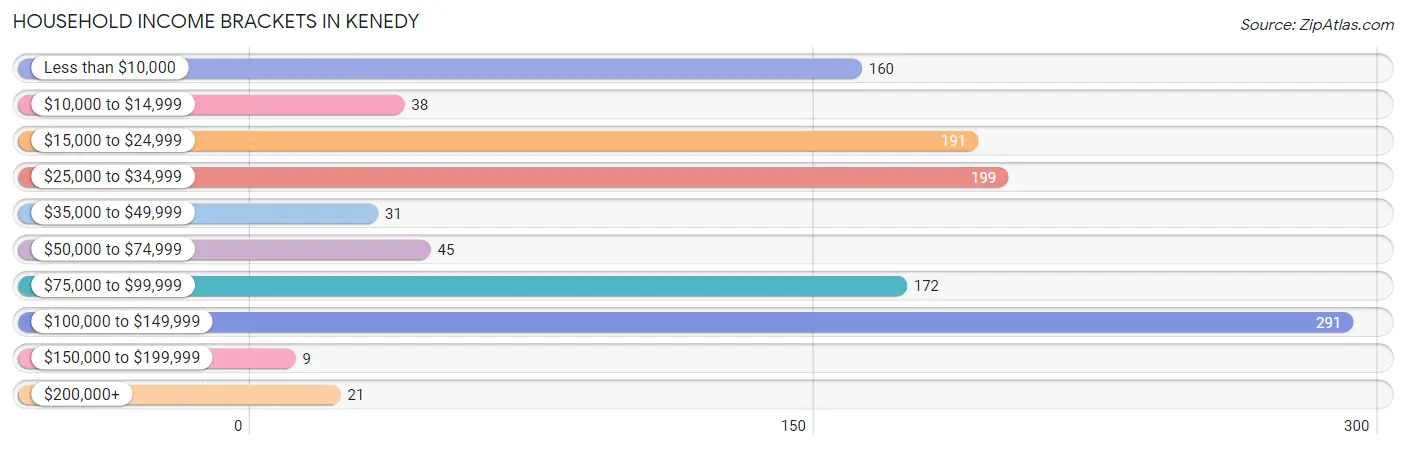
| Income Bracket | # Households | % Households |
| Less than $10,000 | 160 | 13.8% |
| $10,000 to $14,999 | 38 | 3.3% |
| $15,000 to $24,999 | 191 | 16.5% |
| $25,000 to $34,999 | 199 | 17.2% |
| $35,000 to $49,999 | 31 | 2.7% |
| $50,000 to $74,999 | 45 | 3.9% |
| $75,000 to $99,999 | 172 | 14.9% |
| $100,000 to $149,999 | 291 | 25.2% |
| $150,000 to $199,999 | 9 | 0.8% |
| $200,000+ | 21 | 1.8% |
Household Income by Householder Age in Kenedy
The median household income in Kenedy is $0, with the highest median household income of $86,567 found in the 25 to 44 years age bracket for the primary householder. A total of 584 households (50.5%) fall into this category.
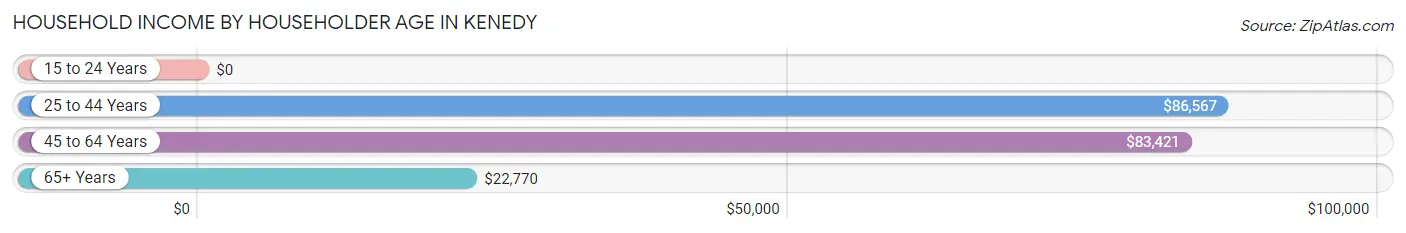
| Income Bracket | # Households | Median Income |
| 15 to 24 Years | 0 (0.0%) | $0 |
| 25 to 44 Years | 584 (50.5%) | $86,567 |
| 45 to 64 Years | 224 (19.4%) | $83,421 |
| 65+ Years | 348 (30.1%) | $22,770 |
| Total | 1,156 (100.0%) | $0 |
Poverty in Kenedy
Income Below Poverty by Sex and Age in Kenedy
With 16.5% poverty level for males and 42.3% for females among the residents of Kenedy, 5 year old males and under 5 year old females are the most vulnerable to poverty, with 59 males (100.0%) and 239 females (100.0%) in their respective age groups living below the poverty level.
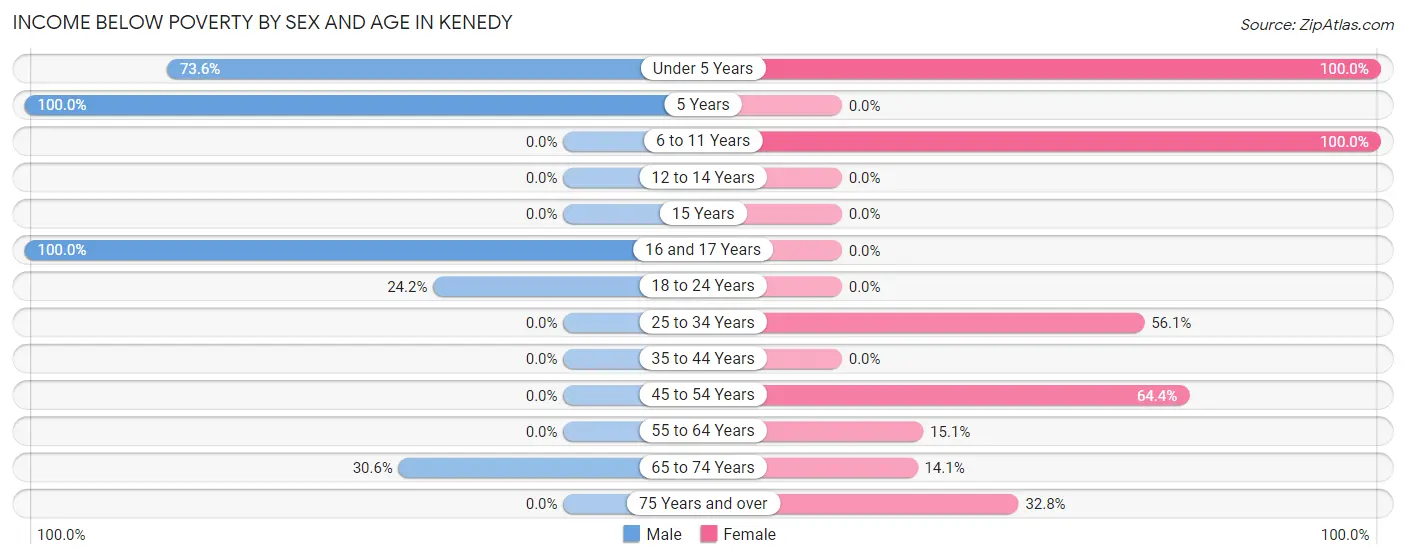
| Age Bracket | Male | Female |
| Under 5 Years | 103 (73.6%) | 239 (100.0%) |
| 5 Years | 59 (100.0%) | 0 (0.0%) |
| 6 to 11 Years | 0 (0.0%) | 210 (100.0%) |
| 12 to 14 Years | 0 (0.0%) | 0 (0.0%) |
| 15 Years | 0 (0.0%) | 0 (0.0%) |
| 16 and 17 Years | 16 (100.0%) | 0 (0.0%) |
| 18 to 24 Years | 57 (24.1%) | 0 (0.0%) |
| 25 to 34 Years | 0 (0.0%) | 197 (56.1%) |
| 35 to 44 Years | 0 (0.0%) | 0 (0.0%) |
| 45 to 54 Years | 0 (0.0%) | 29 (64.4%) |
| 55 to 64 Years | 0 (0.0%) | 29 (15.1%) |
| 65 to 74 Years | 22 (30.6%) | 17 (14.1%) |
| 75 Years and over | 0 (0.0%) | 60 (32.8%) |
| Total | 257 (16.5%) | 781 (42.3%) |
Income Above Poverty by Sex and Age in Kenedy
According to the poverty statistics in Kenedy, males aged 6 to 11 years and females aged 12 to 14 years are the age groups that are most secure financially, with 100.0% of males and 100.0% of females in these age groups living above the poverty line.
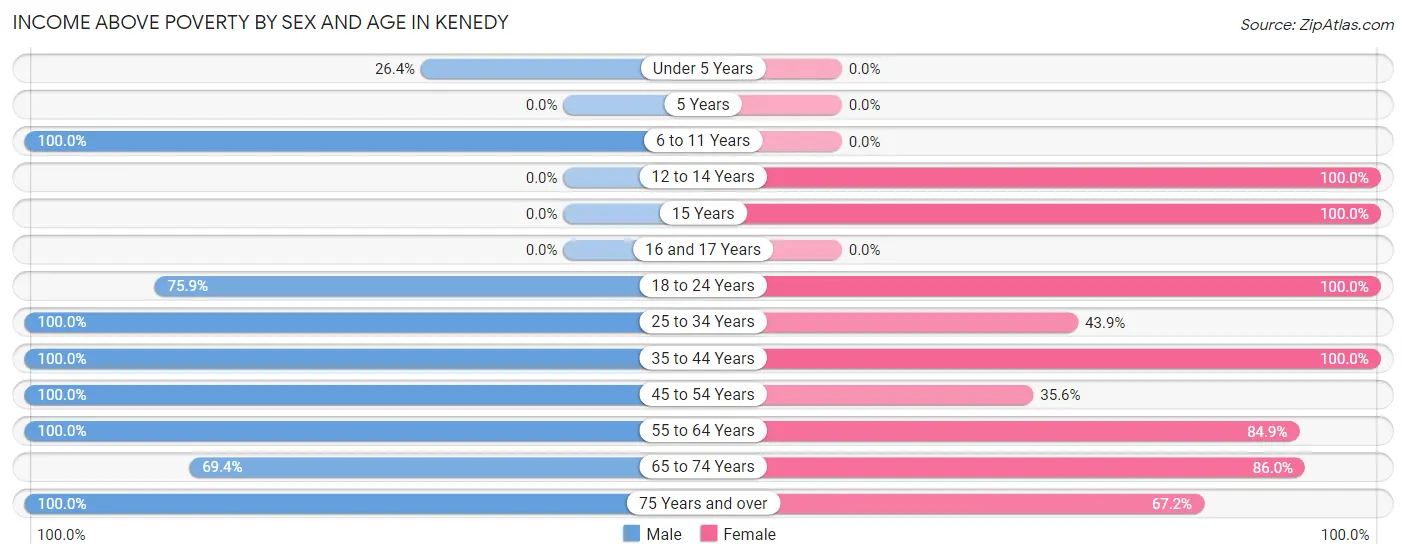
| Age Bracket | Male | Female |
| Under 5 Years | 37 (26.4%) | 0 (0.0%) |
| 5 Years | 0 (0.0%) | 0 (0.0%) |
| 6 to 11 Years | 282 (100.0%) | 0 (0.0%) |
| 12 to 14 Years | 0 (0.0%) | 35 (100.0%) |
| 15 Years | 0 (0.0%) | 148 (100.0%) |
| 16 and 17 Years | 0 (0.0%) | 0 (0.0%) |
| 18 to 24 Years | 179 (75.8%) | 4 (100.0%) |
| 25 to 34 Years | 85 (100.0%) | 154 (43.9%) |
| 35 to 44 Years | 387 (100.0%) | 319 (100.0%) |
| 45 to 54 Years | 112 (100.0%) | 16 (35.6%) |
| 55 to 64 Years | 86 (100.0%) | 163 (84.9%) |
| 65 to 74 Years | 50 (69.4%) | 104 (86.0%) |
| 75 Years and over | 87 (100.0%) | 123 (67.2%) |
| Total | 1,305 (83.6%) | 1,066 (57.7%) |
Income Below Poverty Among Married-Couple Families in Kenedy
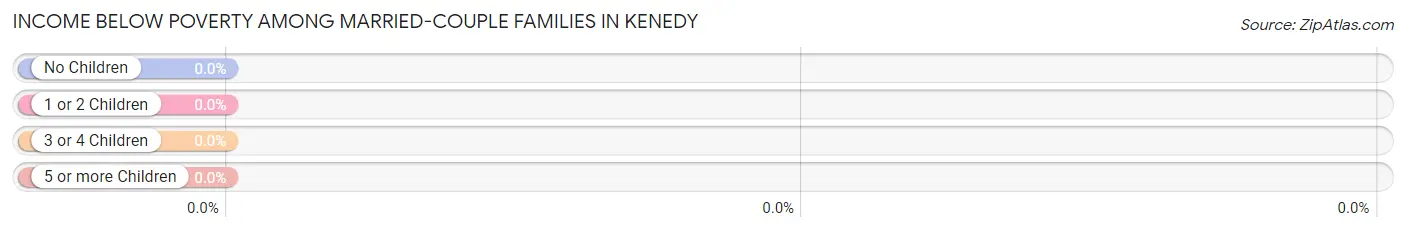
| Children | Above Poverty | Below Poverty |
| No Children | 236 (100.0%) | 0 (0.0%) |
| 1 or 2 Children | 151 (100.0%) | 0 (0.0%) |
| 3 or 4 Children | 0 (0.0%) | 0 (0.0%) |
| 5 or more Children | 0 (0.0%) | 0 (0.0%) |
| Total | 387 (100.0%) | 0 (0.0%) |
Income Below Poverty Among Single-Parent Households in Kenedy
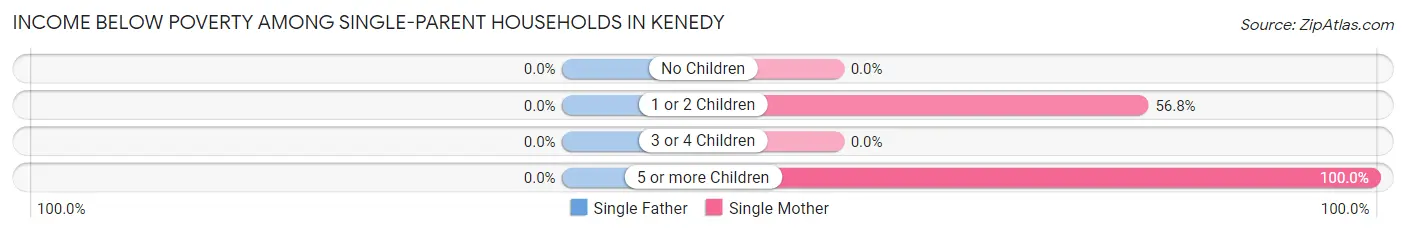
| Children | Single Father | Single Mother |
| No Children | 0 (0.0%) | 0 (0.0%) |
| 1 or 2 Children | 0 (0.0%) | 88 (56.8%) |
| 3 or 4 Children | 0 (0.0%) | 0 (0.0%) |
| 5 or more Children | 0 (0.0%) | 135 (100.0%) |
| Total | 0 (0.0%) | 223 (61.9%) |
Income Below Poverty Among Married-Couple vs Single-Parent Households in Kenedy
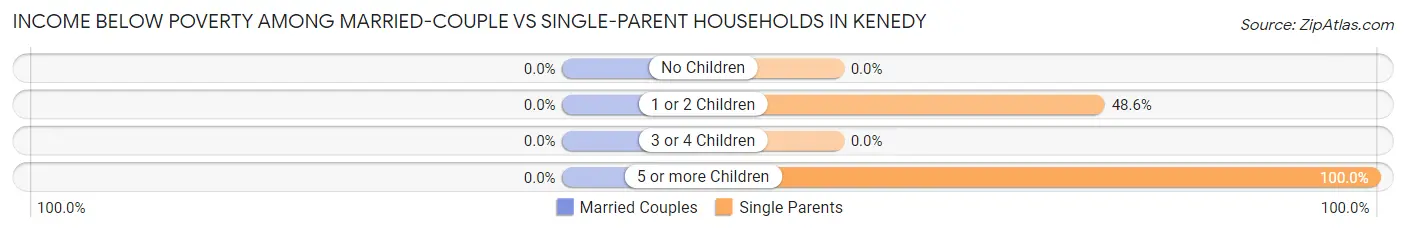
| Children | Married-Couple Families | Single-Parent Households |
| No Children | 0 (0.0%) | 0 (0.0%) |
| 1 or 2 Children | 0 (0.0%) | 88 (48.6%) |
| 3 or 4 Children | 0 (0.0%) | 0 (0.0%) |
| 5 or more Children | 0 (0.0%) | 135 (100.0%) |
| Total | 0 (0.0%) | 223 (57.8%) |
Race in Kenedy
The most populous races in Kenedy are Hispanic or Latino (2,990 | 86.2%), White / Caucasian (2,411 | 69.5%), and Two or more Races (705 | 20.3%).
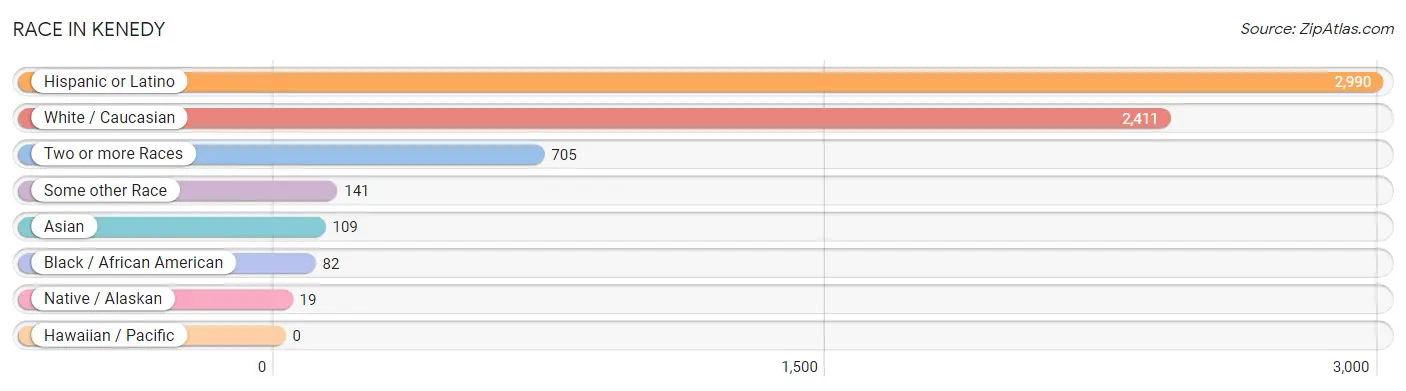
| Race | # Population | % Population |
| Asian | 109 | 3.1% |
| Black / African American | 82 | 2.4% |
| Hawaiian / Pacific | 0 | 0.0% |
| Hispanic or Latino | 2,990 | 86.2% |
| Native / Alaskan | 19 | 0.5% |
| White / Caucasian | 2,411 | 69.5% |
| Two or more Races | 705 | 20.3% |
| Some other Race | 141 | 4.1% |
| Total | 3,467 | 100.0% |
Ancestry in Kenedy
The most populous ancestries reported in Kenedy are Mexican (2,986 | 86.1%), Sri Lankan (109 | 3.1%), Irish (108 | 3.1%), German (85 | 2.5%), and American (45 | 1.3%), together accounting for 96.1% of all Kenedy residents.
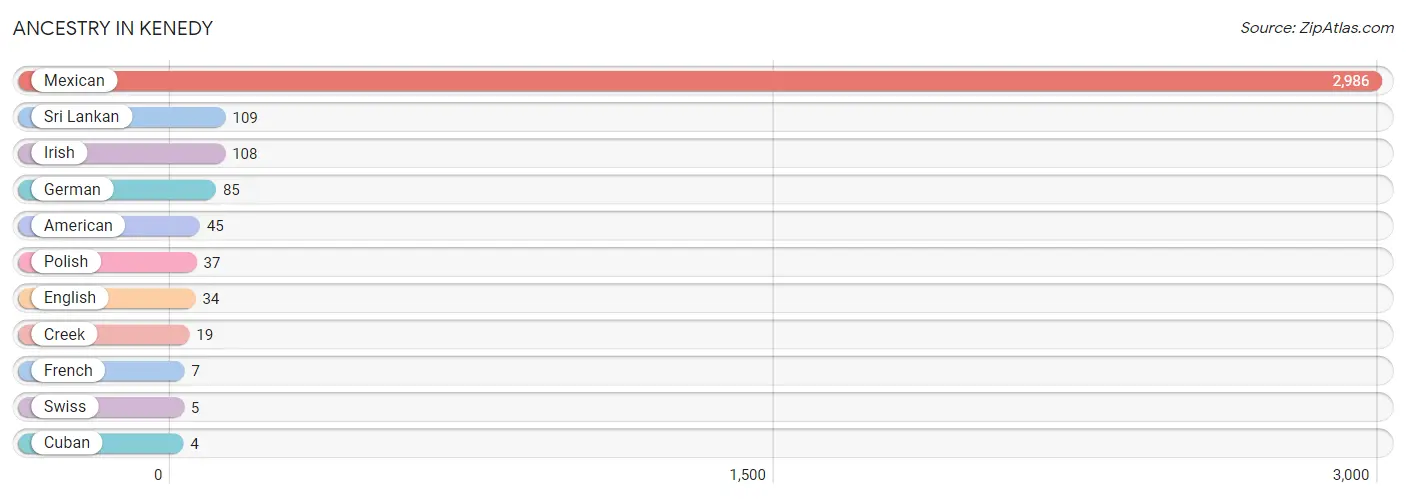
| Ancestry | # Population | % Population |
| American | 45 | 1.3% |
| Creek | 19 | 0.5% |
| Cuban | 4 | 0.1% |
| English | 34 | 1.0% |
| French | 7 | 0.2% |
| German | 85 | 2.5% |
| Irish | 108 | 3.1% |
| Mexican | 2,986 | 86.1% |
| Polish | 37 | 1.1% |
| Sri Lankan | 109 | 3.1% |
| Swiss | 5 | 0.1% | View All 11 Rows |
Immigrants in Kenedy
The most numerous immigrant groups reported in Kenedy came from Asia (109 | 3.1%), South Eastern Asia (109 | 3.1%), Vietnam (109 | 3.1%), Latin America (33 | 0.9%), and Central America (29 | 0.8%), together accounting for 11.2% of all Kenedy residents.
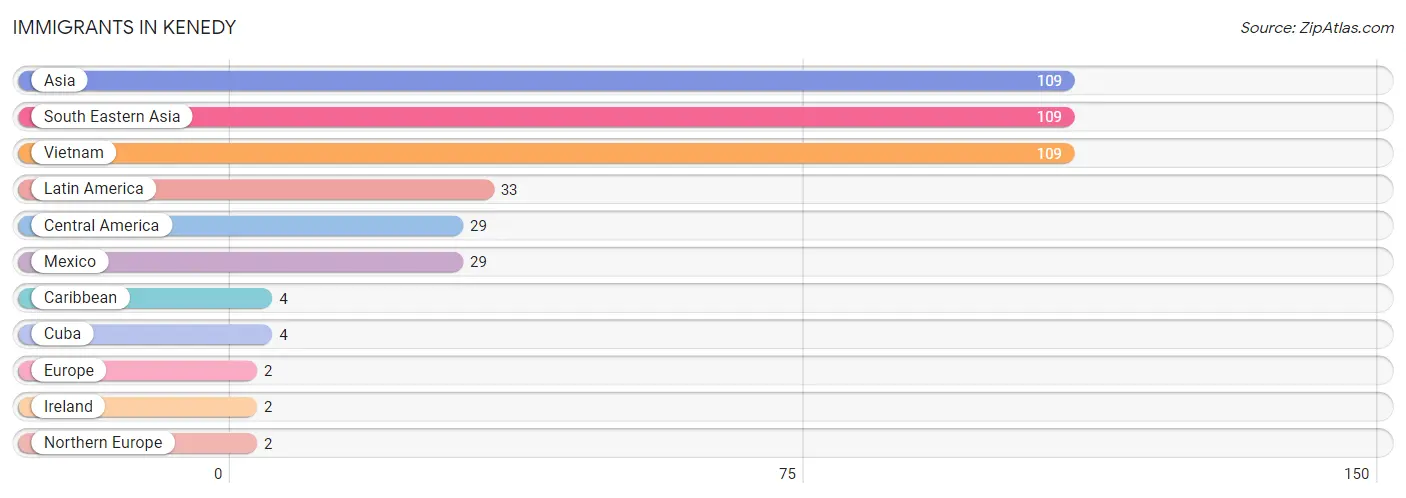
| Immigration Origin | # Population | % Population |
| Asia | 109 | 3.1% |
| Caribbean | 4 | 0.1% |
| Central America | 29 | 0.8% |
| Cuba | 4 | 0.1% |
| Europe | 2 | 0.1% |
| Ireland | 2 | 0.1% |
| Latin America | 33 | 0.9% |
| Mexico | 29 | 0.8% |
| Northern Europe | 2 | 0.1% |
| South Eastern Asia | 109 | 3.1% |
| Vietnam | 109 | 3.1% | View All 11 Rows |
Sex and Age in Kenedy
Sex and Age in Kenedy
The most populous age groups in Kenedy are 40 to 44 Years (387 | 24.6%) for men and Under 5 Years (239 | 12.6%) for women.
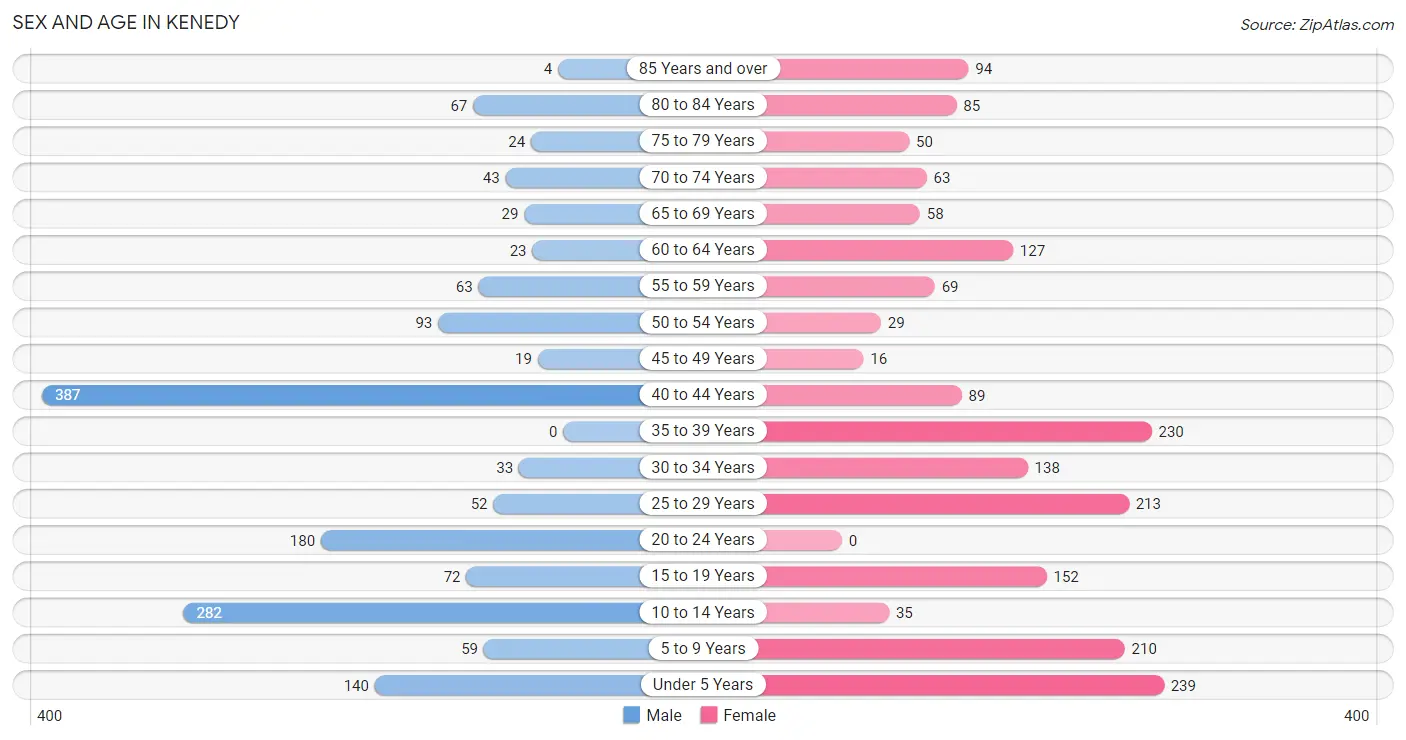
| Age Bracket | Male | Female |
| Under 5 Years | 140 (8.9%) | 239 (12.6%) |
| 5 to 9 Years | 59 (3.8%) | 210 (11.1%) |
| 10 to 14 Years | 282 (18.0%) | 35 (1.8%) |
| 15 to 19 Years | 72 (4.6%) | 152 (8.0%) |
| 20 to 24 Years | 180 (11.5%) | 0 (0.0%) |
| 25 to 29 Years | 52 (3.3%) | 213 (11.2%) |
| 30 to 34 Years | 33 (2.1%) | 138 (7.3%) |
| 35 to 39 Years | 0 (0.0%) | 230 (12.1%) |
| 40 to 44 Years | 387 (24.6%) | 89 (4.7%) |
| 45 to 49 Years | 19 (1.2%) | 16 (0.8%) |
| 50 to 54 Years | 93 (5.9%) | 29 (1.5%) |
| 55 to 59 Years | 63 (4.0%) | 69 (3.6%) |
| 60 to 64 Years | 23 (1.5%) | 127 (6.7%) |
| 65 to 69 Years | 29 (1.8%) | 58 (3.1%) |
| 70 to 74 Years | 43 (2.7%) | 63 (3.3%) |
| 75 to 79 Years | 24 (1.5%) | 50 (2.6%) |
| 80 to 84 Years | 67 (4.3%) | 85 (4.5%) |
| 85 Years and over | 4 (0.3%) | 94 (5.0%) |
| Total | 1,570 (100.0%) | 1,897 (100.0%) |
Families and Households in Kenedy
Median Family Size in Kenedy
The median family size in Kenedy is 3.41 persons per family, with married-couple families (387 | 50.1%) accounting for the largest median family size of 3.92 persons per family. On the other hand, single male/father families (26 | 3.4%) represent the smallest median family size with 2.35 persons per family.
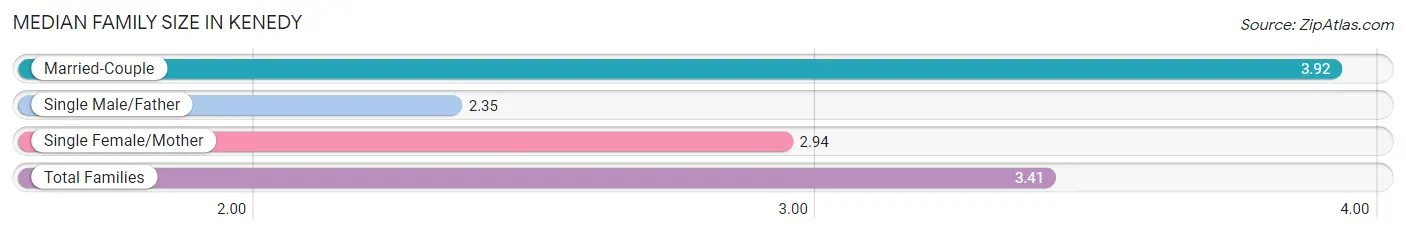
| Family Type | # Families | Family Size |
| Married-Couple | 387 (50.1%) | 3.92 |
| Single Male/Father | 26 (3.4%) | 2.35 |
| Single Female/Mother | 360 (46.6%) | 2.94 |
| Total Families | 773 (100.0%) | 3.41 |
Median Household Size in Kenedy
The median household size in Kenedy is 2.94 persons per household, with married-couple households (387 | 33.5%) accounting for the largest median household size of 4.11 persons per household. non-family households (383 | 33.1%) represent the smallest median household size with 1.19 persons per household.
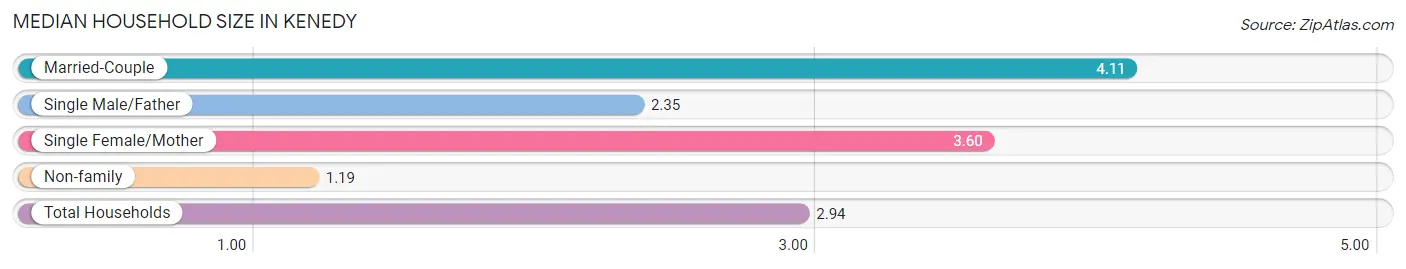
| Household Type | # Households | Household Size |
| Married-Couple | 387 (33.5%) | 4.11 |
| Single Male/Father | 26 (2.2%) | 2.35 |
| Single Female/Mother | 360 (31.1%) | 3.60 |
| Non-family | 383 (33.1%) | 1.19 |
| Total Households | 1,156 (100.0%) | 2.94 |
Household Size by Marriage Status in Kenedy
Out of a total of 1,156 households in Kenedy, 773 (66.9%) are family households, while 383 (33.1%) are nonfamily households. The most numerous type of family households are 3-person households, comprising 228, and the most common type of nonfamily households are 1-person households, comprising 372.
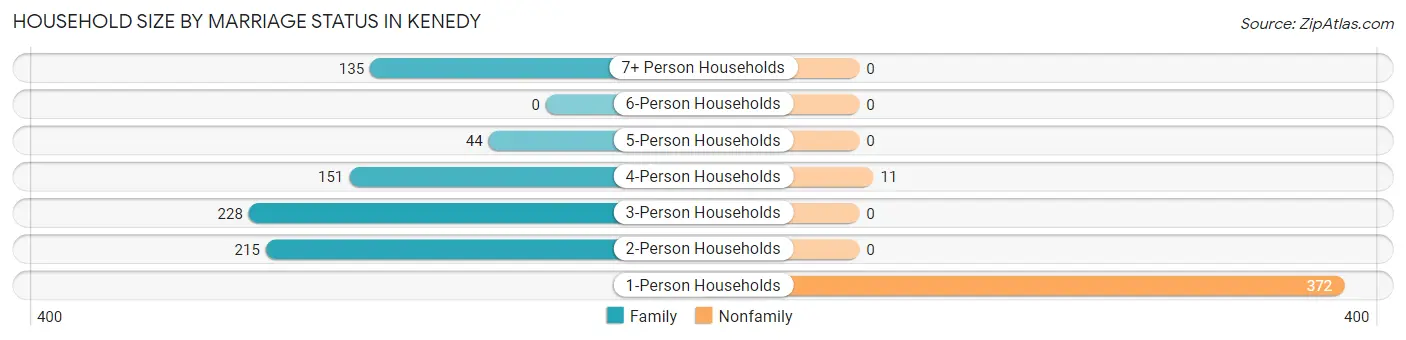
| Household Size | Family Households | Nonfamily Households |
| 1-Person Households | - | 372 (32.2%) |
| 2-Person Households | 215 (18.6%) | 0 (0.0%) |
| 3-Person Households | 228 (19.7%) | 0 (0.0%) |
| 4-Person Households | 151 (13.1%) | 11 (0.9%) |
| 5-Person Households | 44 (3.8%) | 0 (0.0%) |
| 6-Person Households | 0 (0.0%) | 0 (0.0%) |
| 7+ Person Households | 135 (11.7%) | 0 (0.0%) |
| Total | 773 (66.9%) | 383 (33.1%) |
Female Fertility in Kenedy
Fertility by Age in Kenedy
Average fertility rate in Kenedy is 161.0 births per 1,000 women. Women in the age bracket of 20 to 34 years have the highest fertility rate with 385.0 births per 1,000 women. Women in the age bracket of 20 to 34 years acount for 100.0% of all women with births.
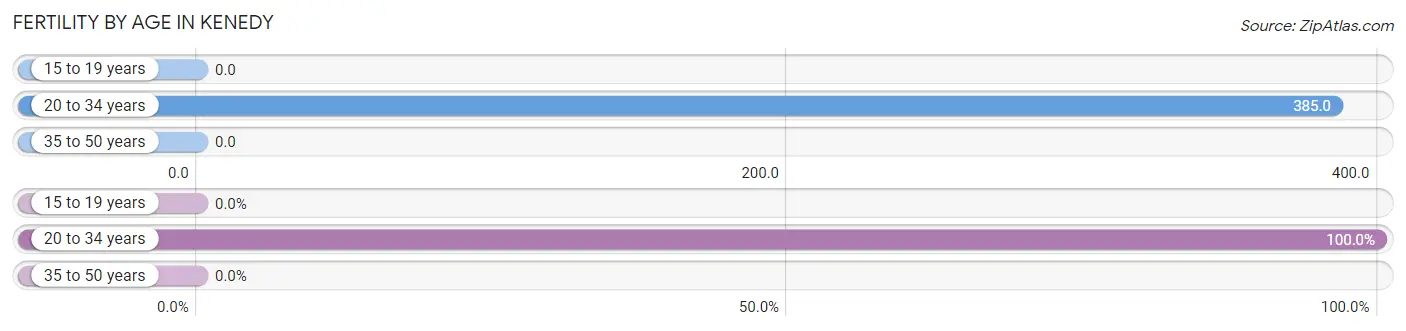
| Age Bracket | Women with Births | Births / 1,000 Women |
| 15 to 19 years | 0 (0.0%) | 0.0 |
| 20 to 34 years | 135 (100.0%) | 385.0 |
| 35 to 50 years | 0 (0.0%) | 0.0 |
| Total | 135 (100.0%) | 161.0 |
Fertility by Age by Marriage Status in Kenedy
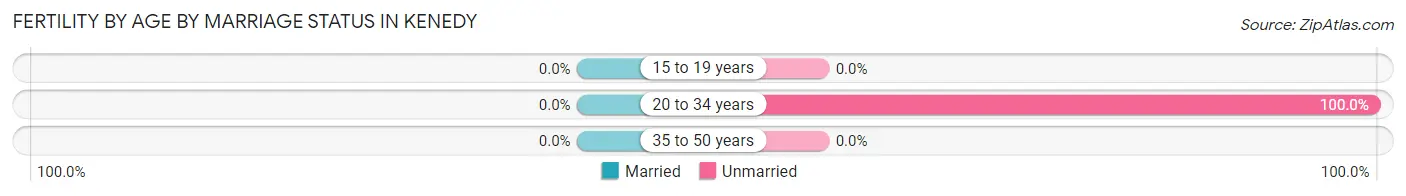
| Age Bracket | Married | Unmarried |
| 15 to 19 years | 0 (0.0%) | 0 (0.0%) |
| 20 to 34 years | 0 (0.0%) | 135 (100.0%) |
| 35 to 50 years | 0 (0.0%) | 0 (0.0%) |
| Total | 0 (0.0%) | 135 (100.0%) |
Fertility by Education in Kenedy
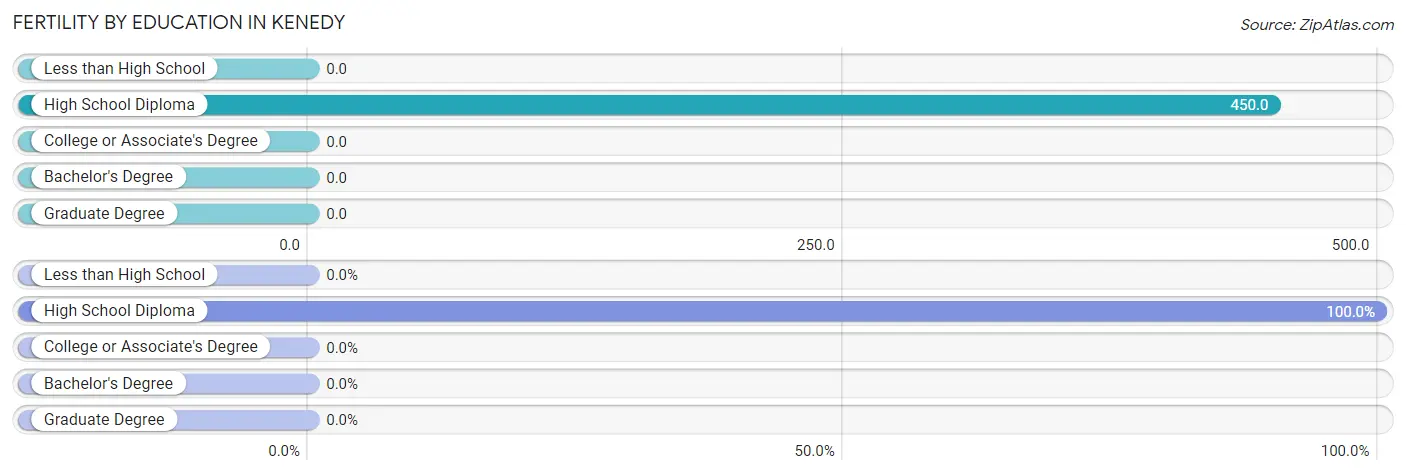
| Educational Attainment | Women with Births | Births / 1,000 Women |
| Less than High School | 0 (0.0%) | 0.0 |
| High School Diploma | 135 (100.0%) | 450.0 |
| College or Associate's Degree | 0 (0.0%) | 0.0 |
| Bachelor's Degree | 0 (0.0%) | 0.0 |
| Graduate Degree | 0 (0.0%) | 0.0 |
| Total | 135 (100.0%) | 161.0 |
Fertility by Education by Marriage Status in Kenedy
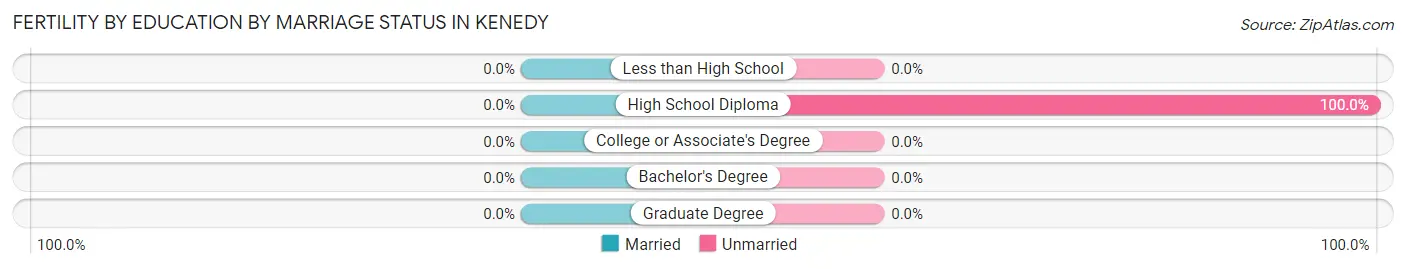
| Educational Attainment | Married | Unmarried |
| Less than High School | 0 (0.0%) | 0 (0.0%) |
| High School Diploma | 0 (0.0%) | 135 (100.0%) |
| College or Associate's Degree | 0 (0.0%) | 0 (0.0%) |
| Bachelor's Degree | 0 (0.0%) | 0 (0.0%) |
| Graduate Degree | 0 (0.0%) | 0 (0.0%) |
| Total | 0 (0.0%) | 135 (100.0%) |
Employment Characteristics in Kenedy
Employment by Class of Employer in Kenedy
Among the 1,454 employed individuals in Kenedy, private company employees (684 | 47.0%), local government employees (416 | 28.6%), and self-employed (not incorporated) (197 | 13.6%) make up the most common classes of employment.
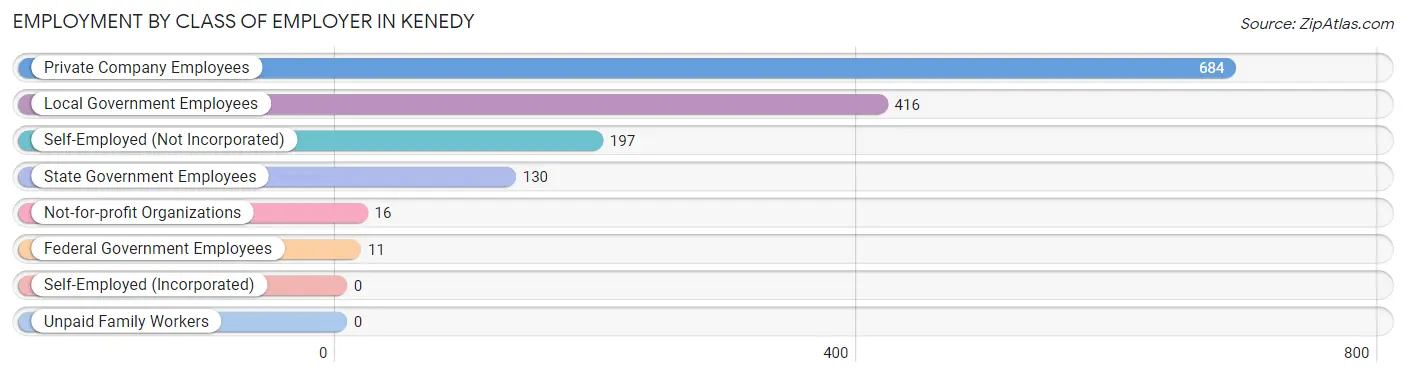
| Employer Class | # Employees | % Employees |
| Private Company Employees | 684 | 47.0% |
| Self-Employed (Incorporated) | 0 | 0.0% |
| Self-Employed (Not Incorporated) | 197 | 13.6% |
| Not-for-profit Organizations | 16 | 1.1% |
| Local Government Employees | 416 | 28.6% |
| State Government Employees | 130 | 8.9% |
| Federal Government Employees | 11 | 0.8% |
| Unpaid Family Workers | 0 | 0.0% |
| Total | 1,454 | 100.0% |
Employment Status by Age in Kenedy
According to the labor force statistics for Kenedy, out of the total population over 16 years of age (2,354), 68.1% or 1,603 individuals are in the labor force, with 9.2% or 147 of them unemployed. The age group with the highest labor force participation rate is 25 to 29 years, with 100.0% or 265 individuals in the labor force. Within the labor force, the 35 to 44 years age range has the highest percentage of unemployed individuals, with 19.4% or 137 of them being unemployed.
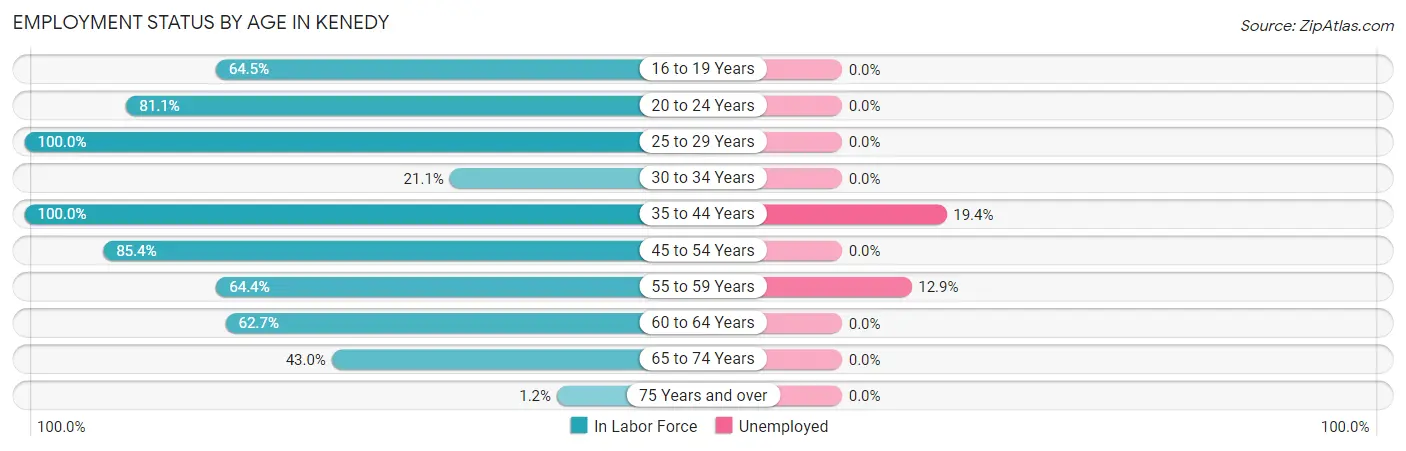
| Age Bracket | In Labor Force | Unemployed |
| 16 to 19 Years | 49 (64.5%) | 0 (0.0%) |
| 20 to 24 Years | 146 (81.1%) | 0 (0.0%) |
| 25 to 29 Years | 265 (100.0%) | 0 (0.0%) |
| 30 to 34 Years | 36 (21.1%) | 0 (0.0%) |
| 35 to 44 Years | 706 (100.0%) | 137 (19.4%) |
| 45 to 54 Years | 134 (85.4%) | 0 (0.0%) |
| 55 to 59 Years | 85 (64.4%) | 11 (12.9%) |
| 60 to 64 Years | 94 (62.7%) | 0 (0.0%) |
| 65 to 74 Years | 83 (43.0%) | 0 (0.0%) |
| 75 Years and over | 4 (1.2%) | 0 (0.0%) |
| Total | 1,603 (68.1%) | 147 (9.2%) |
Employment Status by Educational Attainment in Kenedy
According to labor force statistics for Kenedy, 83.5% of individuals (1,320) out of the total population between 25 and 64 years of age (1,581) are in the labor force, with 11.2% or 148 of them being unemployed. The group with the highest labor force participation rate are those with the educational attainment of college / associate degree, with 97.4% or 714 individuals in the labor force. Within the labor force, individuals with high school diploma education have the highest percentage of unemployment, with 37.1% or 148 of them being unemployed.
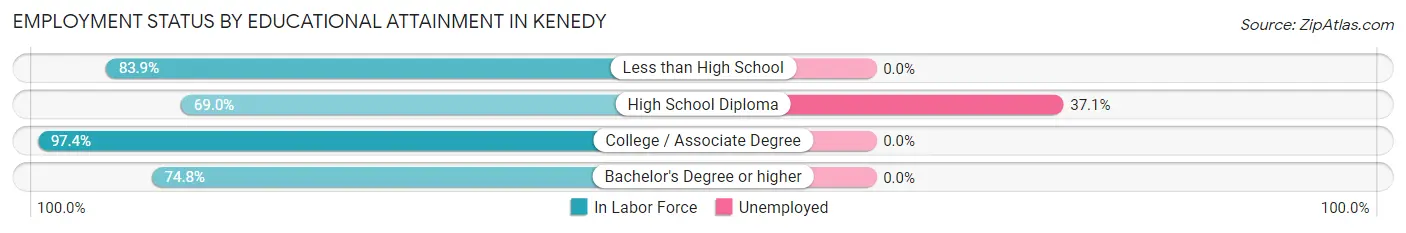
| Educational Attainment | In Labor Force | Unemployed |
| Less than High School | 47 (83.9%) | 0 (0.0%) |
| High School Diploma | 399 (69.0%) | 214 (37.1%) |
| College / Associate Degree | 714 (97.4%) | 0 (0.0%) |
| Bachelor's Degree or higher | 160 (74.8%) | 0 (0.0%) |
| Total | 1,320 (83.5%) | 177 (11.2%) |
Employment Occupations by Sex in Kenedy
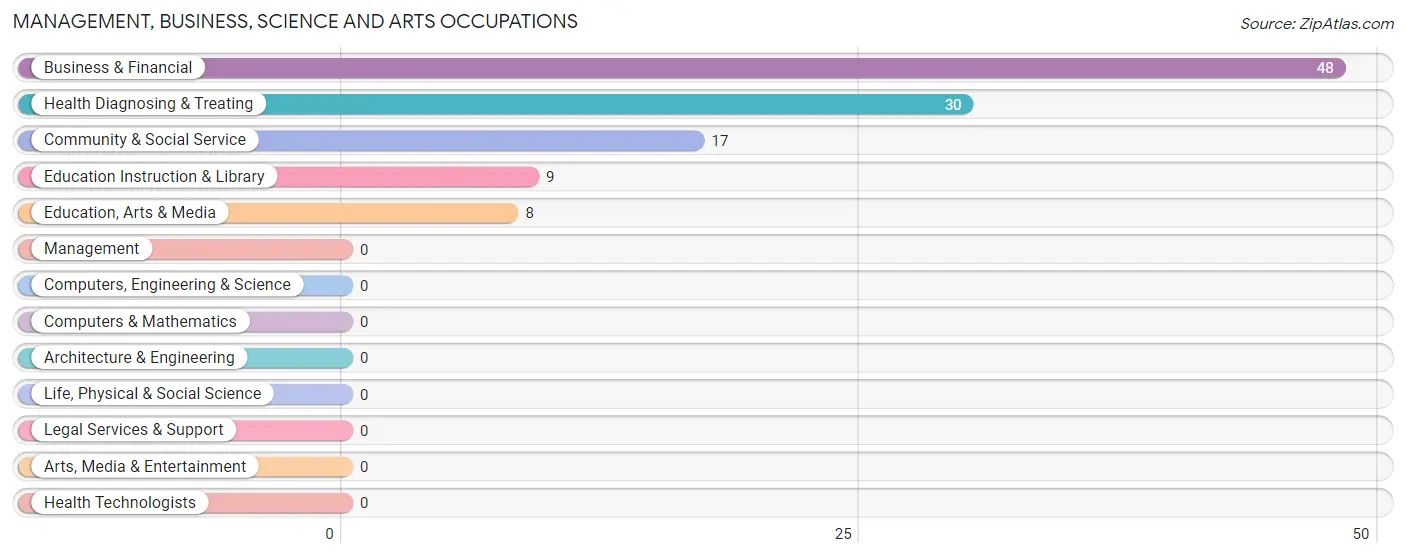
Management, Business, Science and Arts Occupations
The most common Management, Business, Science and Arts occupations in Kenedy are Business & Financial (48 | 3.3%), Health Diagnosing & Treating (30 | 2.1%), Community & Social Service (17 | 1.2%), Education Instruction & Library (9 | 0.6%), and Education, Arts & Media (8 | 0.5%).
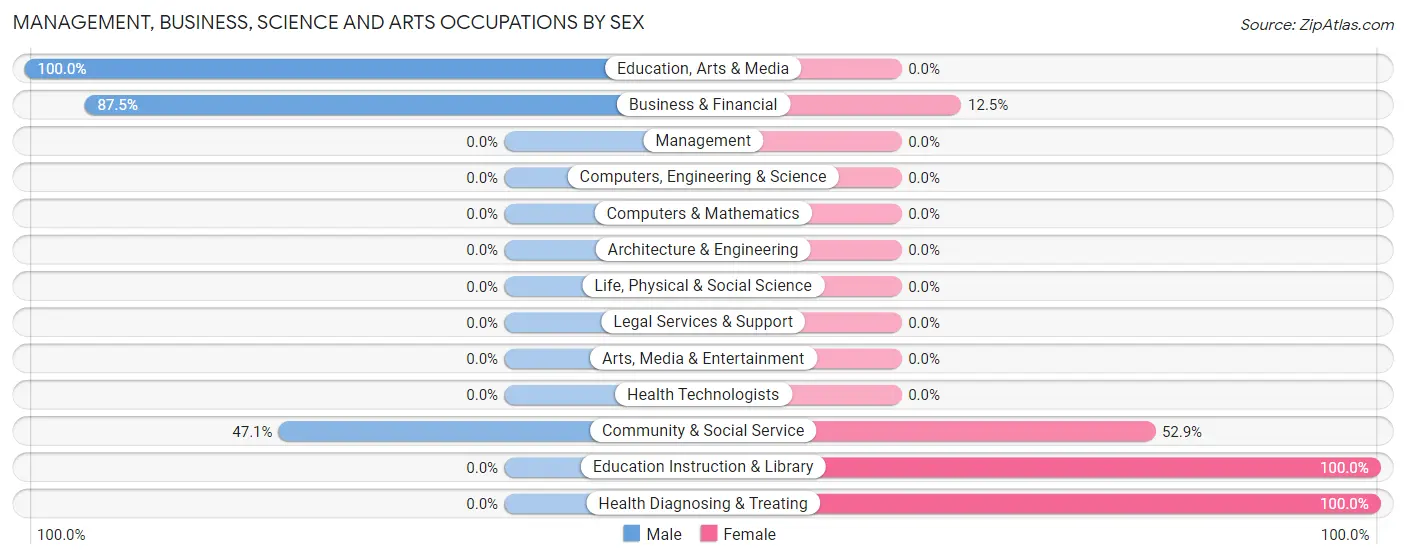
Management, Business, Science and Arts Occupations by Sex
Within the Management, Business, Science and Arts occupations in Kenedy, the most male-oriented occupations are Education, Arts & Media (100.0%), Business & Financial (87.5%), and Community & Social Service (47.1%), while the most female-oriented occupations are Education Instruction & Library (100.0%), Health Diagnosing & Treating (100.0%), and Community & Social Service (52.9%).
| Occupation | Male | Female |
| Management | 0 (0.0%) | 0 (0.0%) |
| Business & Financial | 42 (87.5%) | 6 (12.5%) |
| Computers, Engineering & Science | 0 (0.0%) | 0 (0.0%) |
| Computers & Mathematics | 0 (0.0%) | 0 (0.0%) |
| Architecture & Engineering | 0 (0.0%) | 0 (0.0%) |
| Life, Physical & Social Science | 0 (0.0%) | 0 (0.0%) |
| Community & Social Service | 8 (47.1%) | 9 (52.9%) |
| Education, Arts & Media | 8 (100.0%) | 0 (0.0%) |
| Legal Services & Support | 0 (0.0%) | 0 (0.0%) |
| Education Instruction & Library | 0 (0.0%) | 9 (100.0%) |
| Arts, Media & Entertainment | 0 (0.0%) | 0 (0.0%) |
| Health Diagnosing & Treating | 0 (0.0%) | 30 (100.0%) |
| Health Technologists | 0 (0.0%) | 0 (0.0%) |
| Total (Category) | 50 (52.6%) | 45 (47.4%) |
| Total (Overall) | 692 (47.6%) | 762 (52.4%) |
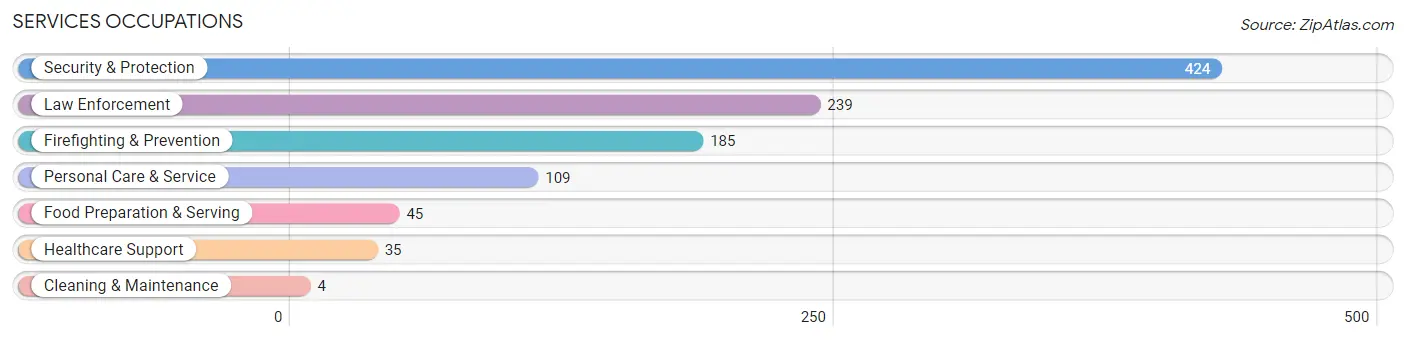
Services Occupations
The most common Services occupations in Kenedy are Security & Protection (424 | 29.2%), Law Enforcement (239 | 16.4%), Firefighting & Prevention (185 | 12.7%), Personal Care & Service (109 | 7.5%), and Food Preparation & Serving (45 | 3.1%).
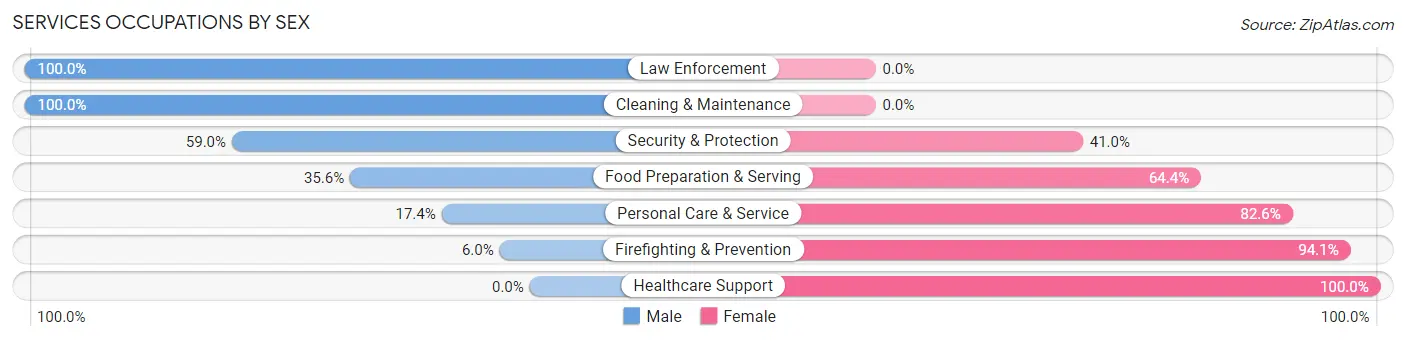
Services Occupations by Sex
Within the Services occupations in Kenedy, the most male-oriented occupations are Law Enforcement (100.0%), Cleaning & Maintenance (100.0%), and Security & Protection (59.0%), while the most female-oriented occupations are Healthcare Support (100.0%), Firefighting & Prevention (94.1%), and Personal Care & Service (82.6%).
| Occupation | Male | Female |
| Healthcare Support | 0 (0.0%) | 35 (100.0%) |
| Security & Protection | 250 (59.0%) | 174 (41.0%) |
| Firefighting & Prevention | 11 (5.9%) | 174 (94.1%) |
| Law Enforcement | 239 (100.0%) | 0 (0.0%) |
| Food Preparation & Serving | 16 (35.6%) | 29 (64.4%) |
| Cleaning & Maintenance | 4 (100.0%) | 0 (0.0%) |
| Personal Care & Service | 19 (17.4%) | 90 (82.6%) |
| Total (Category) | 289 (46.8%) | 328 (53.2%) |
| Total (Overall) | 692 (47.6%) | 762 (52.4%) |
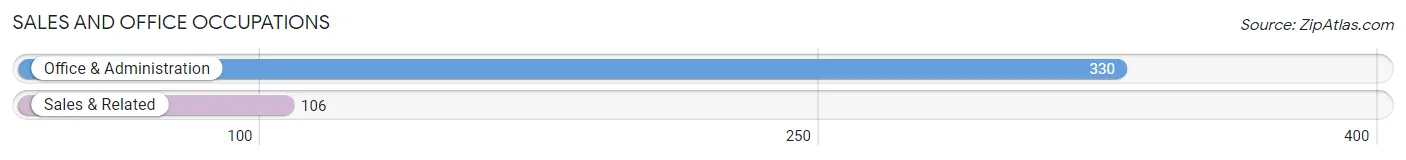
Sales and Office Occupations
The most common Sales and Office occupations in Kenedy are Office & Administration (330 | 22.7%), and Sales & Related (106 | 7.3%).
Sales and Office Occupations by Sex
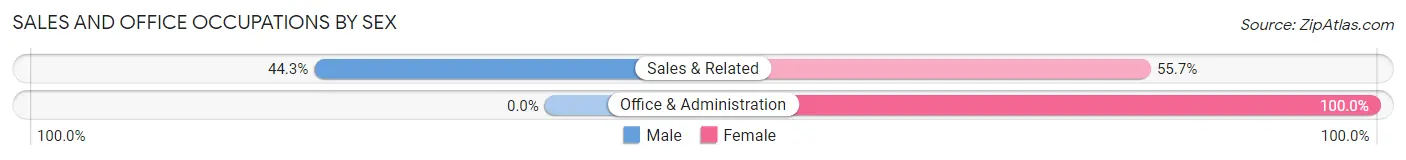
| Occupation | Male | Female |
| Sales & Related | 47 (44.3%) | 59 (55.7%) |
| Office & Administration | 0 (0.0%) | 330 (100.0%) |
| Total (Category) | 47 (10.8%) | 389 (89.2%) |
| Total (Overall) | 692 (47.6%) | 762 (52.4%) |
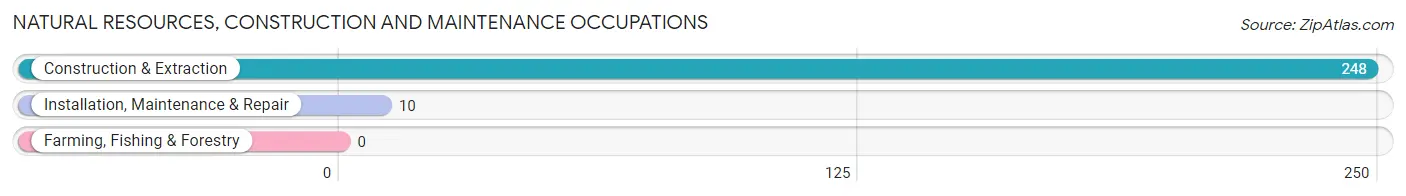
Natural Resources, Construction and Maintenance Occupations
The most common Natural Resources, Construction and Maintenance occupations in Kenedy are Construction & Extraction (248 | 17.1%), and Installation, Maintenance & Repair (10 | 0.7%).
Natural Resources, Construction and Maintenance Occupations by Sex
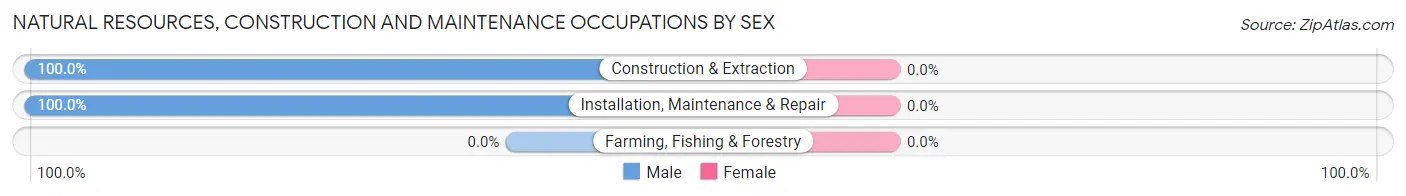
| Occupation | Male | Female |
| Farming, Fishing & Forestry | 0 (0.0%) | 0 (0.0%) |
| Construction & Extraction | 248 (100.0%) | 0 (0.0%) |
| Installation, Maintenance & Repair | 10 (100.0%) | 0 (0.0%) |
| Total (Category) | 258 (100.0%) | 0 (0.0%) |
| Total (Overall) | 692 (47.6%) | 762 (52.4%) |
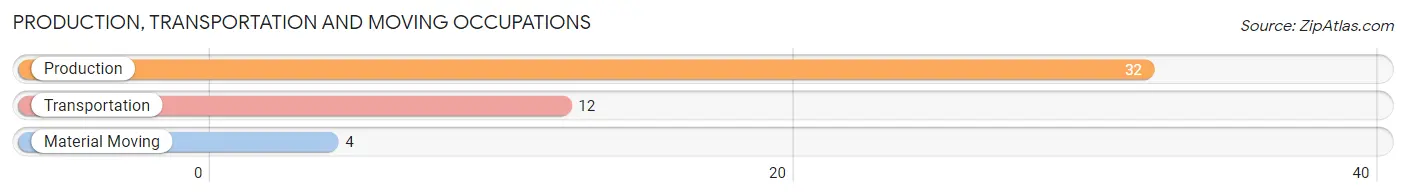
Production, Transportation and Moving Occupations
The most common Production, Transportation and Moving occupations in Kenedy are Production (32 | 2.2%), Transportation (12 | 0.8%), and Material Moving (4 | 0.3%).
Production, Transportation and Moving Occupations by Sex
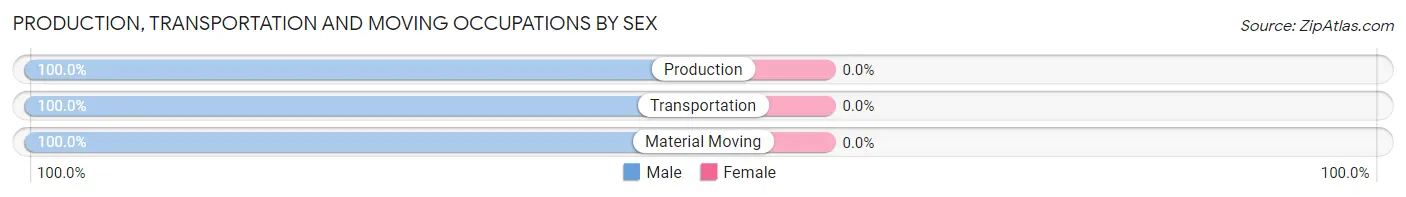
| Occupation | Male | Female |
| Production | 32 (100.0%) | 0 (0.0%) |
| Transportation | 12 (100.0%) | 0 (0.0%) |
| Material Moving | 4 (100.0%) | 0 (0.0%) |
| Total (Category) | 48 (100.0%) | 0 (0.0%) |
| Total (Overall) | 692 (47.6%) | 762 (52.4%) |
Employment Industries by Sex in Kenedy
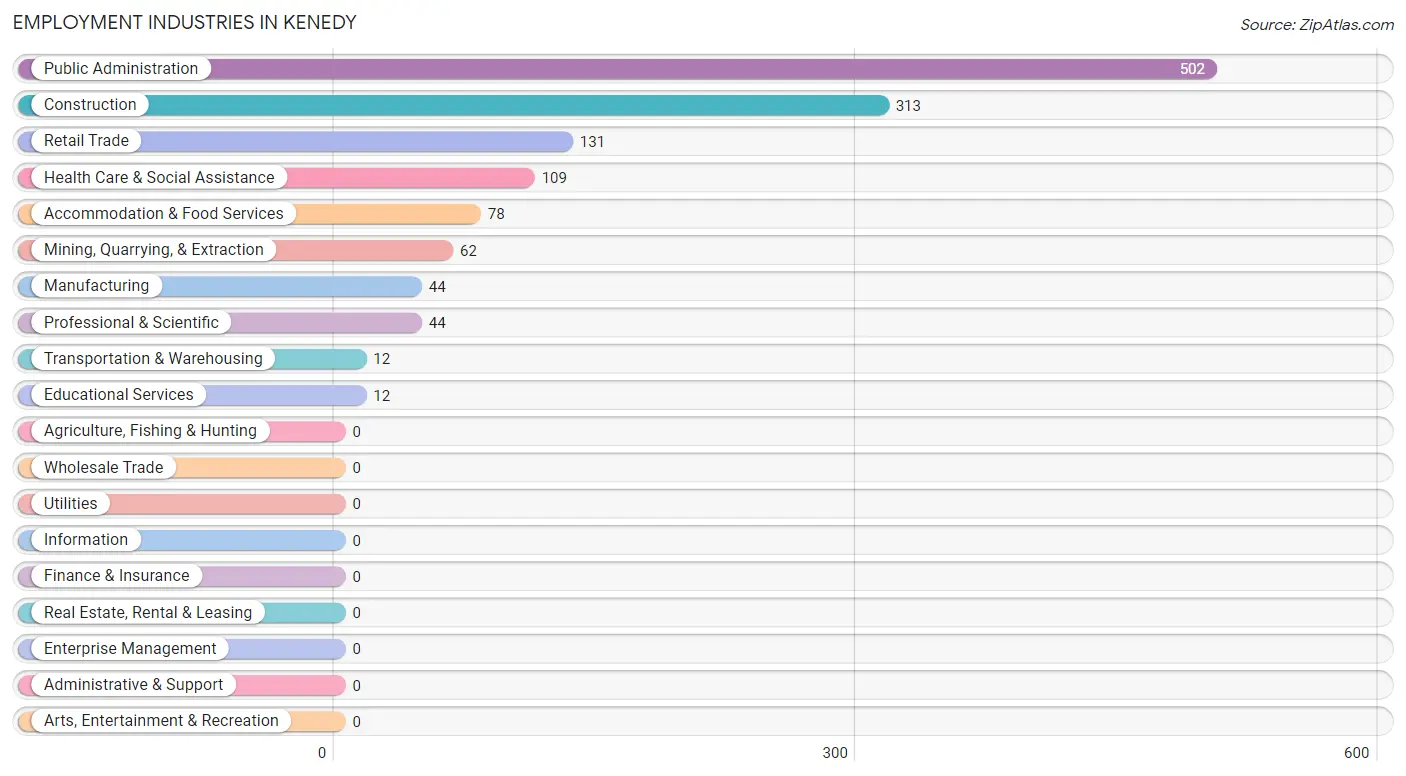
Employment Industries in Kenedy
The major employment industries in Kenedy include Public Administration (502 | 34.5%), Construction (313 | 21.5%), Retail Trade (131 | 9.0%), Health Care & Social Assistance (109 | 7.5%), and Accommodation & Food Services (78 | 5.4%).
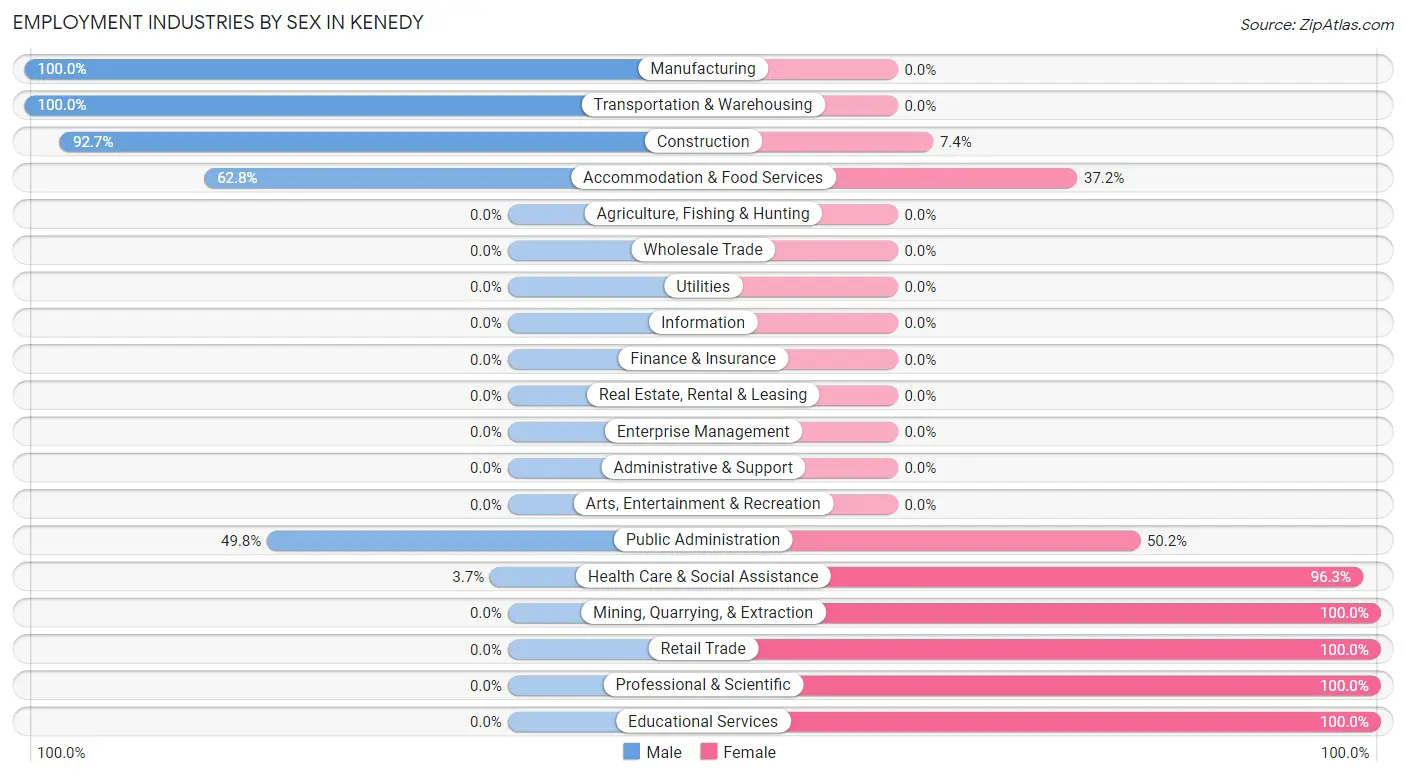
Employment Industries by Sex in Kenedy
The Kenedy industries that see more men than women are Manufacturing (100.0%), Transportation & Warehousing (100.0%), and Construction (92.6%), whereas the industries that tend to have a higher number of women are Mining, Quarrying, & Extraction (100.0%), Retail Trade (100.0%), and Professional & Scientific (100.0%).
| Industry | Male | Female |
| Agriculture, Fishing & Hunting | 0 (0.0%) | 0 (0.0%) |
| Mining, Quarrying, & Extraction | 0 (0.0%) | 62 (100.0%) |
| Construction | 290 (92.6%) | 23 (7.3%) |
| Manufacturing | 44 (100.0%) | 0 (0.0%) |
| Wholesale Trade | 0 (0.0%) | 0 (0.0%) |
| Retail Trade | 0 (0.0%) | 131 (100.0%) |
| Transportation & Warehousing | 12 (100.0%) | 0 (0.0%) |
| Utilities | 0 (0.0%) | 0 (0.0%) |
| Information | 0 (0.0%) | 0 (0.0%) |
| Finance & Insurance | 0 (0.0%) | 0 (0.0%) |
| Real Estate, Rental & Leasing | 0 (0.0%) | 0 (0.0%) |
| Professional & Scientific | 0 (0.0%) | 44 (100.0%) |
| Enterprise Management | 0 (0.0%) | 0 (0.0%) |
| Administrative & Support | 0 (0.0%) | 0 (0.0%) |
| Educational Services | 0 (0.0%) | 12 (100.0%) |
| Health Care & Social Assistance | 4 (3.7%) | 105 (96.3%) |
| Arts, Entertainment & Recreation | 0 (0.0%) | 0 (0.0%) |
| Accommodation & Food Services | 49 (62.8%) | 29 (37.2%) |
| Public Administration | 250 (49.8%) | 252 (50.2%) |
| Total | 692 (47.6%) | 762 (52.4%) |
Education in Kenedy
School Enrollment in Kenedy
The most common levels of schooling among the 579 students in Kenedy are kindergarten (210 | 36.3%), high school (174 | 30.0%), and nursery / preschool (138 | 23.8%).
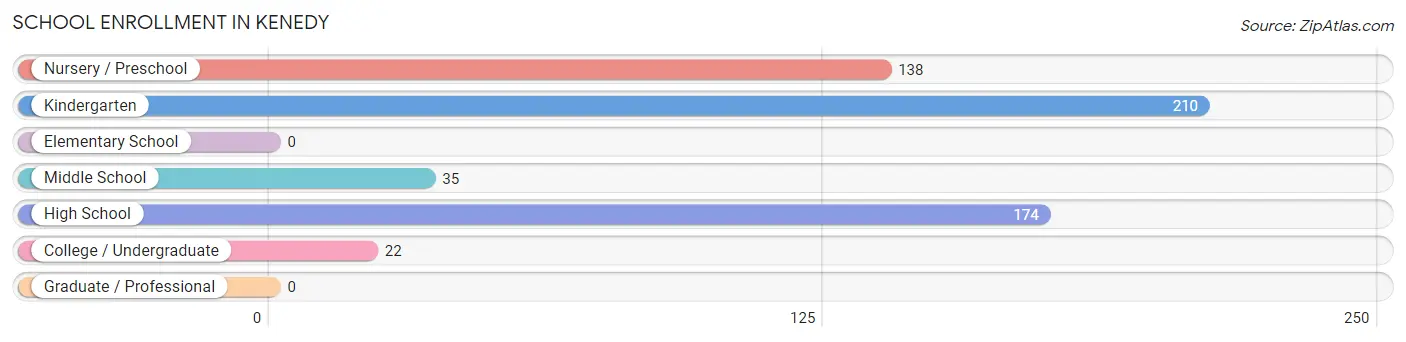
| School Level | # Students | % Students |
| Nursery / Preschool | 138 | 23.8% |
| Kindergarten | 210 | 36.3% |
| Elementary School | 0 | 0.0% |
| Middle School | 35 | 6.0% |
| High School | 174 | 30.0% |
| College / Undergraduate | 22 | 3.8% |
| Graduate / Professional | 0 | 0.0% |
| Total | 579 | 100.0% |
School Enrollment by Age by Funding Source in Kenedy
Out of a total of 579 students who are enrolled in schools in Kenedy, 3 (0.5%) attend a private institution, while the remaining 576 (99.5%) are enrolled in public schools. The age group of 25 to 34 year olds has the highest likelihood of being enrolled in private schools, with 3 (13.6% in the age bracket) enrolled. Conversely, the age group of 3 to 4 year olds has the lowest likelihood of being enrolled in a private school, with 79 (100.0% in the age bracket) attending a public institution.
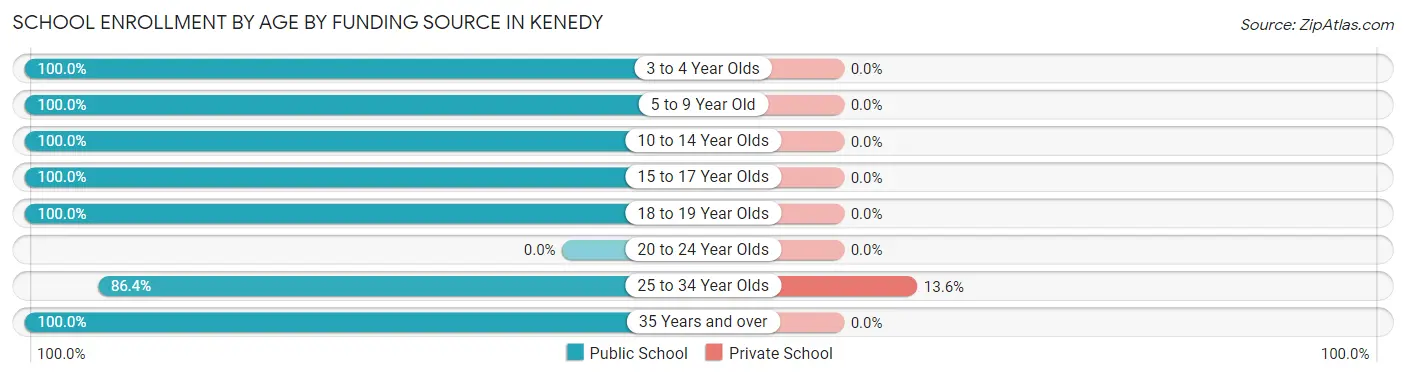
| Age Bracket | Public School | Private School |
| 3 to 4 Year Olds | 79 (100.0%) | 0 (0.0%) |
| 5 to 9 Year Old | 269 (100.0%) | 0 (0.0%) |
| 10 to 14 Year Olds | 35 (100.0%) | 0 (0.0%) |
| 15 to 17 Year Olds | 164 (100.0%) | 0 (0.0%) |
| 18 to 19 Year Olds | 4 (100.0%) | 0 (0.0%) |
| 20 to 24 Year Olds | 0 (0.0%) | 0 (0.0%) |
| 25 to 34 Year Olds | 19 (86.4%) | 3 (13.6%) |
| 35 Years and over | 6 (100.0%) | 0 (0.0%) |
| Total | 576 (99.5%) | 3 (0.5%) |
Educational Attainment by Field of Study in Kenedy
Education (81 | 31.0%), physical & health sciences (78 | 29.9%), engineering (71 | 27.2%), business (17 | 6.5%), and computers & mathematics (9 | 3.5%) are the most common fields of study among 261 individuals in Kenedy who have obtained a bachelor's degree or higher.
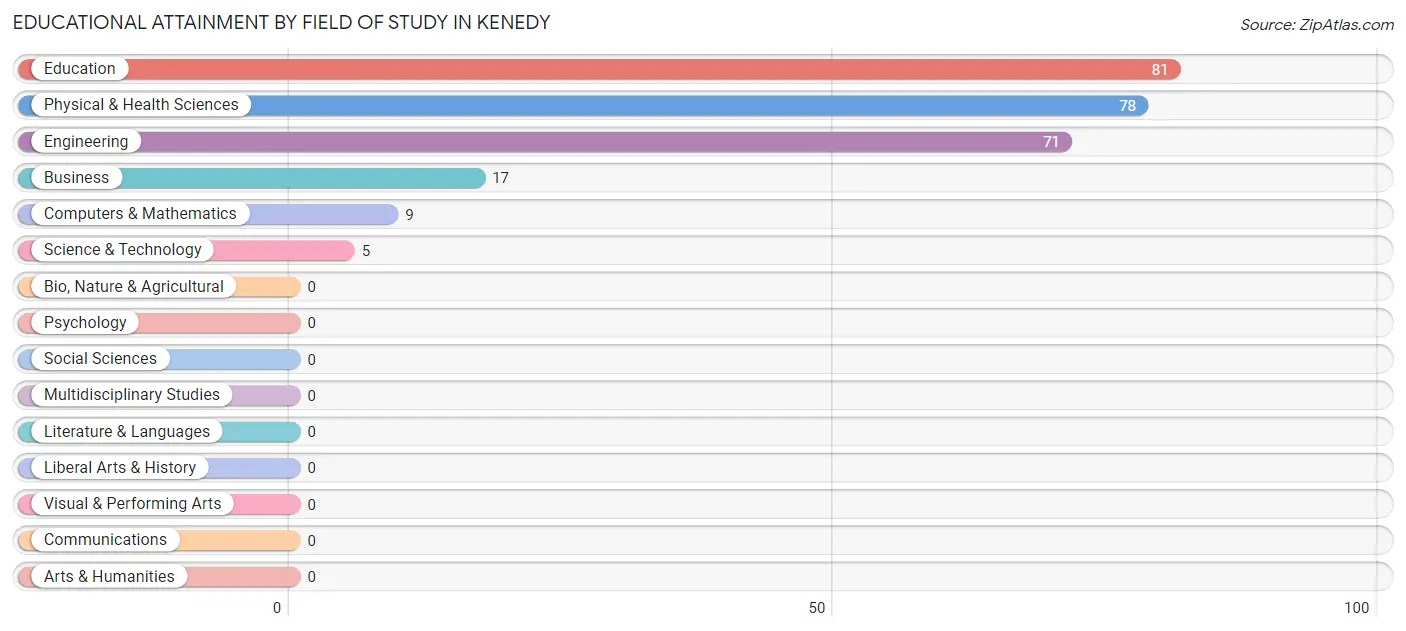
| Field of Study | # Graduates | % Graduates |
| Computers & Mathematics | 9 | 3.5% |
| Bio, Nature & Agricultural | 0 | 0.0% |
| Physical & Health Sciences | 78 | 29.9% |
| Psychology | 0 | 0.0% |
| Social Sciences | 0 | 0.0% |
| Engineering | 71 | 27.2% |
| Multidisciplinary Studies | 0 | 0.0% |
| Science & Technology | 5 | 1.9% |
| Business | 17 | 6.5% |
| Education | 81 | 31.0% |
| Literature & Languages | 0 | 0.0% |
| Liberal Arts & History | 0 | 0.0% |
| Visual & Performing Arts | 0 | 0.0% |
| Communications | 0 | 0.0% |
| Arts & Humanities | 0 | 0.0% |
| Total | 261 | 100.0% |
Transportation & Commute in Kenedy
Vehicle Availability by Sex in Kenedy
The most prevalent vehicle ownership categories in Kenedy are males with 2 vehicles (387, accounting for 55.9%) and females with 2 vehicles (389, making up 51.0%).
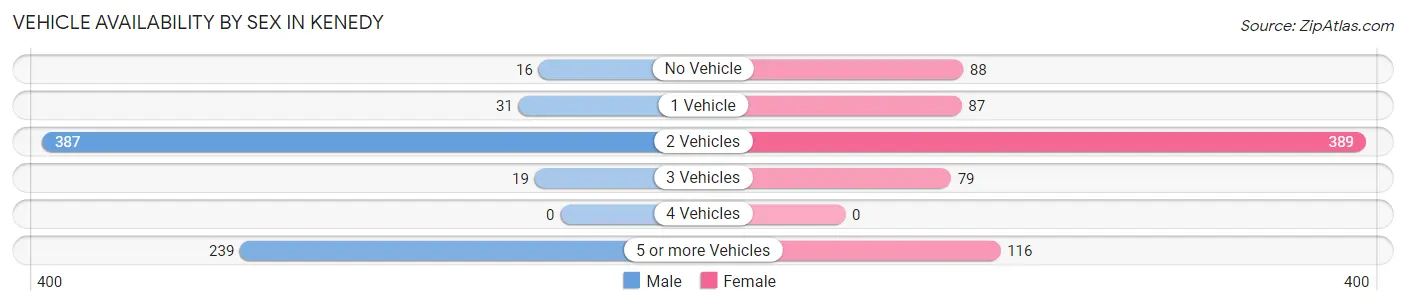
| Vehicles Available | Male | Female |
| No Vehicle | 16 (2.3%) | 88 (11.6%) |
| 1 Vehicle | 31 (4.5%) | 87 (11.5%) |
| 2 Vehicles | 387 (55.9%) | 389 (51.2%) |
| 3 Vehicles | 19 (2.8%) | 79 (10.4%) |
| 4 Vehicles | 0 (0.0%) | 0 (0.0%) |
| 5 or more Vehicles | 239 (34.5%) | 116 (15.3%) |
| Total | 692 (100.0%) | 759 (100.0%) |
Commute Time in Kenedy
The most frequently occuring commute durations in Kenedy are 10 to 14 minutes (394 commuters, 28.2%), 15 to 19 minutes (366 commuters, 26.2%), and 5 to 9 minutes (332 commuters, 23.7%).
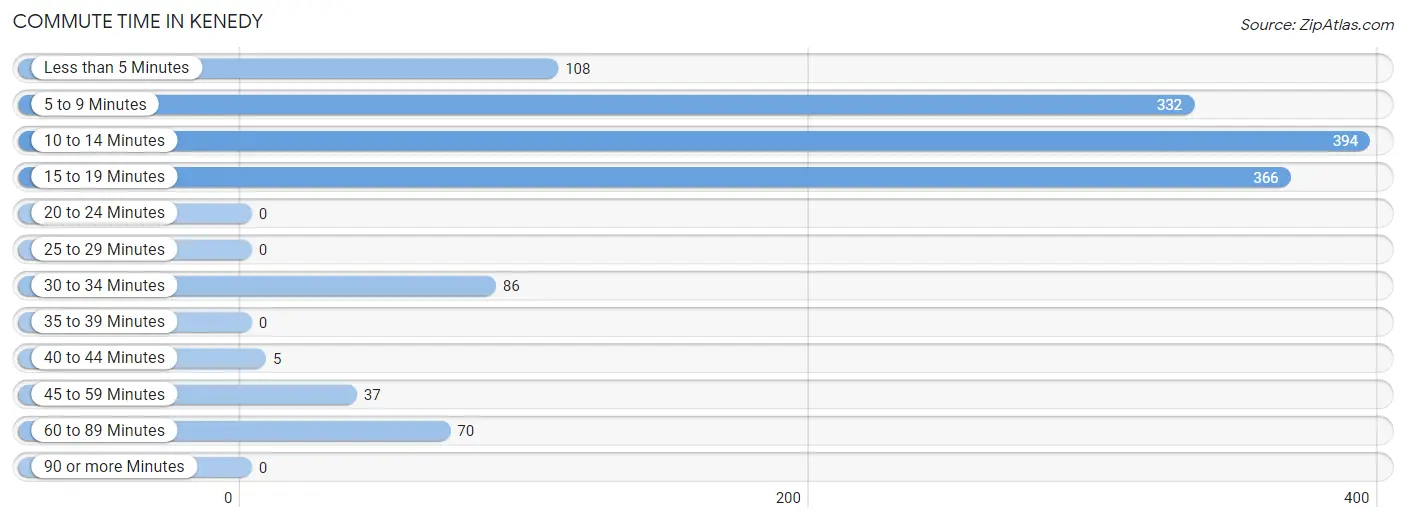
| Commute Time | # Commuters | % Commuters |
| Less than 5 Minutes | 108 | 7.7% |
| 5 to 9 Minutes | 332 | 23.7% |
| 10 to 14 Minutes | 394 | 28.2% |
| 15 to 19 Minutes | 366 | 26.2% |
| 20 to 24 Minutes | 0 | 0.0% |
| 25 to 29 Minutes | 0 | 0.0% |
| 30 to 34 Minutes | 86 | 6.1% |
| 35 to 39 Minutes | 0 | 0.0% |
| 40 to 44 Minutes | 5 | 0.4% |
| 45 to 59 Minutes | 37 | 2.6% |
| 60 to 89 Minutes | 70 | 5.0% |
| 90 or more Minutes | 0 | 0.0% |
Commute Time by Sex in Kenedy
The most common commute times in Kenedy are 5 to 9 minutes (291 commuters, 42.0%) for males and 10 to 14 minutes (257 commuters, 36.4%) for females.
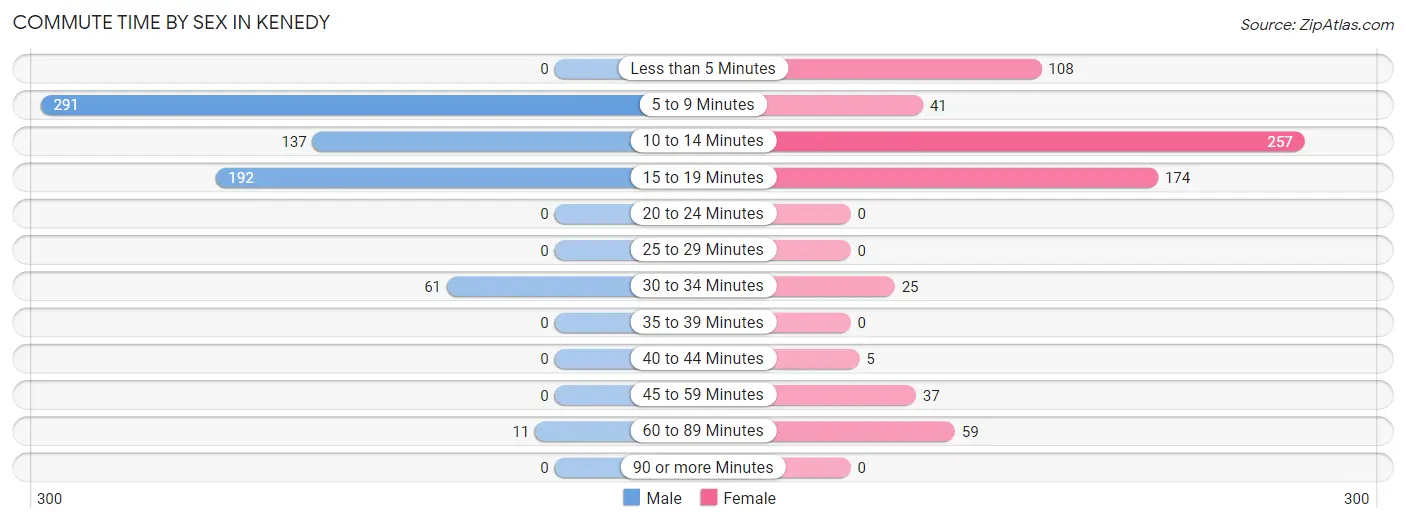
| Commute Time | Male | Female |
| Less than 5 Minutes | 0 (0.0%) | 108 (15.3%) |
| 5 to 9 Minutes | 291 (42.0%) | 41 (5.8%) |
| 10 to 14 Minutes | 137 (19.8%) | 257 (36.4%) |
| 15 to 19 Minutes | 192 (27.8%) | 174 (24.6%) |
| 20 to 24 Minutes | 0 (0.0%) | 0 (0.0%) |
| 25 to 29 Minutes | 0 (0.0%) | 0 (0.0%) |
| 30 to 34 Minutes | 61 (8.8%) | 25 (3.5%) |
| 35 to 39 Minutes | 0 (0.0%) | 0 (0.0%) |
| 40 to 44 Minutes | 0 (0.0%) | 5 (0.7%) |
| 45 to 59 Minutes | 0 (0.0%) | 37 (5.2%) |
| 60 to 89 Minutes | 11 (1.6%) | 59 (8.4%) |
| 90 or more Minutes | 0 (0.0%) | 0 (0.0%) |
Time of Departure to Work by Sex in Kenedy
The most frequent times of departure to work in Kenedy are 7:00 AM to 7:29 AM (210, 30.3%) for males and 5:00 AM to 5:29 AM (154, 21.8%) for females.
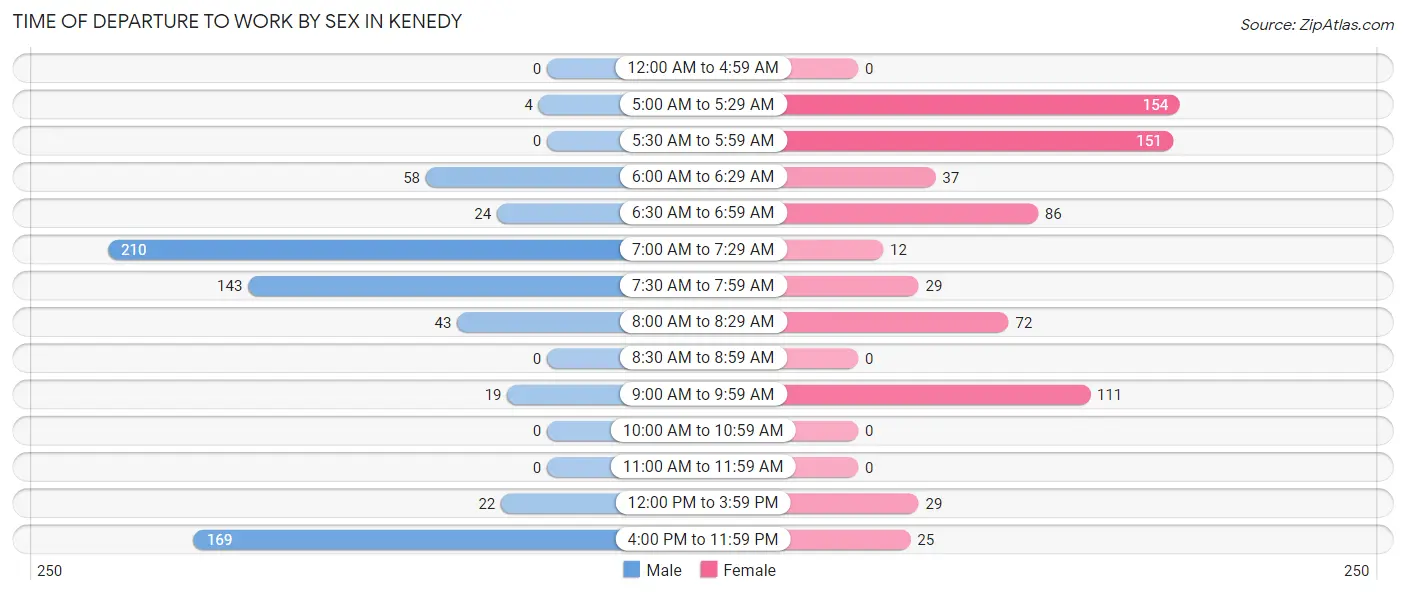
| Time of Departure | Male | Female |
| 12:00 AM to 4:59 AM | 0 (0.0%) | 0 (0.0%) |
| 5:00 AM to 5:29 AM | 4 (0.6%) | 154 (21.8%) |
| 5:30 AM to 5:59 AM | 0 (0.0%) | 151 (21.4%) |
| 6:00 AM to 6:29 AM | 58 (8.4%) | 37 (5.2%) |
| 6:30 AM to 6:59 AM | 24 (3.5%) | 86 (12.2%) |
| 7:00 AM to 7:29 AM | 210 (30.3%) | 12 (1.7%) |
| 7:30 AM to 7:59 AM | 143 (20.7%) | 29 (4.1%) |
| 8:00 AM to 8:29 AM | 43 (6.2%) | 72 (10.2%) |
| 8:30 AM to 8:59 AM | 0 (0.0%) | 0 (0.0%) |
| 9:00 AM to 9:59 AM | 19 (2.8%) | 111 (15.7%) |
| 10:00 AM to 10:59 AM | 0 (0.0%) | 0 (0.0%) |
| 11:00 AM to 11:59 AM | 0 (0.0%) | 0 (0.0%) |
| 12:00 PM to 3:59 PM | 22 (3.2%) | 29 (4.1%) |
| 4:00 PM to 11:59 PM | 169 (24.4%) | 25 (3.5%) |
| Total | 692 (100.0%) | 706 (100.0%) |
Housing Occupancy in Kenedy
Occupancy by Ownership in Kenedy
Of the total 1,156 dwellings in Kenedy, owner-occupied units account for 574 (49.6%), while renter-occupied units make up 582 (50.3%).
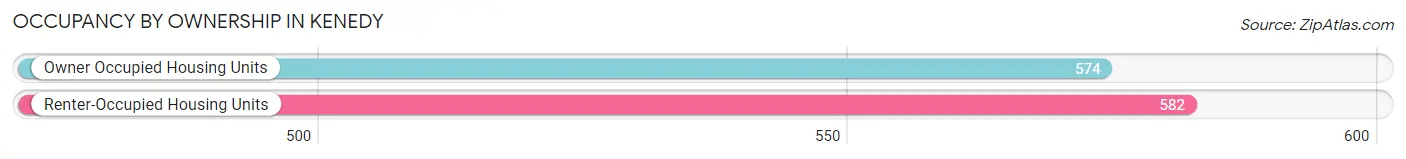
| Occupancy | # Housing Units | % Housing Units |
| Owner Occupied Housing Units | 574 | 49.6% |
| Renter-Occupied Housing Units | 582 | 50.3% |
| Total Occupied Housing Units | 1,156 | 100.0% |
Occupancy by Household Size in Kenedy
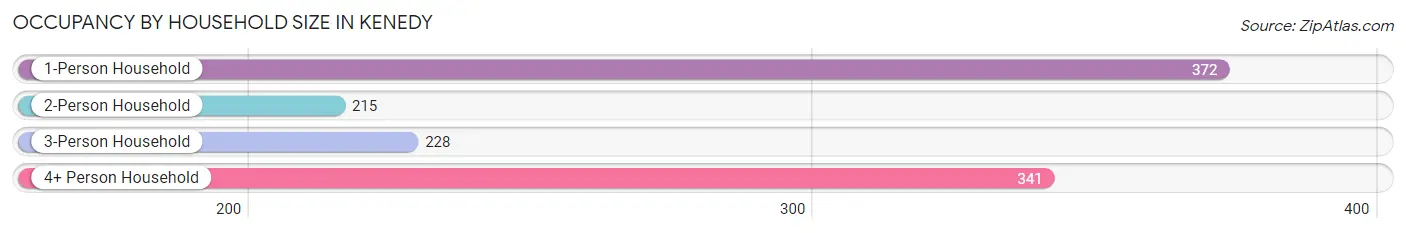
| Household Size | # Housing Units | % Housing Units |
| 1-Person Household | 372 | 32.2% |
| 2-Person Household | 215 | 18.6% |
| 3-Person Household | 228 | 19.7% |
| 4+ Person Household | 341 | 29.5% |
| Total Housing Units | 1,156 | 100.0% |
Occupancy by Ownership by Household Size in Kenedy
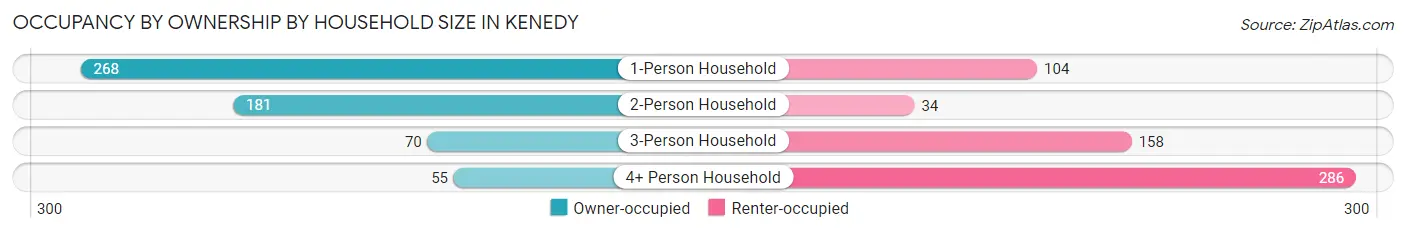
| Household Size | Owner-occupied | Renter-occupied |
| 1-Person Household | 268 (72.0%) | 104 (28.0%) |
| 2-Person Household | 181 (84.2%) | 34 (15.8%) |
| 3-Person Household | 70 (30.7%) | 158 (69.3%) |
| 4+ Person Household | 55 (16.1%) | 286 (83.9%) |
| Total Housing Units | 574 (49.6%) | 582 (50.3%) |
Occupancy by Educational Attainment in Kenedy
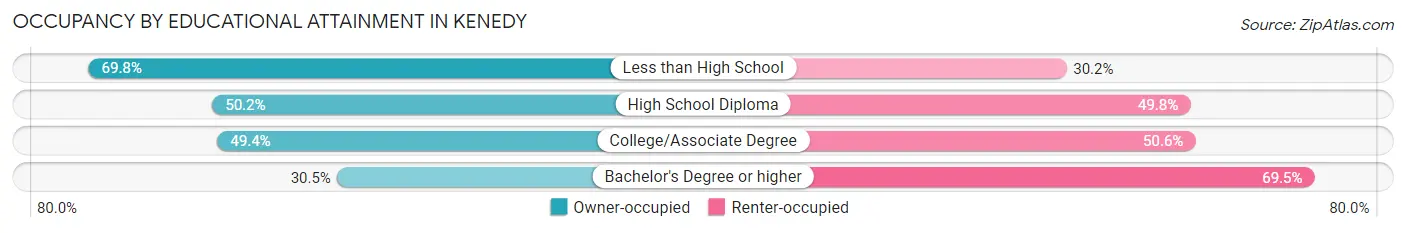
| Household Size | Owner-occupied | Renter-occupied |
| Less than High School | 88 (69.8%) | 38 (30.2%) |
| High School Diploma | 233 (50.2%) | 231 (49.8%) |
| College/Associate Degree | 210 (49.4%) | 215 (50.6%) |
| Bachelor's Degree or higher | 43 (30.5%) | 98 (69.5%) |
Occupancy by Age of Householder in Kenedy
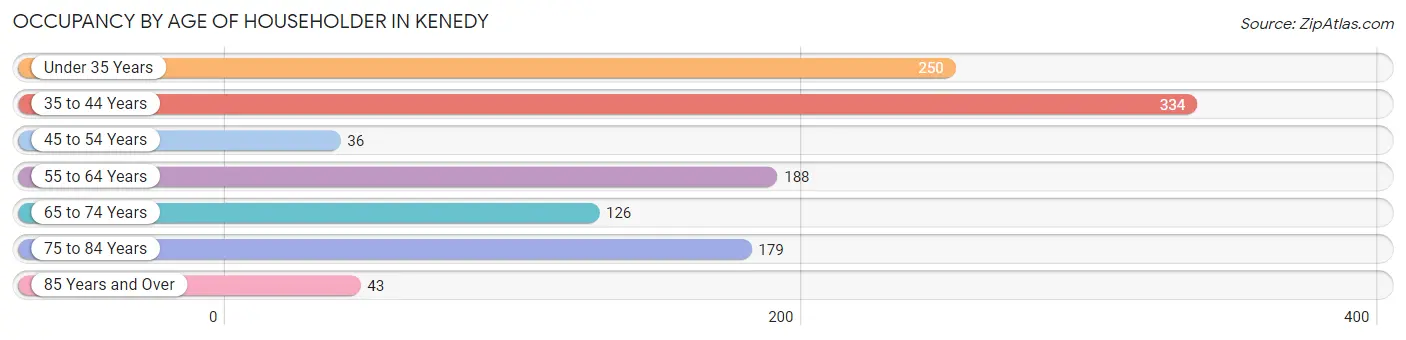
| Age Bracket | # Households | % Households |
| Under 35 Years | 250 | 21.6% |
| 35 to 44 Years | 334 | 28.9% |
| 45 to 54 Years | 36 | 3.1% |
| 55 to 64 Years | 188 | 16.3% |
| 65 to 74 Years | 126 | 10.9% |
| 75 to 84 Years | 179 | 15.5% |
| 85 Years and Over | 43 | 3.7% |
| Total | 1,156 | 100.0% |
Housing Finances in Kenedy
Median Income by Occupancy in Kenedy
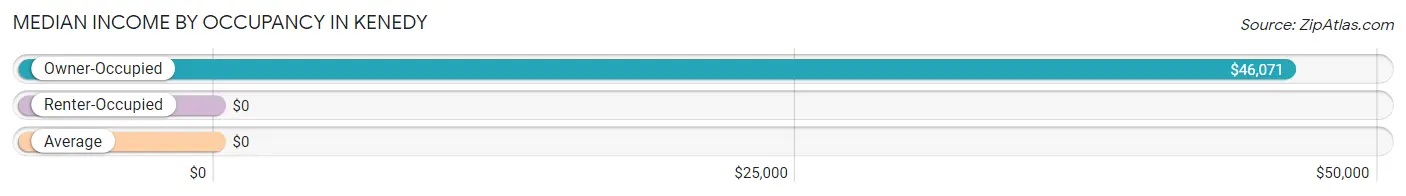
| Occupancy Type | # Households | Median Income |
| Owner-Occupied | 574 (49.6%) | $46,071 |
| Renter-Occupied | 582 (50.3%) | $0 |
| Average | 1,156 (100.0%) | $0 |
Occupancy by Householder Income Bracket in Kenedy
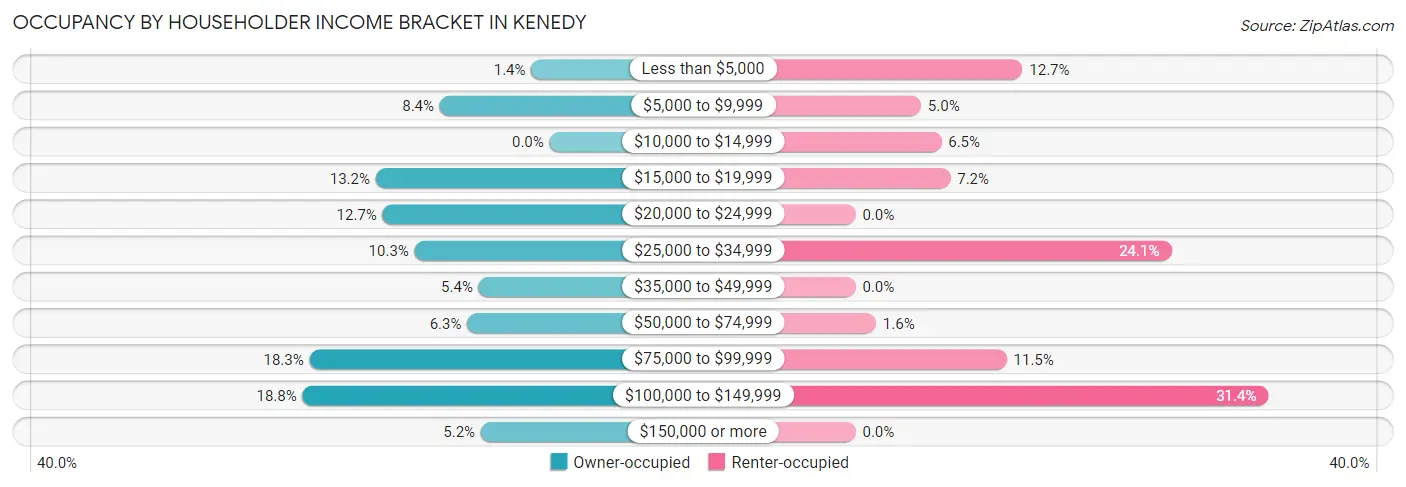
| Income Bracket | Owner-occupied | Renter-occupied |
| Less than $5,000 | 8 (1.4%) | 74 (12.7%) |
| $5,000 to $9,999 | 48 (8.4%) | 29 (5.0%) |
| $10,000 to $14,999 | 0 (0.0%) | 38 (6.5%) |
| $15,000 to $19,999 | 76 (13.2%) | 42 (7.2%) |
| $20,000 to $24,999 | 73 (12.7%) | 0 (0.0%) |
| $25,000 to $34,999 | 59 (10.3%) | 140 (24.0%) |
| $35,000 to $49,999 | 31 (5.4%) | 0 (0.0%) |
| $50,000 to $74,999 | 36 (6.3%) | 9 (1.5%) |
| $75,000 to $99,999 | 105 (18.3%) | 67 (11.5%) |
| $100,000 to $149,999 | 108 (18.8%) | 183 (31.4%) |
| $150,000 or more | 30 (5.2%) | 0 (0.0%) |
| Total | 574 (100.0%) | 582 (100.0%) |
Monthly Housing Cost Tiers in Kenedy
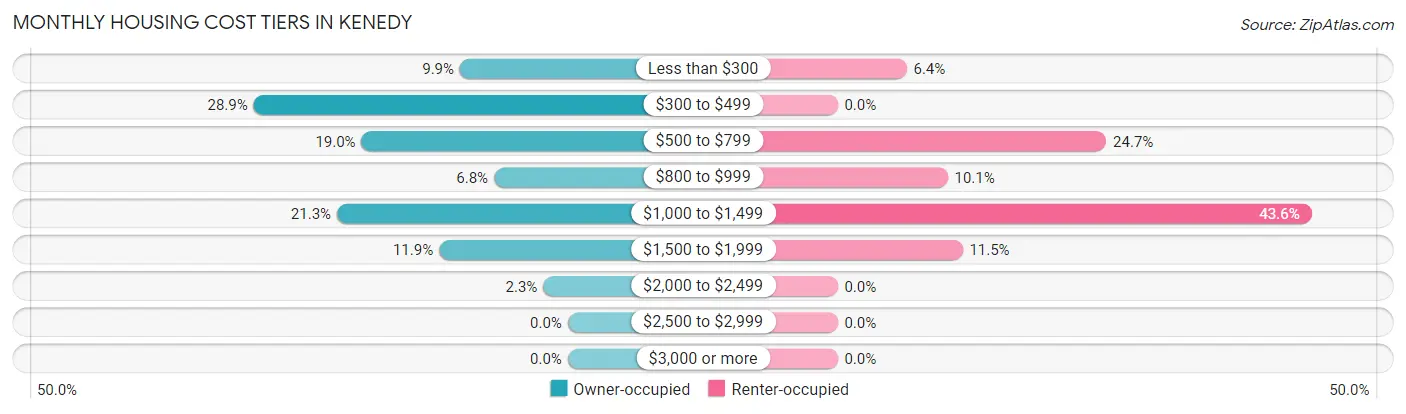
| Monthly Cost | Owner-occupied | Renter-occupied |
| Less than $300 | 57 (9.9%) | 37 (6.4%) |
| $300 to $499 | 166 (28.9%) | 0 (0.0%) |
| $500 to $799 | 109 (19.0%) | 144 (24.7%) |
| $800 to $999 | 39 (6.8%) | 59 (10.1%) |
| $1,000 to $1,499 | 122 (21.2%) | 254 (43.6%) |
| $1,500 to $1,999 | 68 (11.8%) | 67 (11.5%) |
| $2,000 to $2,499 | 13 (2.3%) | 0 (0.0%) |
| $2,500 to $2,999 | 0 (0.0%) | 0 (0.0%) |
| $3,000 or more | 0 (0.0%) | 0 (0.0%) |
| Total | 574 (100.0%) | 582 (100.0%) |
Physical Housing Characteristics in Kenedy
Housing Structures in Kenedy
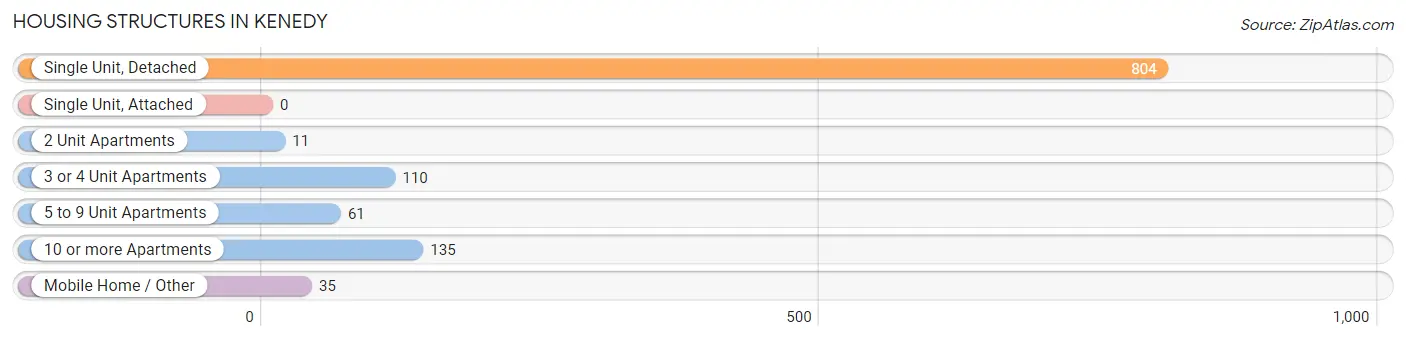
| Structure Type | # Housing Units | % Housing Units |
| Single Unit, Detached | 804 | 69.6% |
| Single Unit, Attached | 0 | 0.0% |
| 2 Unit Apartments | 11 | 0.9% |
| 3 or 4 Unit Apartments | 110 | 9.5% |
| 5 to 9 Unit Apartments | 61 | 5.3% |
| 10 or more Apartments | 135 | 11.7% |
| Mobile Home / Other | 35 | 3.0% |
| Total | 1,156 | 100.0% |
Housing Structures by Occupancy in Kenedy
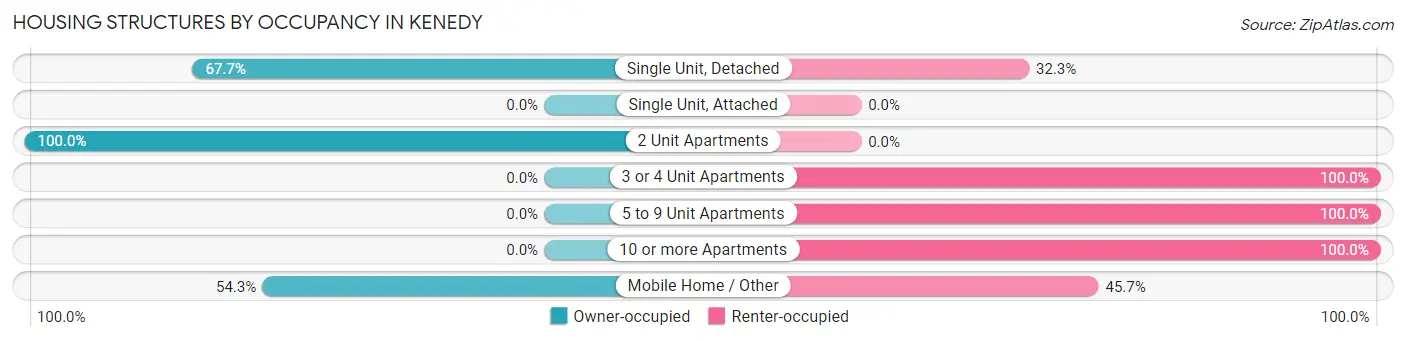
| Structure Type | Owner-occupied | Renter-occupied |
| Single Unit, Detached | 544 (67.7%) | 260 (32.3%) |
| Single Unit, Attached | 0 (0.0%) | 0 (0.0%) |
| 2 Unit Apartments | 11 (100.0%) | 0 (0.0%) |
| 3 or 4 Unit Apartments | 0 (0.0%) | 110 (100.0%) |
| 5 to 9 Unit Apartments | 0 (0.0%) | 61 (100.0%) |
| 10 or more Apartments | 0 (0.0%) | 135 (100.0%) |
| Mobile Home / Other | 19 (54.3%) | 16 (45.7%) |
| Total | 574 (49.6%) | 582 (50.3%) |
Housing Structures by Number of Rooms in Kenedy
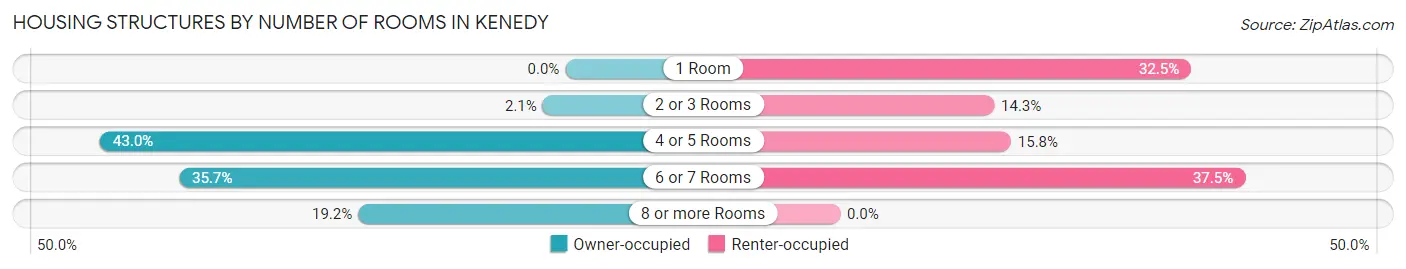
| Number of Rooms | Owner-occupied | Renter-occupied |
| 1 Room | 0 (0.0%) | 189 (32.5%) |
| 2 or 3 Rooms | 12 (2.1%) | 83 (14.3%) |
| 4 or 5 Rooms | 247 (43.0%) | 92 (15.8%) |
| 6 or 7 Rooms | 205 (35.7%) | 218 (37.5%) |
| 8 or more Rooms | 110 (19.2%) | 0 (0.0%) |
| Total | 574 (100.0%) | 582 (100.0%) |
Housing Structure by Heating Type in Kenedy
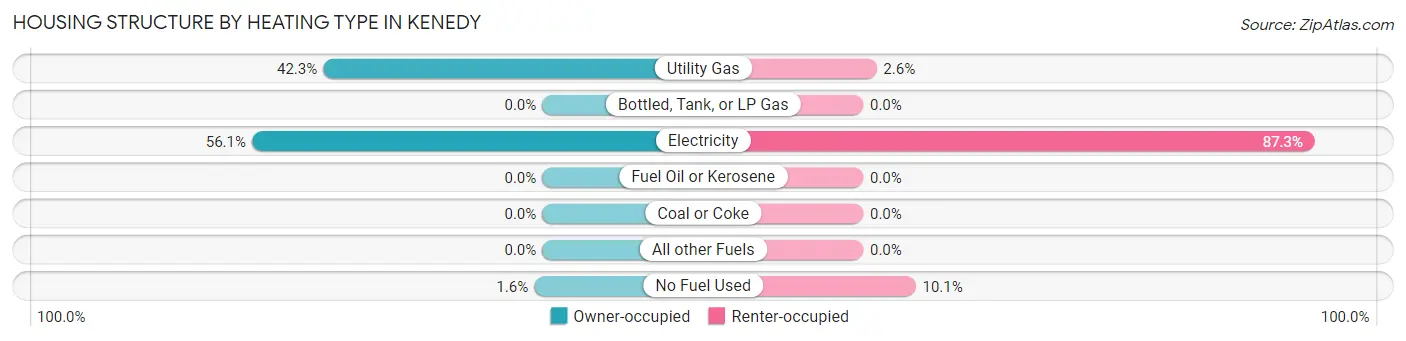
| Heating Type | Owner-occupied | Renter-occupied |
| Utility Gas | 243 (42.3%) | 15 (2.6%) |
| Bottled, Tank, or LP Gas | 0 (0.0%) | 0 (0.0%) |
| Electricity | 322 (56.1%) | 508 (87.3%) |
| Fuel Oil or Kerosene | 0 (0.0%) | 0 (0.0%) |
| Coal or Coke | 0 (0.0%) | 0 (0.0%) |
| All other Fuels | 0 (0.0%) | 0 (0.0%) |
| No Fuel Used | 9 (1.6%) | 59 (10.1%) |
| Total | 574 (100.0%) | 582 (100.0%) |
Household Vehicle Usage in Kenedy
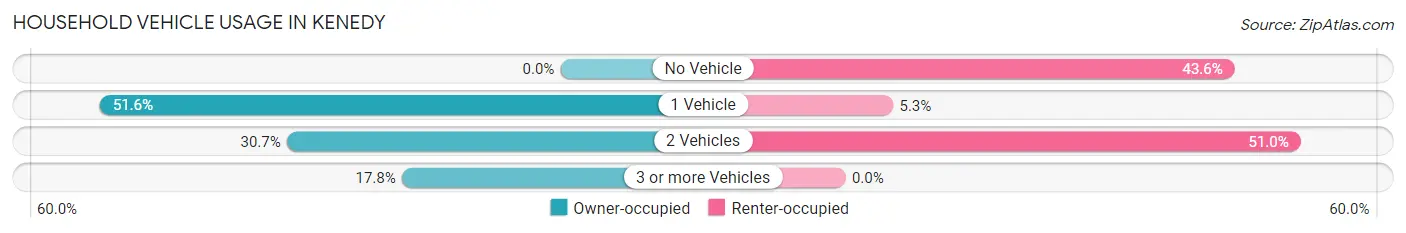
| Vehicles per Household | Owner-occupied | Renter-occupied |
| No Vehicle | 0 (0.0%) | 254 (43.6%) |
| 1 Vehicle | 296 (51.6%) | 31 (5.3%) |
| 2 Vehicles | 176 (30.7%) | 297 (51.0%) |
| 3 or more Vehicles | 102 (17.8%) | 0 (0.0%) |
| Total | 574 (100.0%) | 582 (100.0%) |
Real Estate & Mortgages in Kenedy
Real Estate and Mortgage Overview in Kenedy
| Characteristic | Without Mortgage | With Mortgage |
| Housing Units | 304 | 270 |
| Median Property Value | $88,500 | $140,200 |
| Median Household Income | $27,375 | $13 |
| Monthly Housing Costs | $398 | $0 |
| Real Estate Taxes | $572 | $0 |
Property Value by Mortgage Status in Kenedy
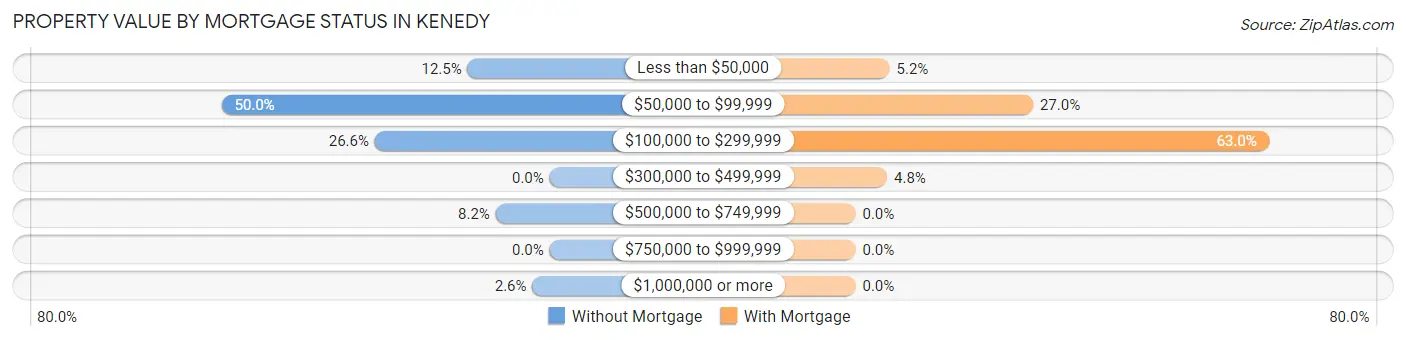
| Property Value | Without Mortgage | With Mortgage |
| Less than $50,000 | 38 (12.5%) | 14 (5.2%) |
| $50,000 to $99,999 | 152 (50.0%) | 73 (27.0%) |
| $100,000 to $299,999 | 81 (26.6%) | 170 (63.0%) |
| $300,000 to $499,999 | 0 (0.0%) | 13 (4.8%) |
| $500,000 to $749,999 | 25 (8.2%) | 0 (0.0%) |
| $750,000 to $999,999 | 0 (0.0%) | 0 (0.0%) |
| $1,000,000 or more | 8 (2.6%) | 0 (0.0%) |
| Total | 304 (100.0%) | 270 (100.0%) |
Household Income by Mortgage Status in Kenedy
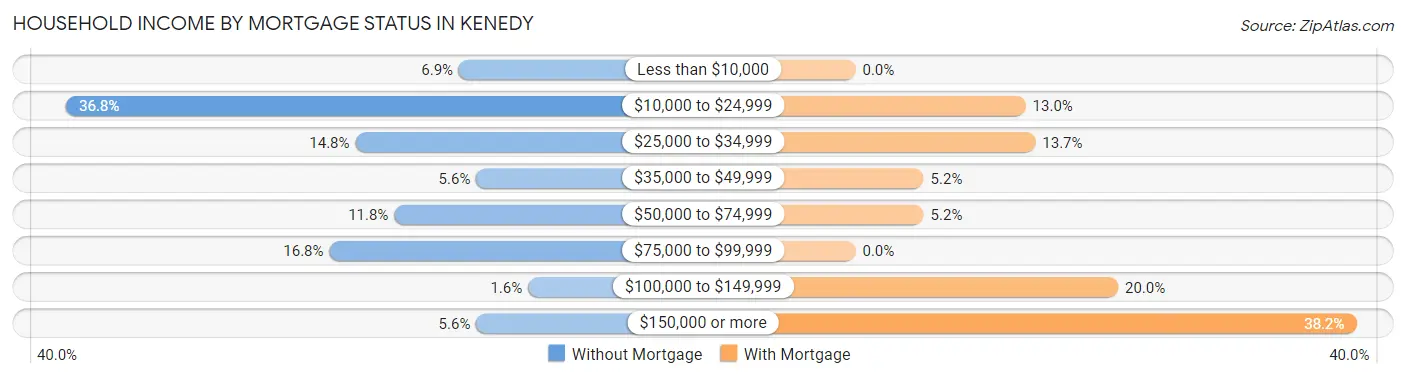
| Household Income | Without Mortgage | With Mortgage |
| Less than $10,000 | 21 (6.9%) | 0 (0.0%) |
| $10,000 to $24,999 | 112 (36.8%) | 35 (13.0%) |
| $25,000 to $34,999 | 45 (14.8%) | 37 (13.7%) |
| $35,000 to $49,999 | 17 (5.6%) | 14 (5.2%) |
| $50,000 to $74,999 | 36 (11.8%) | 14 (5.2%) |
| $75,000 to $99,999 | 51 (16.8%) | 0 (0.0%) |
| $100,000 to $149,999 | 5 (1.6%) | 54 (20.0%) |
| $150,000 or more | 17 (5.6%) | 103 (38.2%) |
| Total | 304 (100.0%) | 270 (100.0%) |
Property Value to Household Income Ratio in Kenedy
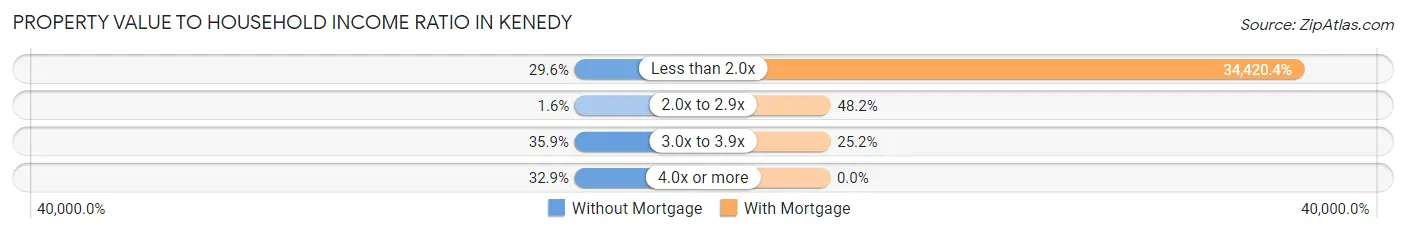
| Value-to-Income Ratio | Without Mortgage | With Mortgage |
| Less than 2.0x | 90 (29.6%) | 92,935 (34,420.4%) |
| 2.0x to 2.9x | 5 (1.6%) | 130 (48.1%) |
| 3.0x to 3.9x | 109 (35.9%) | 68 (25.2%) |
| 4.0x or more | 100 (32.9%) | 0 (0.0%) |
| Total | 304 (100.0%) | 270 (100.0%) |
Real Estate Taxes by Mortgage Status in Kenedy
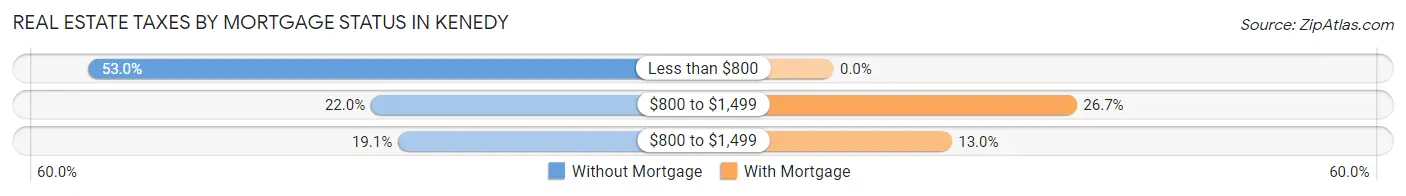
| Property Taxes | Without Mortgage | With Mortgage |
| Less than $800 | 161 (53.0%) | 0 (0.0%) |
| $800 to $1,499 | 67 (22.0%) | 72 (26.7%) |
| $800 to $1,499 | 58 (19.1%) | 35 (13.0%) |
| Total | 304 (100.0%) | 270 (100.0%) |
Health & Disability in Kenedy
Health Insurance Coverage by Age in Kenedy
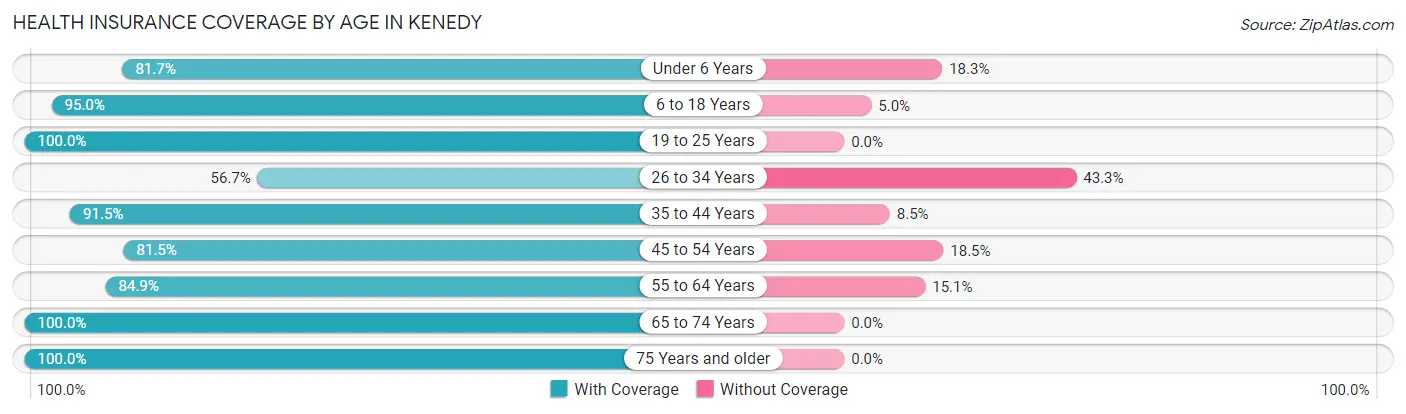
| Age Bracket | With Coverage | Without Coverage |
| Under 6 Years | 358 (81.7%) | 80 (18.3%) |
| 6 to 18 Years | 660 (95.0%) | 35 (5.0%) |
| 19 to 25 Years | 360 (100.0%) | 0 (0.0%) |
| 26 to 34 Years | 177 (56.7%) | 135 (43.3%) |
| 35 to 44 Years | 646 (91.5%) | 60 (8.5%) |
| 45 to 54 Years | 128 (81.5%) | 29 (18.5%) |
| 55 to 64 Years | 236 (84.9%) | 42 (15.1%) |
| 65 to 74 Years | 193 (100.0%) | 0 (0.0%) |
| 75 Years and older | 270 (100.0%) | 0 (0.0%) |
| Total | 3,028 (88.8%) | 381 (11.2%) |
Health Insurance Coverage by Citizenship Status in Kenedy
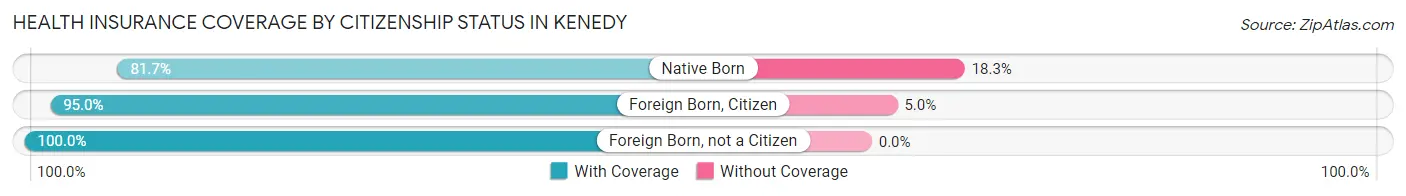
| Citizenship Status | With Coverage | Without Coverage |
| Native Born | 358 (81.7%) | 80 (18.3%) |
| Foreign Born, Citizen | 660 (95.0%) | 35 (5.0%) |
| Foreign Born, not a Citizen | 360 (100.0%) | 0 (0.0%) |
Health Insurance Coverage by Household Income in Kenedy
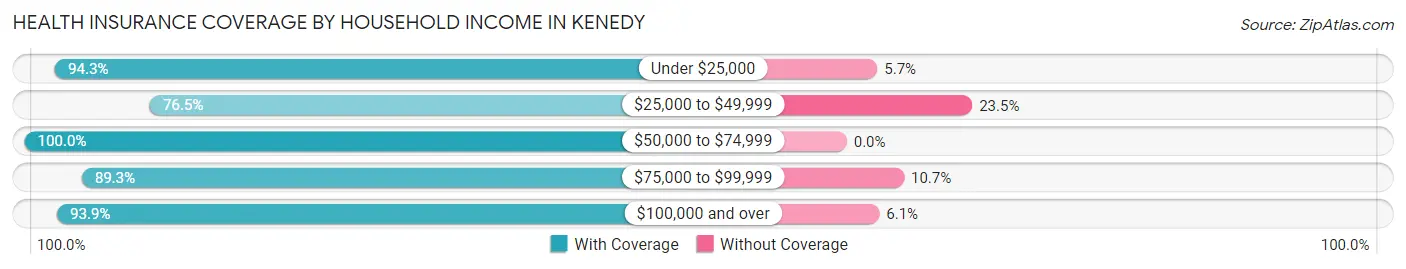
| Household Income | With Coverage | Without Coverage |
| Under $25,000 | 477 (94.3%) | 29 (5.7%) |
| $25,000 to $49,999 | 700 (76.5%) | 215 (23.5%) |
| $50,000 to $74,999 | 81 (100.0%) | 0 (0.0%) |
| $75,000 to $99,999 | 408 (89.3%) | 49 (10.7%) |
| $100,000 and over | 1,354 (93.9%) | 88 (6.1%) |
Public vs Private Health Insurance Coverage by Age in Kenedy
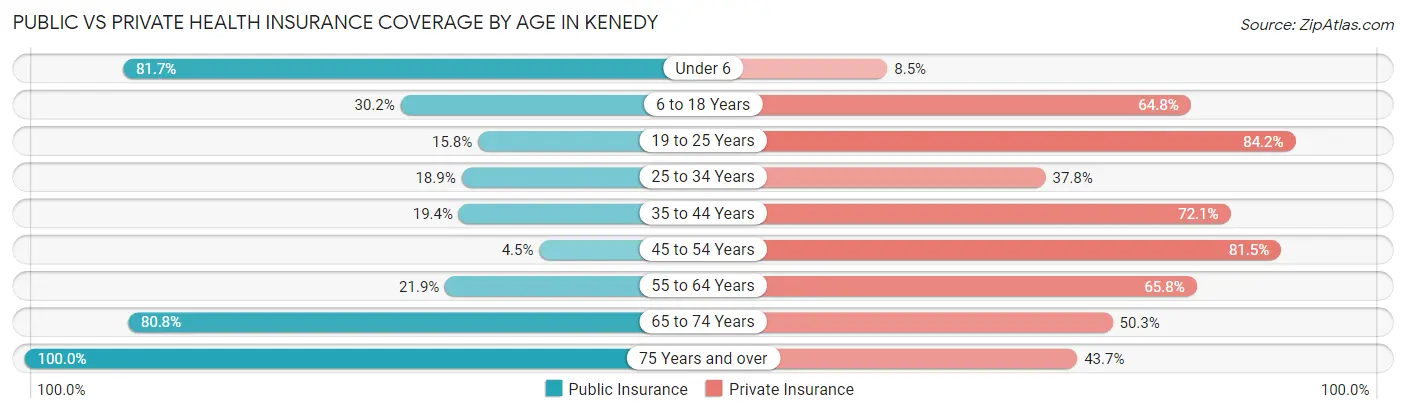
| Age Bracket | Public Insurance | Private Insurance |
| Under 6 | 358 (81.7%) | 37 (8.5%) |
| 6 to 18 Years | 210 (30.2%) | 450 (64.7%) |
| 19 to 25 Years | 57 (15.8%) | 303 (84.2%) |
| 25 to 34 Years | 59 (18.9%) | 118 (37.8%) |
| 35 to 44 Years | 137 (19.4%) | 509 (72.1%) |
| 45 to 54 Years | 7 (4.5%) | 128 (81.5%) |
| 55 to 64 Years | 61 (21.9%) | 183 (65.8%) |
| 65 to 74 Years | 156 (80.8%) | 97 (50.3%) |
| 75 Years and over | 270 (100.0%) | 118 (43.7%) |
| Total | 1,315 (38.6%) | 1,943 (57.0%) |
Disability Status by Sex by Age in Kenedy
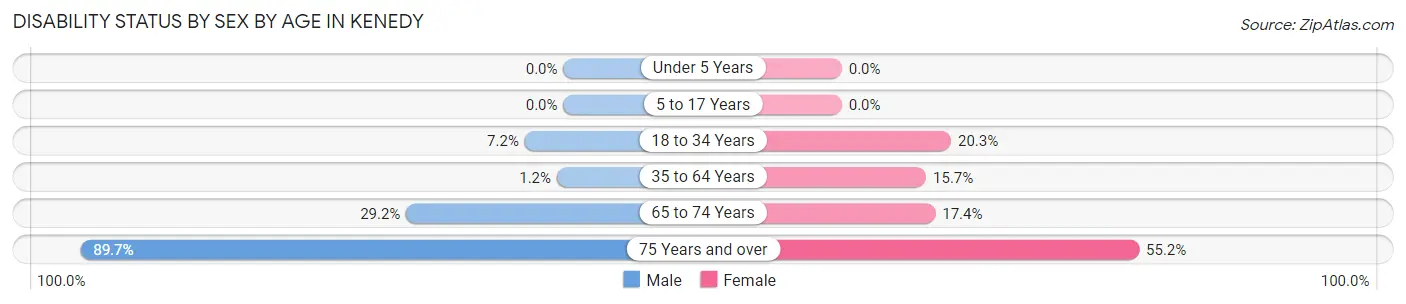
| Age Bracket | Male | Female |
| Under 5 Years | 0 (0.0%) | 0 (0.0%) |
| 5 to 17 Years | 0 (0.0%) | 0 (0.0%) |
| 18 to 34 Years | 23 (7.2%) | 72 (20.3%) |
| 35 to 64 Years | 7 (1.2%) | 87 (15.7%) |
| 65 to 74 Years | 21 (29.2%) | 21 (17.4%) |
| 75 Years and over | 78 (89.7%) | 101 (55.2%) |
Disability Class by Sex by Age in Kenedy
Disability Class: Hearing Difficulty
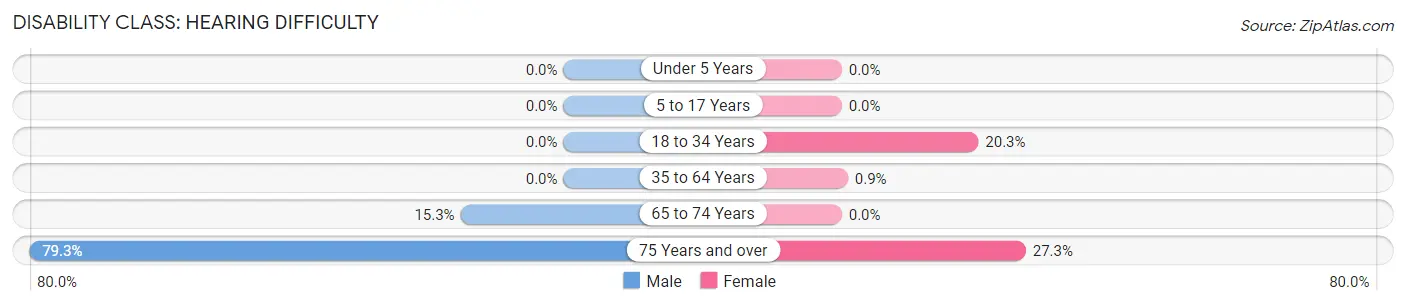
| Age Bracket | Male | Female |
| Under 5 Years | 0 (0.0%) | 0 (0.0%) |
| 5 to 17 Years | 0 (0.0%) | 0 (0.0%) |
| 18 to 34 Years | 0 (0.0%) | 72 (20.3%) |
| 35 to 64 Years | 0 (0.0%) | 5 (0.9%) |
| 65 to 74 Years | 11 (15.3%) | 0 (0.0%) |
| 75 Years and over | 69 (79.3%) | 50 (27.3%) |
Disability Class: Vision Difficulty
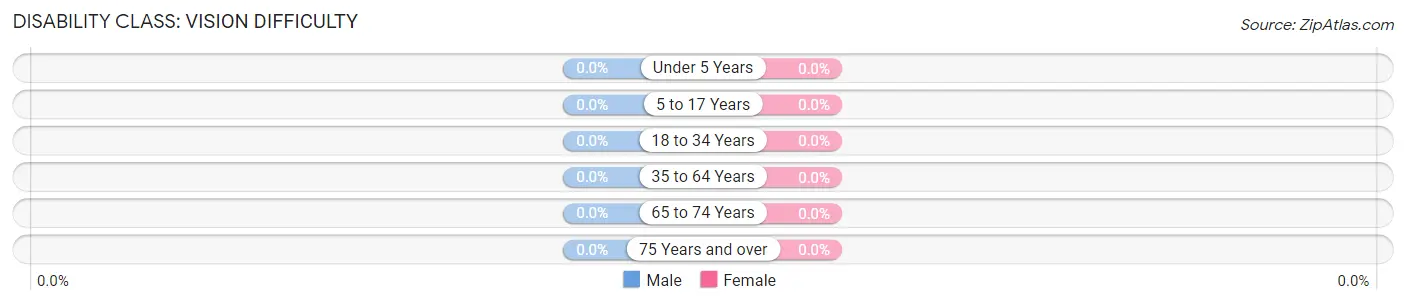
| Age Bracket | Male | Female |
| Under 5 Years | 0 (0.0%) | 0 (0.0%) |
| 5 to 17 Years | 0 (0.0%) | 0 (0.0%) |
| 18 to 34 Years | 0 (0.0%) | 0 (0.0%) |
| 35 to 64 Years | 0 (0.0%) | 0 (0.0%) |
| 65 to 74 Years | 0 (0.0%) | 0 (0.0%) |
| 75 Years and over | 0 (0.0%) | 0 (0.0%) |
Disability Class: Cognitive Difficulty
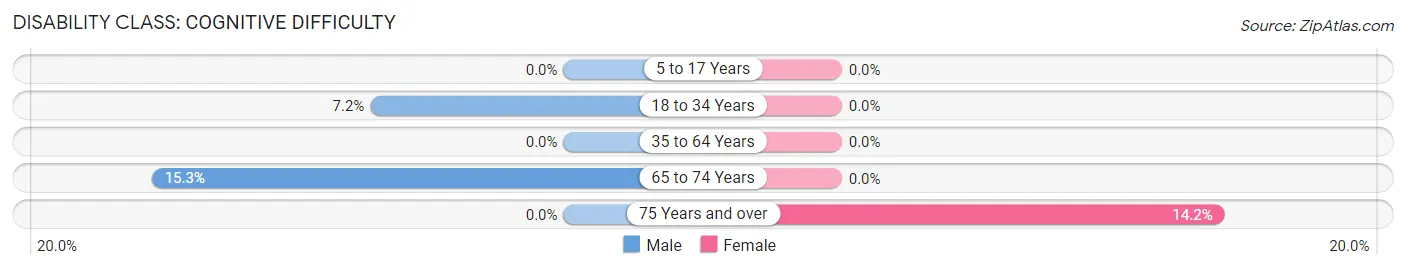
| Age Bracket | Male | Female |
| 5 to 17 Years | 0 (0.0%) | 0 (0.0%) |
| 18 to 34 Years | 23 (7.2%) | 0 (0.0%) |
| 35 to 64 Years | 0 (0.0%) | 0 (0.0%) |
| 65 to 74 Years | 11 (15.3%) | 0 (0.0%) |
| 75 Years and over | 0 (0.0%) | 26 (14.2%) |
Disability Class: Ambulatory Difficulty
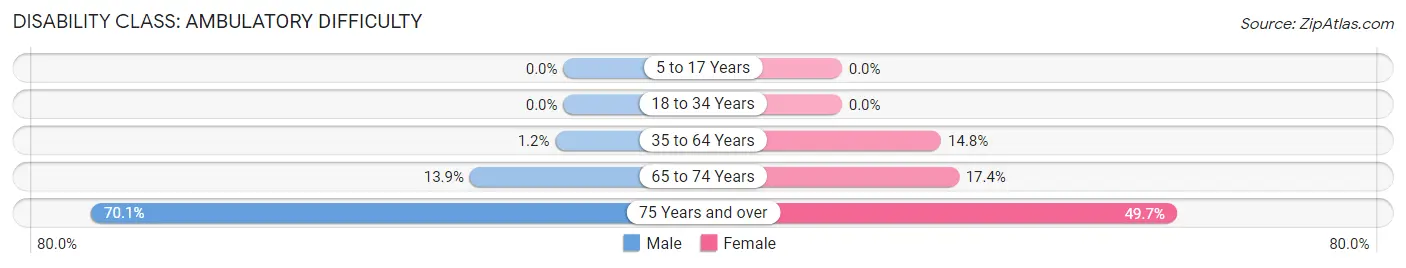
| Age Bracket | Male | Female |
| 5 to 17 Years | 0 (0.0%) | 0 (0.0%) |
| 18 to 34 Years | 0 (0.0%) | 0 (0.0%) |
| 35 to 64 Years | 7 (1.2%) | 82 (14.7%) |
| 65 to 74 Years | 10 (13.9%) | 21 (17.4%) |
| 75 Years and over | 61 (70.1%) | 91 (49.7%) |
Disability Class: Self-Care Difficulty
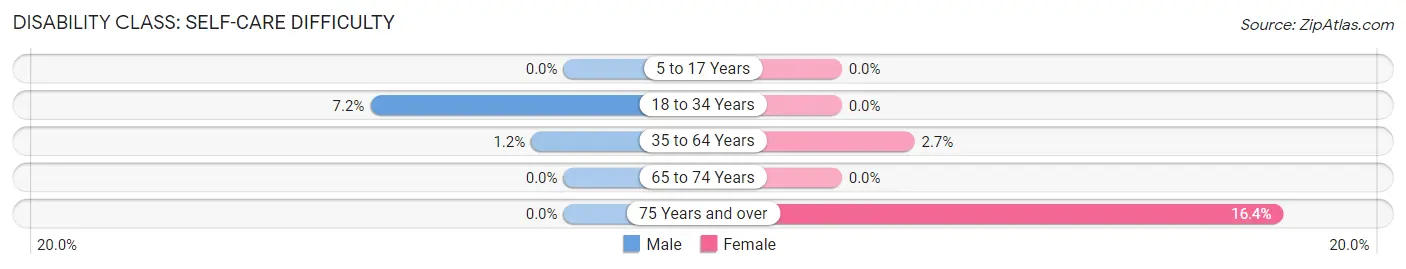
| Age Bracket | Male | Female |
| 5 to 17 Years | 0 (0.0%) | 0 (0.0%) |
| 18 to 34 Years | 23 (7.2%) | 0 (0.0%) |
| 35 to 64 Years | 7 (1.2%) | 15 (2.7%) |
| 65 to 74 Years | 0 (0.0%) | 0 (0.0%) |
| 75 Years and over | 0 (0.0%) | 30 (16.4%) |
Technology Access in Kenedy
Computing Device Access in Kenedy
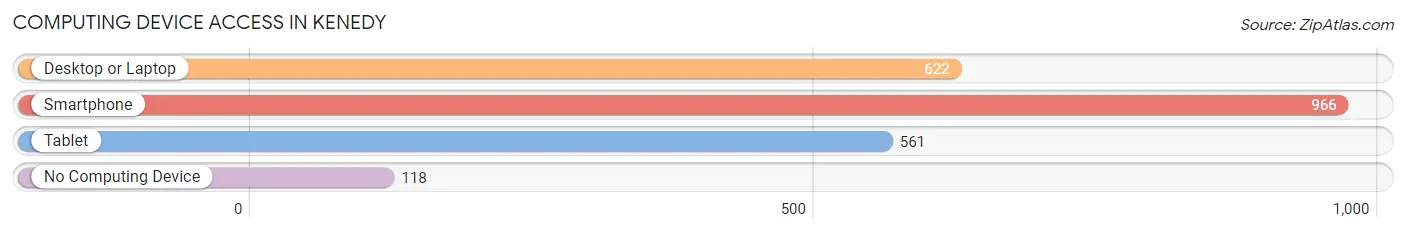
| Device Type | # Households | % Households |
| Desktop or Laptop | 622 | 53.8% |
| Smartphone | 966 | 83.6% |
| Tablet | 561 | 48.5% |
| No Computing Device | 118 | 10.2% |
| Total | 1,156 | 100.0% |
Internet Access in Kenedy
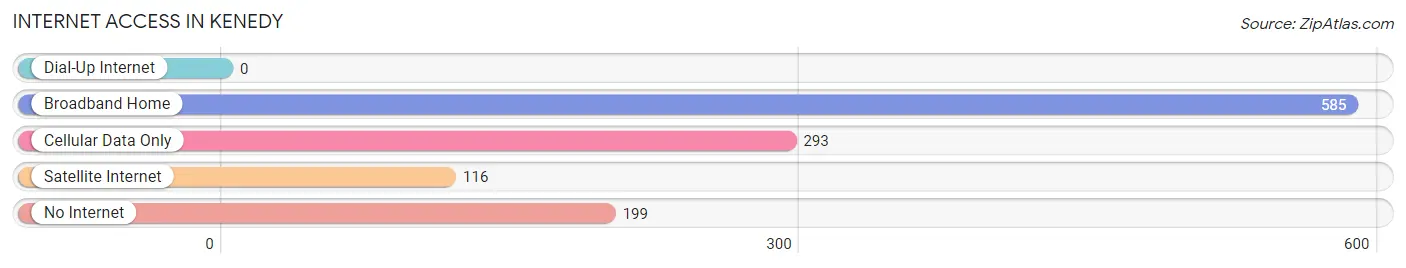
| Internet Type | # Households | % Households |
| Dial-Up Internet | 0 | 0.0% |
| Broadband Home | 585 | 50.6% |
| Cellular Data Only | 293 | 25.4% |
| Satellite Internet | 116 | 10.0% |
| No Internet | 199 | 17.2% |
| Total | 1,156 | 100.0% |
Kenedy Summary
Kenedy, Texas is a small town located in Karnes County, Texas. It is situated about 50 miles southeast of San Antonio and is part of the San Antonio–New Braunfels Metropolitan Statistical Area. The town was founded in 1883 and named after Mifflin Kenedy, a prominent rancher and steamboat operator in the area. The population of Kenedy was 2,931 at the 2010 census.
History
Kenedy was founded in 1883 by Mifflin Kenedy, a prominent rancher and steamboat operator in the area. Kenedy was the first town in Karnes County and was named after him. The town was originally located on the San Antonio and Aransas Pass Railway, which was built in 1887. The town was moved to its current location in 1891 when the railroad was extended.
Kenedy was a major shipping point for cattle and other livestock in the late 19th and early 20th centuries. The town was also home to several cotton gins and other businesses. In the 1920s, Kenedy was the site of a major oil boom, which brought many new residents to the area.
Geography
Kenedy is located in Karnes County, Texas, about 50 miles southeast of San Antonio. The town is situated at the intersection of U.S. Highway 181 and State Highway 72. The town is located on the San Antonio River, which flows through the area.
The climate in Kenedy is hot and humid in the summer and mild in the winter. The average temperature in July is 93°F and the average temperature in January is 57°F. The average annual precipitation is 28.5 inches.
Economy
Kenedy’s economy is largely based on agriculture and oil and gas production. The town is home to several cotton gins, feed mills, and other agricultural businesses. The town is also home to several oil and gas production companies.
Kenedy is also home to several retail businesses, including a grocery store, a hardware store, and a few restaurants. The town is also home to a few small manufacturing companies.
Demographics
As of the 2010 census, the population of Kenedy was 2,931. The racial makeup of the town was 79.3% White, 0.7% African American, 0.3% Native American, 0.2% Asian, 0.1% Pacific Islander, 17.7% from other races, and 1.9% from two or more races. Hispanic or Latino of any race were 44.2% of the population.
The median income for a household in Kenedy was $30,938, and the median income for a family was $35,938. The per capita income for the town was $14,938. About 20.2% of families and 24.2% of the population were below the poverty line, including 33.3% of those under age 18 and 16.2% of those age 65 or over.
Common Questions
What is Per Capita Income in Kenedy?
Per Capita income in Kenedy is $22,374.
What is the Median Family Income in Kenedy?
Median Family Income in Kenedy is $77,625.
What is Income or Wage Gap in Kenedy?
Income or Wage Gap in Kenedy is 13.0%.
Women in Kenedy earn 87.0 cents for every dollar earned by a man.
What is Family Income Deficit in Kenedy?
Family Income Deficit in Kenedy is $26,864.
Families that are below poverty line in Kenedy earn $26,864 less on average than the poverty threshold level.
What is Inequality or Gini Index in Kenedy?
Inequality or Gini Index in Kenedy is 0.47.
What is the Total Population of Kenedy?
Total Population of Kenedy is 3,467.
What is the Total Male Population of Kenedy?
Total Male Population of Kenedy is 1,570.
What is the Total Female Population of Kenedy?
Total Female Population of Kenedy is 1,897.
What is the Ratio of Males per 100 Females in Kenedy?
There are 82.76 Males per 100 Females in Kenedy.
What is the Ratio of Females per 100 Males in Kenedy?
There are 120.83 Females per 100 Males in Kenedy.
What is the Median Population Age in Kenedy?
Median Population Age in Kenedy is 32.6 Years.
What is the Average Family Size in Kenedy
Average Family Size in Kenedy is 3.4 People.
What is the Average Household Size in Kenedy
Average Household Size in Kenedy is 2.9 People.
How Large is the Labor Force in Kenedy?
There are 1,603 People in the Labor Forcein in Kenedy.
What is the Percentage of People in the Labor Force in Kenedy?
68.1% of People are in the Labor Force in Kenedy.
What is the Unemployment Rate in Kenedy?
Unemployment Rate in Kenedy is 9.2%.