Joaquin, TX Map & Demographics
Joaquin Map
Joaquin Overview
$19,203
PER CAPITA INCOME
$35,703
AVG FAMILY INCOME
$30,250
AVG HOUSEHOLD INCOME
15.3%
WAGE / INCOME GAP [ % ]
84.7¢/ $1
WAGE / INCOME GAP [ $ ]
0.45
INEQUALITY / GINI INDEX
794
TOTAL POPULATION
466
MALE POPULATION
328
FEMALE POPULATION
142.07
MALES / 100 FEMALES
70.39
FEMALES / 100 MALES
46.1
MEDIAN AGE
3.0
AVG FAMILY SIZE
2.7
AVG HOUSEHOLD SIZE
357
LABOR FORCE [ PEOPLE ]
53.4%
PERCENT IN LABOR FORCE
3.9%
UNEMPLOYMENT RATE
Joaquin Zip Codes
Income in Joaquin
Income Overview in Joaquin
Per Capita Income in Joaquin is $19,203, while median incomes of families and households are $35,703 and $30,250 respectively.
| Characteristic | Number | Measure |
| Per Capita Income | 794 | $19,203 |
| Median Family Income | 245 | $35,703 |
| Mean Family Income | 245 | $49,372 |
| Median Household Income | 299 | $30,250 |
| Mean Household Income | 299 | $44,429 |
| Income Deficit | 245 | $0 |
| Wage / Income Gap (%) | 794 | 15.33% |
| Wage / Income Gap ($) | 794 | 84.67¢ per $1 |
| Gini / Inequality Index | 794 | 0.45 |
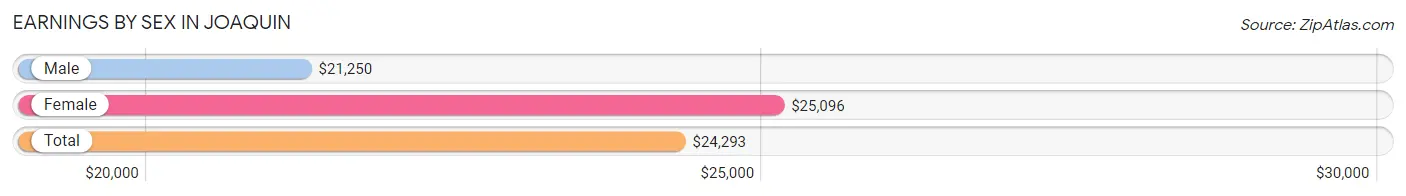
Earnings by Sex in Joaquin
Average Earnings in Joaquin are $24,293, $21,250 for men and $25,096 for women, a difference of 15.3%.
| Sex | Number | Average Earnings |
| Male | 230 (60.7%) | $21,250 |
| Female | 149 (39.3%) | $25,096 |
| Total | 379 (100.0%) | $24,293 |
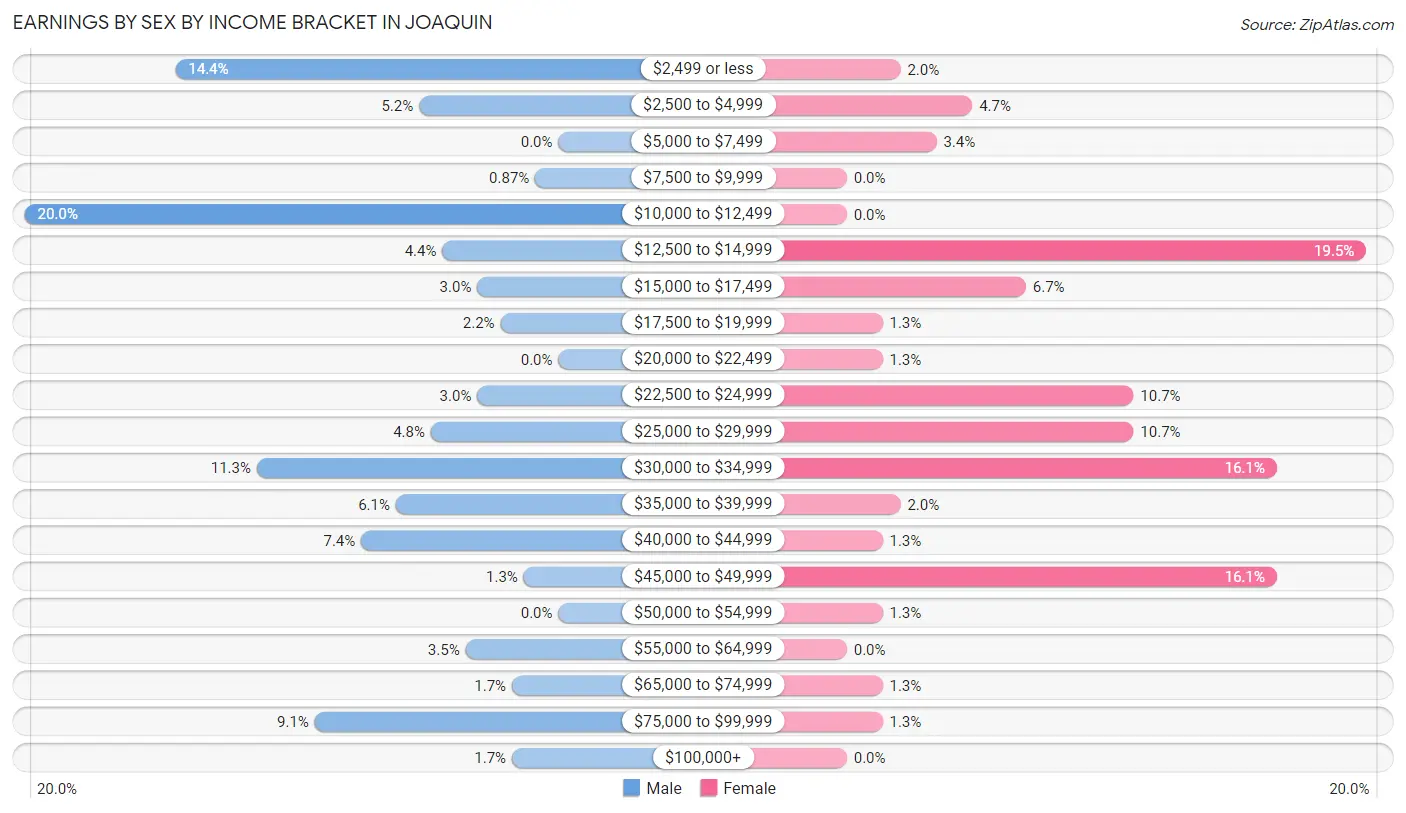
Earnings by Sex by Income Bracket in Joaquin
The most common earnings brackets in Joaquin are $10,000 to $12,499 for men (46 | 20.0%) and $12,500 to $14,999 for women (29 | 19.5%).
| Income | Male | Female |
| $2,499 or less | 33 (14.3%) | 3 (2.0%) |
| $2,500 to $4,999 | 12 (5.2%) | 7 (4.7%) |
| $5,000 to $7,499 | 0 (0.0%) | 5 (3.4%) |
| $7,500 to $9,999 | 2 (0.9%) | 0 (0.0%) |
| $10,000 to $12,499 | 46 (20.0%) | 0 (0.0%) |
| $12,500 to $14,999 | 10 (4.3%) | 29 (19.5%) |
| $15,000 to $17,499 | 7 (3.0%) | 10 (6.7%) |
| $17,500 to $19,999 | 5 (2.2%) | 2 (1.3%) |
| $20,000 to $22,499 | 0 (0.0%) | 2 (1.3%) |
| $22,500 to $24,999 | 7 (3.0%) | 16 (10.7%) |
| $25,000 to $29,999 | 11 (4.8%) | 16 (10.7%) |
| $30,000 to $34,999 | 26 (11.3%) | 24 (16.1%) |
| $35,000 to $39,999 | 14 (6.1%) | 3 (2.0%) |
| $40,000 to $44,999 | 17 (7.4%) | 2 (1.3%) |
| $45,000 to $49,999 | 3 (1.3%) | 24 (16.1%) |
| $50,000 to $54,999 | 0 (0.0%) | 2 (1.3%) |
| $55,000 to $64,999 | 8 (3.5%) | 0 (0.0%) |
| $65,000 to $74,999 | 4 (1.7%) | 2 (1.3%) |
| $75,000 to $99,999 | 21 (9.1%) | 2 (1.3%) |
| $100,000+ | 4 (1.7%) | 0 (0.0%) |
| Total | 230 (100.0%) | 149 (100.0%) |
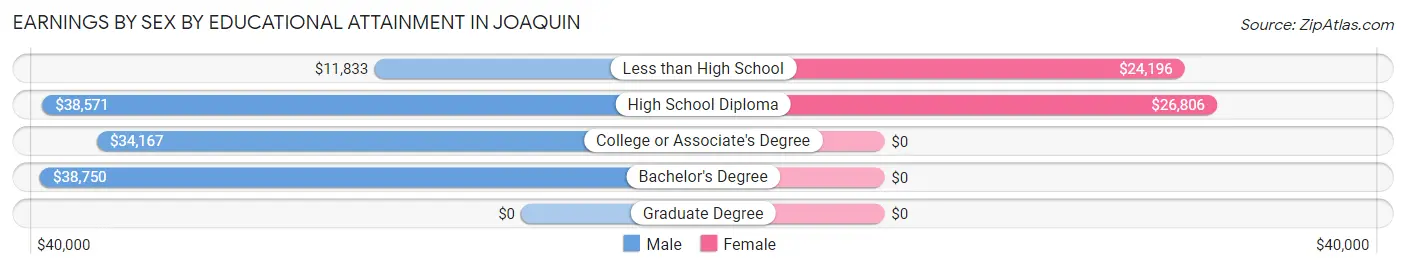
Earnings by Sex by Educational Attainment in Joaquin
Average earnings in Joaquin are $25,500 for men and $25,114 for women, a difference of 1.5%. Men with an educational attainment of bachelor's degree enjoy the highest average annual earnings of $38,750, while those with less than high school education earn the least with $11,833. Women with an educational attainment of high school diploma earn the most with the average annual earnings of $26,806, while those with less than high school education have the smallest earnings of $24,196.
| Educational Attainment | Male Income | Female Income |
| Less than High School | $11,833 | $24,196 |
| High School Diploma | $38,571 | $26,806 |
| College or Associate's Degree | $34,167 | $0 |
| Bachelor's Degree | $38,750 | $0 |
| Graduate Degree | - | - |
| Total | $25,500 | $25,114 |
Family Income in Joaquin
Family Income Brackets in Joaquin
According to the Joaquin family income data, there are 51 families falling into the $25,000 to $34,999 income range, which is the most common income bracket and makes up 20.8% of all families.
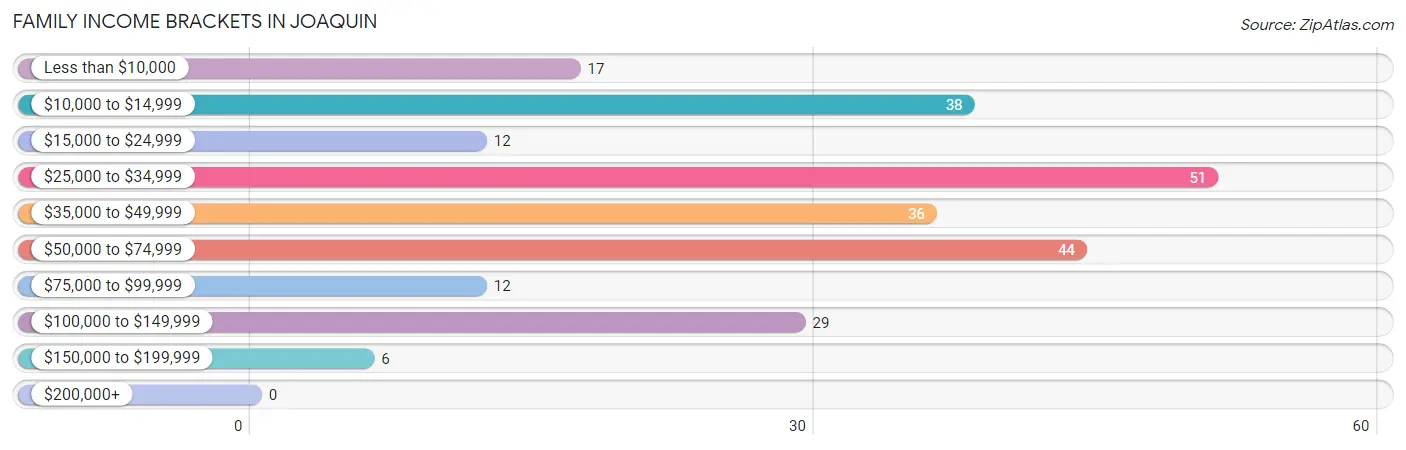
| Income Bracket | # Families | % Families |
| Less than $10,000 | 17 | 6.9% |
| $10,000 to $14,999 | 38 | 15.5% |
| $15,000 to $24,999 | 12 | 4.9% |
| $25,000 to $34,999 | 51 | 20.8% |
| $35,000 to $49,999 | 36 | 14.7% |
| $50,000 to $74,999 | 44 | 18.0% |
| $75,000 to $99,999 | 12 | 4.9% |
| $100,000 to $149,999 | 29 | 11.8% |
| $150,000 to $199,999 | 6 | 2.4% |
| $200,000+ | 0 | 0.0% |
Family Income by Famaliy Size in Joaquin
7+ person families (10 | 4.1%) account for the highest median family income in Joaquin with $108,611 per family, while 2-person families (160 | 65.3%) have the highest median income of $16,875 per family member.
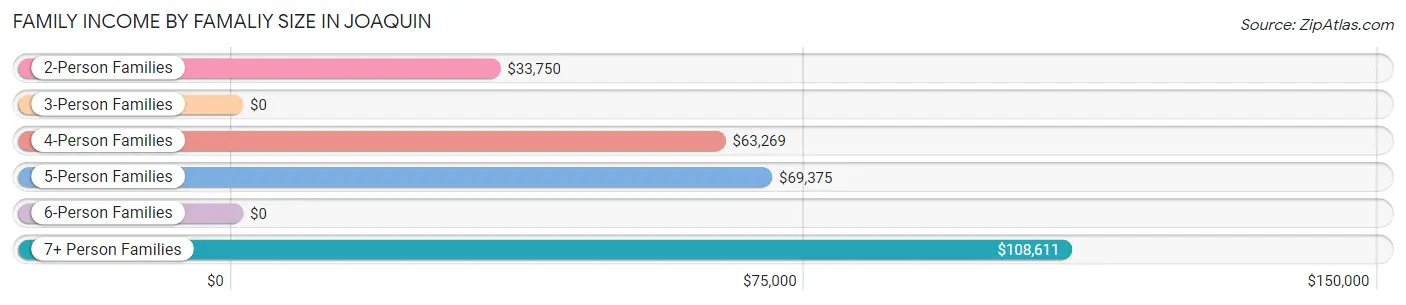
| Income Bracket | # Families | Median Income |
| 2-Person Families | 160 (65.3%) | $33,750 |
| 3-Person Families | 32 (13.1%) | $0 |
| 4-Person Families | 38 (15.5%) | $63,269 |
| 5-Person Families | 5 (2.0%) | $69,375 |
| 6-Person Families | 0 (0.0%) | $0 |
| 7+ Person Families | 10 (4.1%) | $108,611 |
| Total | 245 (100.0%) | $35,703 |
Family Income by Number of Earners in Joaquin
The median family income in Joaquin is $35,703, with families comprising 3+ earners (14) having the highest median family income of $108,214, while families with no earners (58) have the lowest median family income of $27,879, accounting for 5.7% and 23.7% of families, respectively.
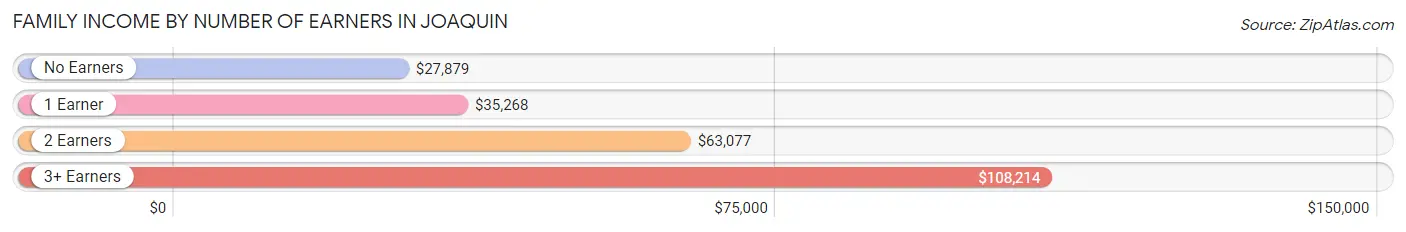
| Number of Earners | # Families | Median Income |
| No Earners | 58 (23.7%) | $27,879 |
| 1 Earner | 87 (35.5%) | $35,268 |
| 2 Earners | 86 (35.1%) | $63,077 |
| 3+ Earners | 14 (5.7%) | $108,214 |
| Total | 245 (100.0%) | $35,703 |
Household Income in Joaquin
Household Income Brackets in Joaquin
With 61 households falling in the category, the $25,000 to $34,999 income range is the most frequent in Joaquin, accounting for 20.4% of all households.
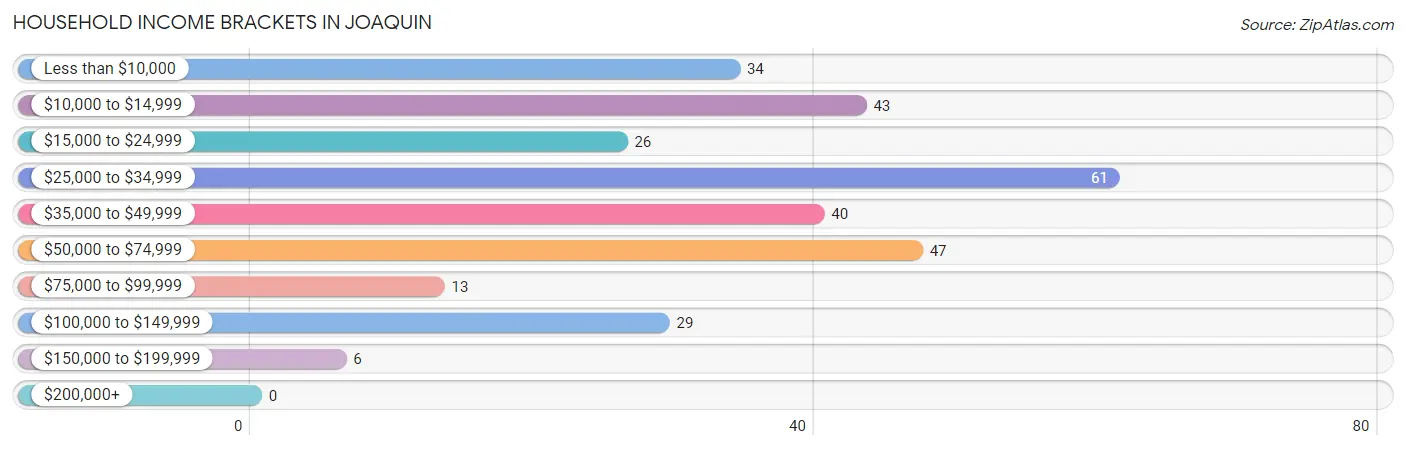
| Income Bracket | # Households | % Households |
| Less than $10,000 | 34 | 11.4% |
| $10,000 to $14,999 | 43 | 14.4% |
| $15,000 to $24,999 | 26 | 8.7% |
| $25,000 to $34,999 | 61 | 20.4% |
| $35,000 to $49,999 | 40 | 13.4% |
| $50,000 to $74,999 | 47 | 15.7% |
| $75,000 to $99,999 | 13 | 4.3% |
| $100,000 to $149,999 | 29 | 9.7% |
| $150,000 to $199,999 | 6 | 2.0% |
| $200,000+ | 0 | 0.0% |
Household Income by Householder Age in Joaquin
The median household income in Joaquin is $30,250, with the highest median household income of $36,875 found in the 45 to 64 years age bracket for the primary householder. A total of 133 households (44.5%) fall into this category. Meanwhile, the 15 to 24 years age bracket for the primary householder has the lowest median household income of $0, with 8 households (2.7%) in this group.
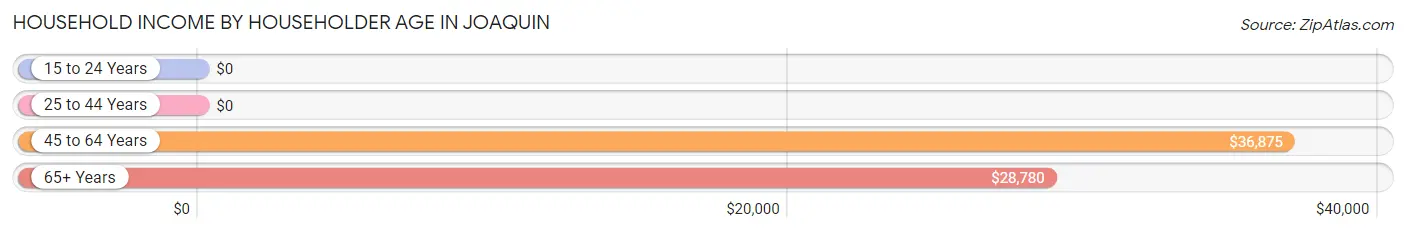
| Income Bracket | # Households | Median Income |
| 15 to 24 Years | 8 (2.7%) | $0 |
| 25 to 44 Years | 40 (13.4%) | $0 |
| 45 to 64 Years | 133 (44.5%) | $36,875 |
| 65+ Years | 118 (39.5%) | $28,780 |
| Total | 299 (100.0%) | $30,250 |
Poverty in Joaquin
Income Below Poverty by Sex and Age in Joaquin
With 29.2% poverty level for males and 27.1% for females among the residents of Joaquin, 5 year old males and 5 year old females are the most vulnerable to poverty, with 4 males (100.0%) and 5 females (100.0%) in their respective age groups living below the poverty level.
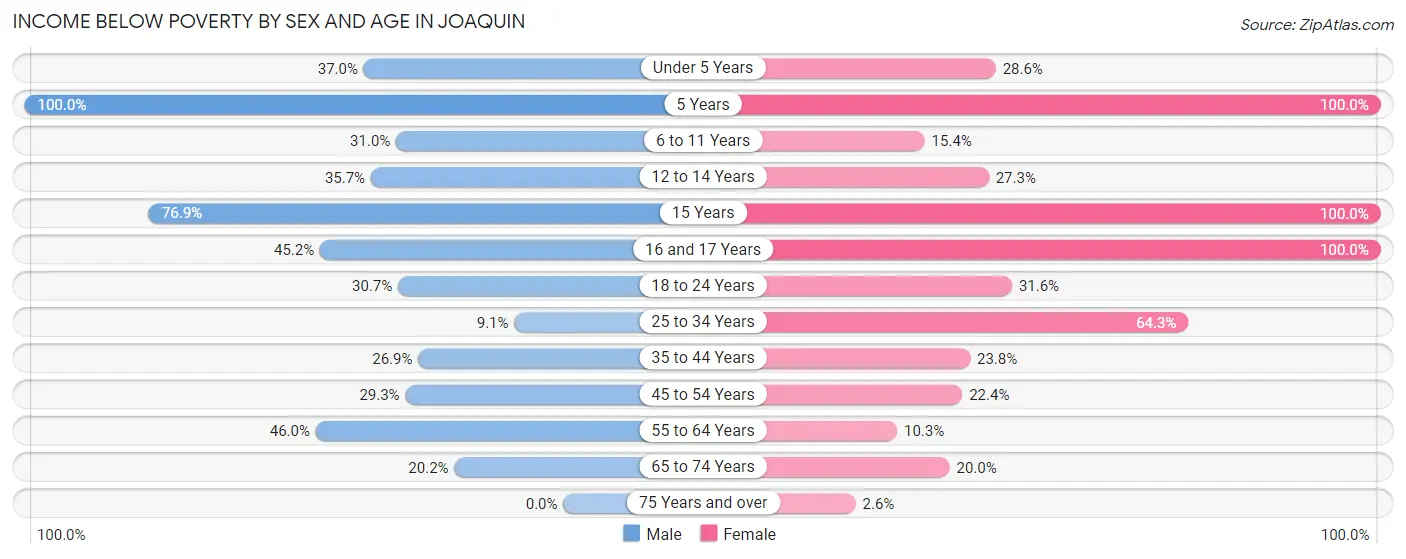
| Age Bracket | Male | Female |
| Under 5 Years | 10 (37.0%) | 2 (28.6%) |
| 5 Years | 4 (100.0%) | 5 (100.0%) |
| 6 to 11 Years | 9 (31.0%) | 2 (15.4%) |
| 12 to 14 Years | 5 (35.7%) | 3 (27.3%) |
| 15 Years | 10 (76.9%) | 2 (100.0%) |
| 16 and 17 Years | 14 (45.2%) | 4 (100.0%) |
| 18 to 24 Years | 23 (30.7%) | 6 (31.6%) |
| 25 to 34 Years | 2 (9.1%) | 27 (64.3%) |
| 35 to 44 Years | 7 (26.9%) | 10 (23.8%) |
| 45 to 54 Years | 17 (29.3%) | 19 (22.4%) |
| 55 to 64 Years | 17 (46.0%) | 4 (10.3%) |
| 65 to 74 Years | 18 (20.2%) | 4 (20.0%) |
| 75 Years and over | 0 (0.0%) | 1 (2.6%) |
| Total | 136 (29.2%) | 89 (27.1%) |
Income Above Poverty by Sex and Age in Joaquin
According to the poverty statistics in Joaquin, males aged 75 years and over and females aged 75 years and over are the age groups that are most secure financially, with 100.0% of males and 97.4% of females in these age groups living above the poverty line.
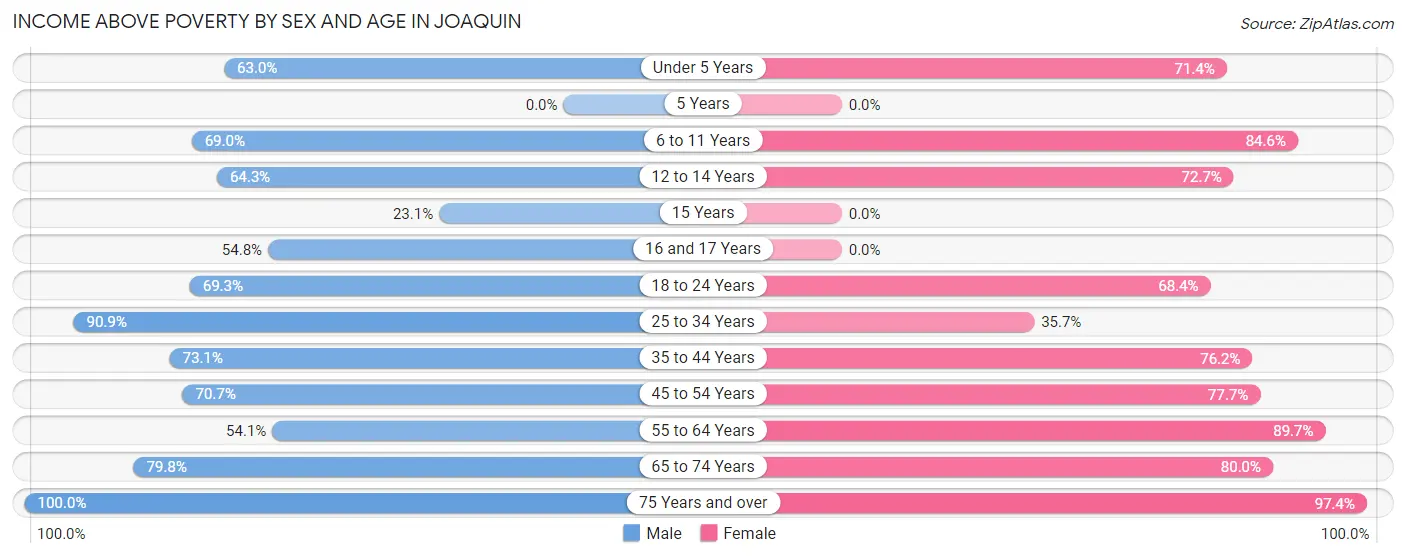
| Age Bracket | Male | Female |
| Under 5 Years | 17 (63.0%) | 5 (71.4%) |
| 5 Years | 0 (0.0%) | 0 (0.0%) |
| 6 to 11 Years | 20 (69.0%) | 11 (84.6%) |
| 12 to 14 Years | 9 (64.3%) | 8 (72.7%) |
| 15 Years | 3 (23.1%) | 0 (0.0%) |
| 16 and 17 Years | 17 (54.8%) | 0 (0.0%) |
| 18 to 24 Years | 52 (69.3%) | 13 (68.4%) |
| 25 to 34 Years | 20 (90.9%) | 15 (35.7%) |
| 35 to 44 Years | 19 (73.1%) | 32 (76.2%) |
| 45 to 54 Years | 41 (70.7%) | 66 (77.6%) |
| 55 to 64 Years | 20 (54.0%) | 35 (89.7%) |
| 65 to 74 Years | 71 (79.8%) | 16 (80.0%) |
| 75 Years and over | 41 (100.0%) | 38 (97.4%) |
| Total | 330 (70.8%) | 239 (72.9%) |
Income Below Poverty Among Married-Couple Families in Joaquin
The poverty statistics for married-couple families in Joaquin show that 12.6% or 18 of the total 143 families live below the poverty line. Families with 3 or 4 children have the highest poverty rate of 100.0%, comprising of 2 families. On the other hand, families with 5 or more children have the lowest poverty rate of 0.0%, which includes 0 families.
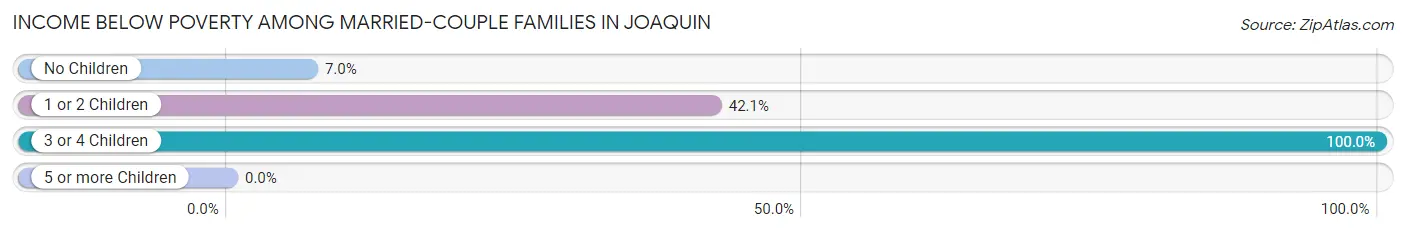
| Children | Above Poverty | Below Poverty |
| No Children | 107 (93.0%) | 8 (7.0%) |
| 1 or 2 Children | 11 (57.9%) | 8 (42.1%) |
| 3 or 4 Children | 0 (0.0%) | 2 (100.0%) |
| 5 or more Children | 7 (100.0%) | 0 (0.0%) |
| Total | 125 (87.4%) | 18 (12.6%) |
Income Below Poverty Among Single-Parent Households in Joaquin
According to the poverty data in Joaquin, 37.2% or 19 single-father households and 52.9% or 27 single-mother households are living below the poverty line. Among single-father households, those with no children have the highest poverty rate, with 17 households (41.5%) experiencing poverty. Likewise, among single-mother households, those with 3 or 4 children have the highest poverty rate, with 2 households (100.0%) falling below the poverty line.
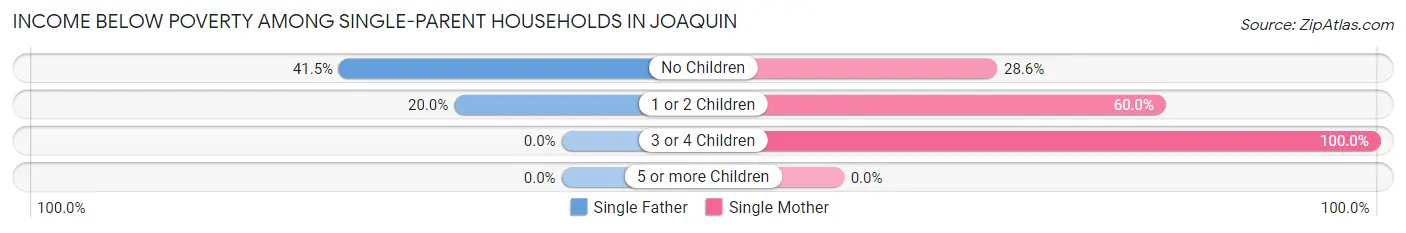
| Children | Single Father | Single Mother |
| No Children | 17 (41.5%) | 4 (28.6%) |
| 1 or 2 Children | 2 (20.0%) | 21 (60.0%) |
| 3 or 4 Children | 0 (0.0%) | 2 (100.0%) |
| 5 or more Children | 0 (0.0%) | 0 (0.0%) |
| Total | 19 (37.2%) | 27 (52.9%) |
Income Below Poverty Among Married-Couple vs Single-Parent Households in Joaquin
The poverty data for Joaquin shows that 18 of the married-couple family households (12.6%) and 46 of the single-parent households (45.1%) are living below the poverty level. Within the married-couple family households, those with 3 or 4 children have the highest poverty rate, with 2 households (100.0%) falling below the poverty line. Among the single-parent households, those with 3 or 4 children have the highest poverty rate, with 2 household (100.0%) living below poverty.
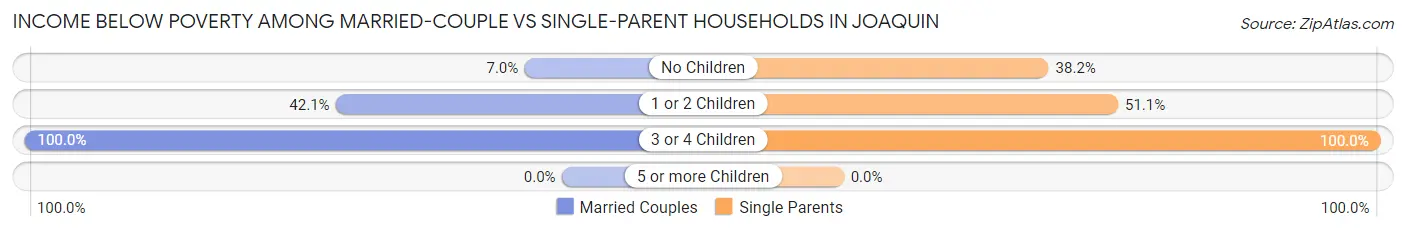
| Children | Married-Couple Families | Single-Parent Households |
| No Children | 8 (7.0%) | 21 (38.2%) |
| 1 or 2 Children | 8 (42.1%) | 23 (51.1%) |
| 3 or 4 Children | 2 (100.0%) | 2 (100.0%) |
| 5 or more Children | 0 (0.0%) | 0 (0.0%) |
| Total | 18 (12.6%) | 46 (45.1%) |
Race in Joaquin
The most populous races in Joaquin are White / Caucasian (529 | 66.6%), Hispanic or Latino (165 | 20.8%), and Two or more Races (156 | 19.7%).
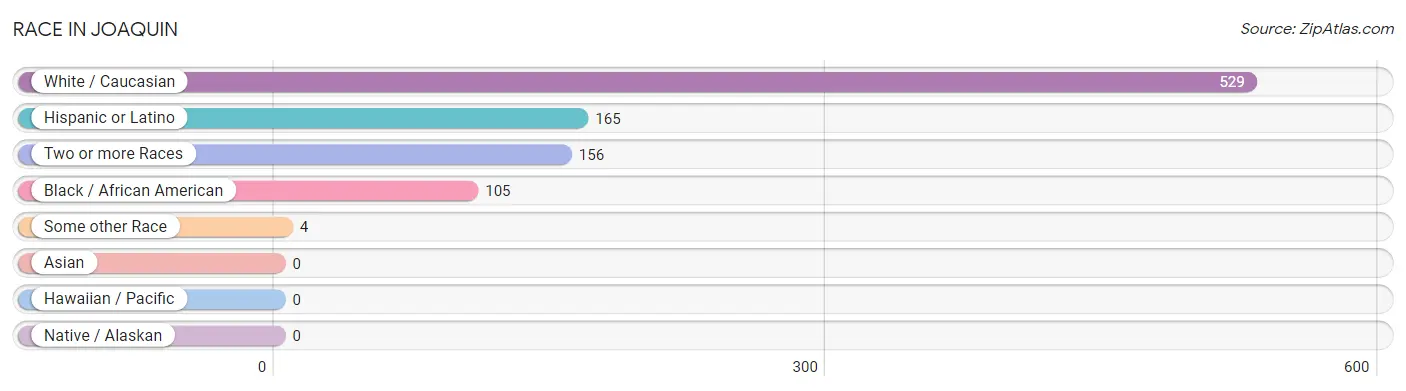
| Race | # Population | % Population |
| Asian | 0 | 0.0% |
| Black / African American | 105 | 13.2% |
| Hawaiian / Pacific | 0 | 0.0% |
| Hispanic or Latino | 165 | 20.8% |
| Native / Alaskan | 0 | 0.0% |
| White / Caucasian | 529 | 66.6% |
| Two or more Races | 156 | 19.7% |
| Some other Race | 4 | 0.5% |
| Total | 794 | 100.0% |
Ancestry in Joaquin
The most populous ancestries reported in Joaquin are Mexican (161 | 20.3%), Irish (108 | 13.6%), American (92 | 11.6%), German (88 | 11.1%), and English (40 | 5.0%), together accounting for 61.6% of all Joaquin residents.
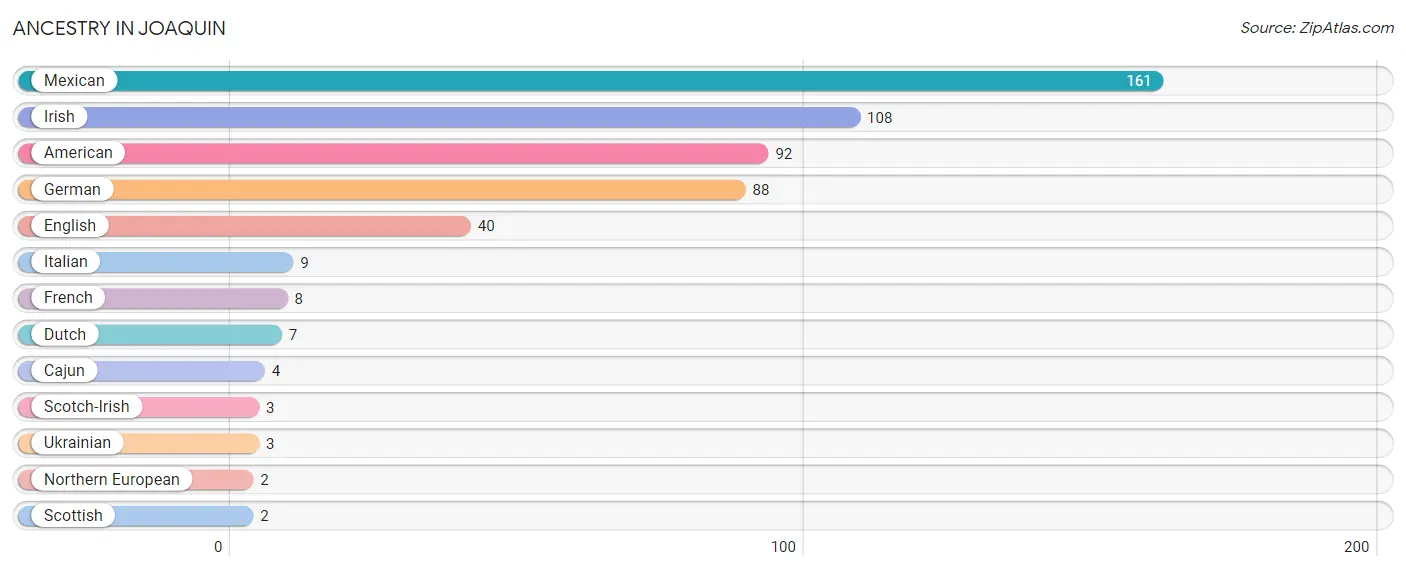
| Ancestry | # Population | % Population |
| American | 92 | 11.6% |
| Cajun | 4 | 0.5% |
| Dutch | 7 | 0.9% |
| English | 40 | 5.0% |
| French | 8 | 1.0% |
| German | 88 | 11.1% |
| Irish | 108 | 13.6% |
| Italian | 9 | 1.1% |
| Mexican | 161 | 20.3% |
| Northern European | 2 | 0.3% |
| Scotch-Irish | 3 | 0.4% |
| Scottish | 2 | 0.3% |
| Ukrainian | 3 | 0.4% | View All 13 Rows |
Immigrants in Joaquin
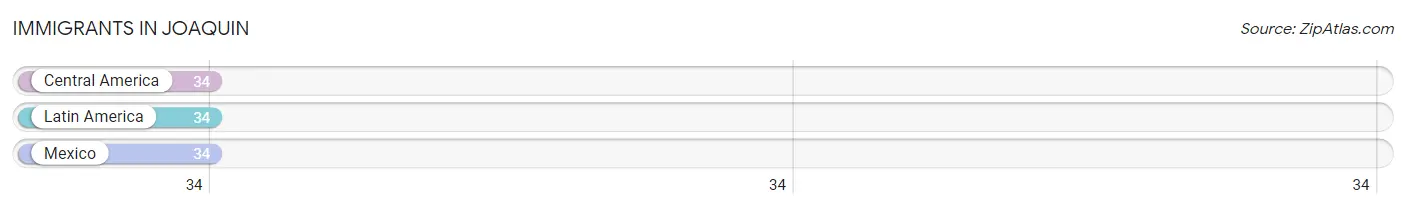
The most numerous immigrant groups reported in Joaquin came from Central America (34 | 4.3%), Latin America (34 | 4.3%), and Mexico (34 | 4.3%), together accounting for 12.8% of all Joaquin residents.
| Immigration Origin | # Population | % Population |
| Central America | 34 | 4.3% |
| Latin America | 34 | 4.3% |
| Mexico | 34 | 4.3% | View All 3 Rows |
Sex and Age in Joaquin
Sex and Age in Joaquin
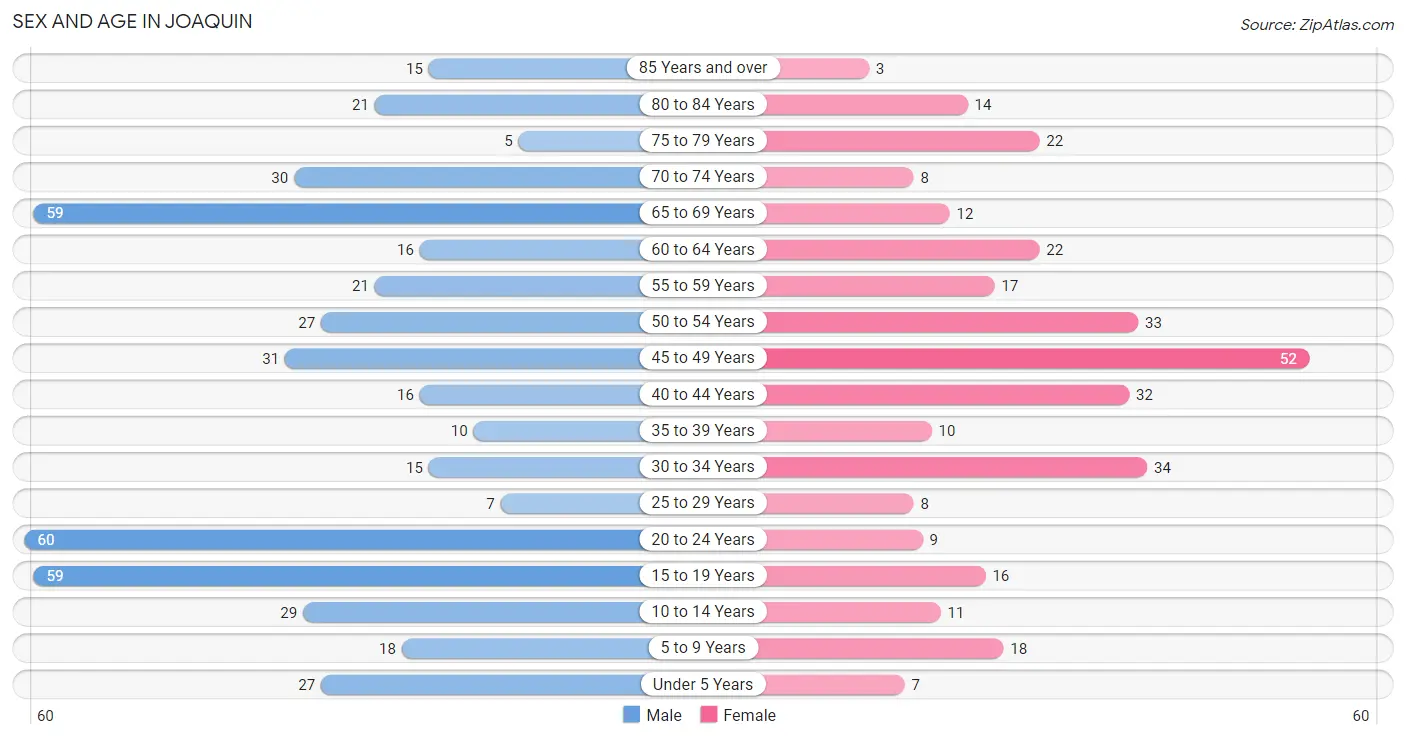
The most populous age groups in Joaquin are 20 to 24 Years (60 | 12.9%) for men and 45 to 49 Years (52 | 15.9%) for women.
| Age Bracket | Male | Female |
| Under 5 Years | 27 (5.8%) | 7 (2.1%) |
| 5 to 9 Years | 18 (3.9%) | 18 (5.5%) |
| 10 to 14 Years | 29 (6.2%) | 11 (3.4%) |
| 15 to 19 Years | 59 (12.7%) | 16 (4.9%) |
| 20 to 24 Years | 60 (12.9%) | 9 (2.7%) |
| 25 to 29 Years | 7 (1.5%) | 8 (2.4%) |
| 30 to 34 Years | 15 (3.2%) | 34 (10.4%) |
| 35 to 39 Years | 10 (2.1%) | 10 (3.0%) |
| 40 to 44 Years | 16 (3.4%) | 32 (9.8%) |
| 45 to 49 Years | 31 (6.7%) | 52 (15.9%) |
| 50 to 54 Years | 27 (5.8%) | 33 (10.1%) |
| 55 to 59 Years | 21 (4.5%) | 17 (5.2%) |
| 60 to 64 Years | 16 (3.4%) | 22 (6.7%) |
| 65 to 69 Years | 59 (12.7%) | 12 (3.7%) |
| 70 to 74 Years | 30 (6.4%) | 8 (2.4%) |
| 75 to 79 Years | 5 (1.1%) | 22 (6.7%) |
| 80 to 84 Years | 21 (4.5%) | 14 (4.3%) |
| 85 Years and over | 15 (3.2%) | 3 (0.9%) |
| Total | 466 (100.0%) | 328 (100.0%) |
Families and Households in Joaquin
Median Family Size in Joaquin
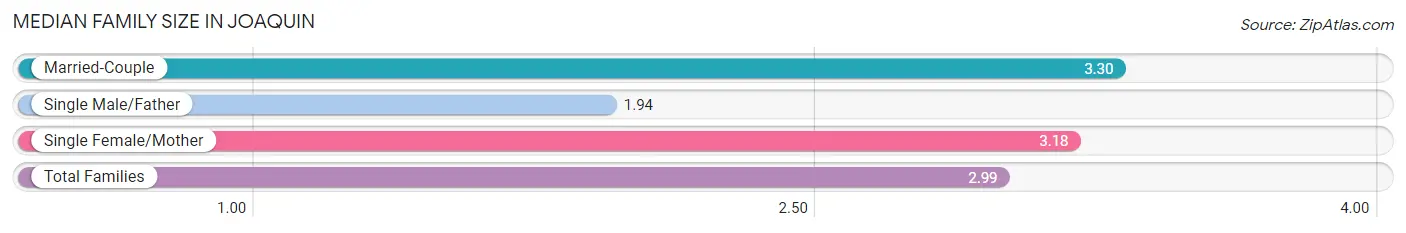
The median family size in Joaquin is 2.99 persons per family, with married-couple families (143 | 58.4%) accounting for the largest median family size of 3.3 persons per family. On the other hand, single male/father families (51 | 20.8%) represent the smallest median family size with 1.94 persons per family.
| Family Type | # Families | Family Size |
| Married-Couple | 143 (58.4%) | 3.30 |
| Single Male/Father | 51 (20.8%) | 1.94 |
| Single Female/Mother | 51 (20.8%) | 3.18 |
| Total Families | 245 (100.0%) | 2.99 |
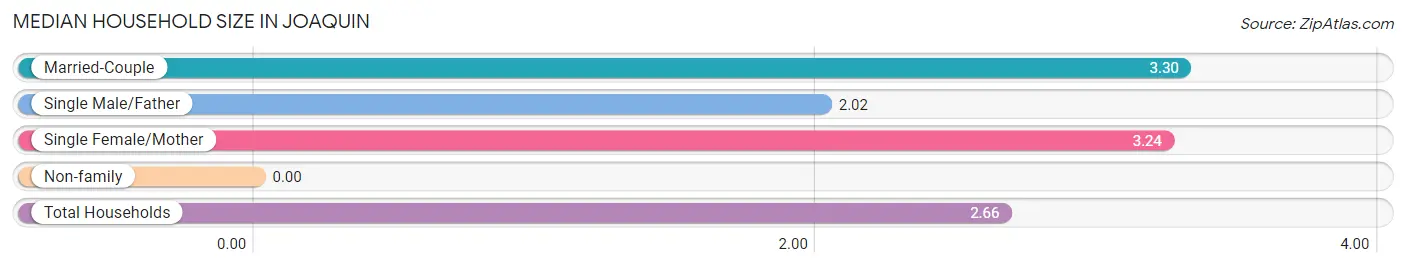
Median Household Size in Joaquin
| Household Type | # Households | Household Size |
| Married-Couple | 143 (47.8%) | 3.30 |
| Single Male/Father | 51 (17.1%) | 2.02 |
| Single Female/Mother | 51 (17.1%) | 3.24 |
| Non-family | 54 (18.1%) | - |
| Total Households | 299 (100.0%) | 2.66 |
Household Size by Marriage Status in Joaquin
Out of a total of 299 households in Joaquin, 245 (81.9%) are family households, while 54 (18.1%) are nonfamily households. The most numerous type of family households are 2-person households, comprising 156, and the most common type of nonfamily households are 1-person households, comprising 54.
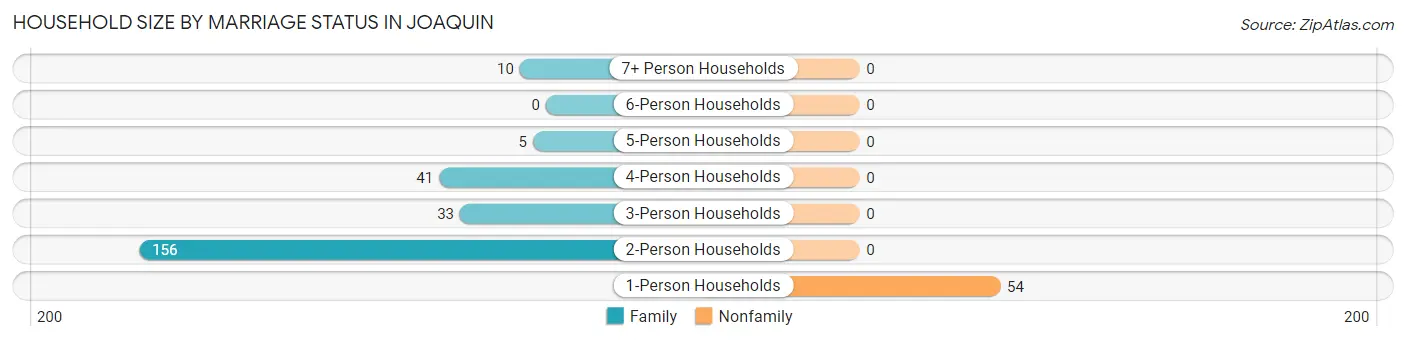
| Household Size | Family Households | Nonfamily Households |
| 1-Person Households | - | 54 (18.1%) |
| 2-Person Households | 156 (52.2%) | 0 (0.0%) |
| 3-Person Households | 33 (11.0%) | 0 (0.0%) |
| 4-Person Households | 41 (13.7%) | 0 (0.0%) |
| 5-Person Households | 5 (1.7%) | 0 (0.0%) |
| 6-Person Households | 0 (0.0%) | 0 (0.0%) |
| 7+ Person Households | 10 (3.3%) | 0 (0.0%) |
| Total | 245 (81.9%) | 54 (18.1%) |
Female Fertility in Joaquin
Fertility by Age in Joaquin
Average fertility rate in Joaquin is 25.0 births per 1,000 women. Women in the age bracket of 20 to 34 years have the highest fertility rate with 78.0 births per 1,000 women. Women in the age bracket of 20 to 34 years acount for 100.0% of all women with births.
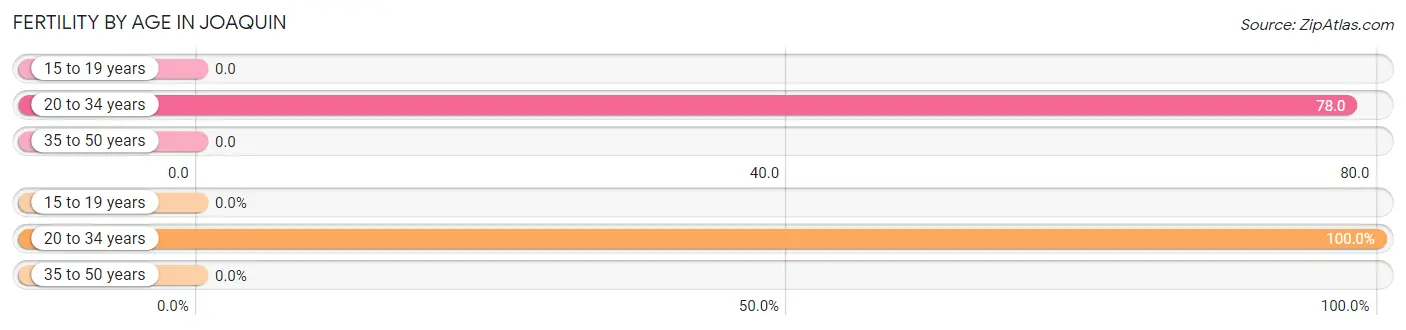
| Age Bracket | Women with Births | Births / 1,000 Women |
| 15 to 19 years | 0 (0.0%) | 0.0 |
| 20 to 34 years | 4 (100.0%) | 78.0 |
| 35 to 50 years | 0 (0.0%) | 0.0 |
| Total | 4 (100.0%) | 25.0 |
Fertility by Age by Marriage Status in Joaquin
50.0% of women with births (4) in Joaquin are married. The highest percentage of unmarried women with births falls into 20 to 34 years age bracket with 50.0% of them unmarried at the time of birth, while the lowest percentage of unmarried women with births belong to 20 to 34 years age bracket with 50.0% of them unmarried.
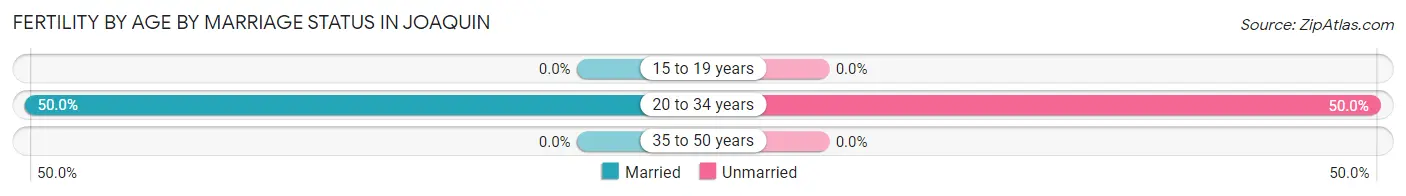
| Age Bracket | Married | Unmarried |
| 15 to 19 years | 0 (0.0%) | 0 (0.0%) |
| 20 to 34 years | 2 (50.0%) | 2 (50.0%) |
| 35 to 50 years | 0 (0.0%) | 0 (0.0%) |
| Total | 2 (50.0%) | 2 (50.0%) |
Fertility by Education in Joaquin
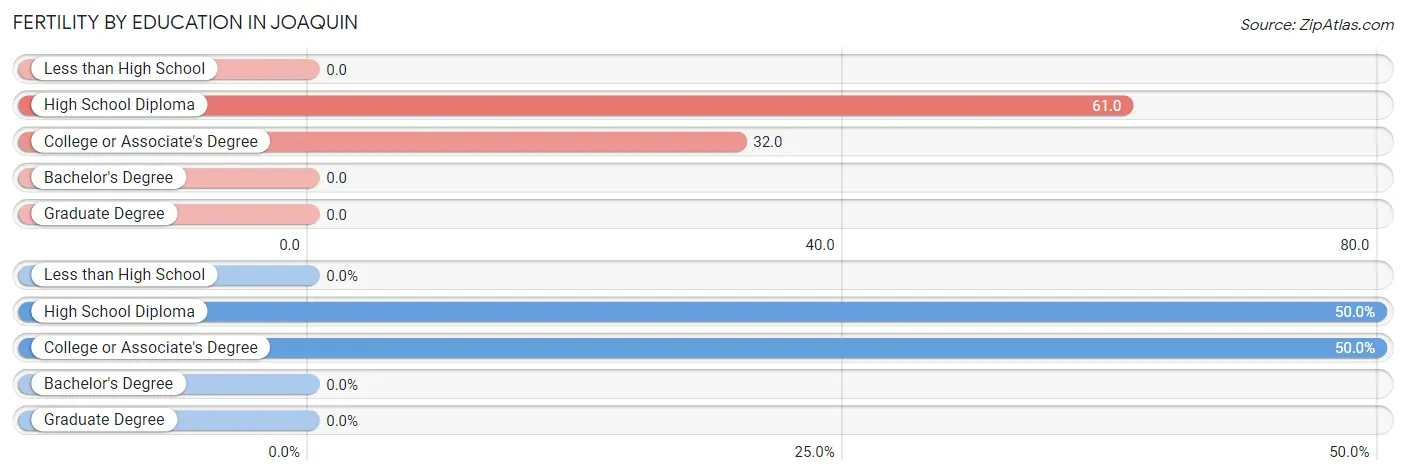
| Educational Attainment | Women with Births | Births / 1,000 Women |
| Less than High School | 0 (0.0%) | 0.0 |
| High School Diploma | 2 (50.0%) | 61.0 |
| College or Associate's Degree | 2 (50.0%) | 32.0 |
| Bachelor's Degree | 0 (0.0%) | 0.0 |
| Graduate Degree | 0 (0.0%) | 0.0 |
| Total | 4 (100.0%) | 25.0 |
Fertility by Education by Marriage Status in Joaquin
50.0% of women with births in Joaquin are unmarried. Women with the educational attainment of college or associate's degree are most likely to be married with 100.0% of them married at childbirth, while women with the educational attainment of high school diploma are least likely to be married with 100.0% of them unmarried at childbirth.
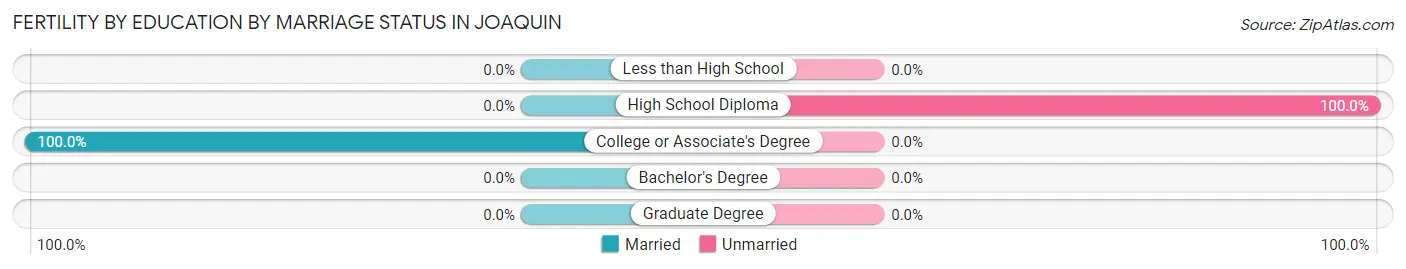
| Educational Attainment | Married | Unmarried |
| Less than High School | 0 (0.0%) | 0 (0.0%) |
| High School Diploma | 0 (0.0%) | 2 (100.0%) |
| College or Associate's Degree | 2 (100.0%) | 0 (0.0%) |
| Bachelor's Degree | 0 (0.0%) | 0 (0.0%) |
| Graduate Degree | 0 (0.0%) | 0 (0.0%) |
| Total | 2 (50.0%) | 2 (50.0%) |
Employment Characteristics in Joaquin
Employment by Class of Employer in Joaquin
Among the 343 employed individuals in Joaquin, private company employees (236 | 68.8%), state government employees (35 | 10.2%), and self-employed (not incorporated) (27 | 7.9%) make up the most common classes of employment.
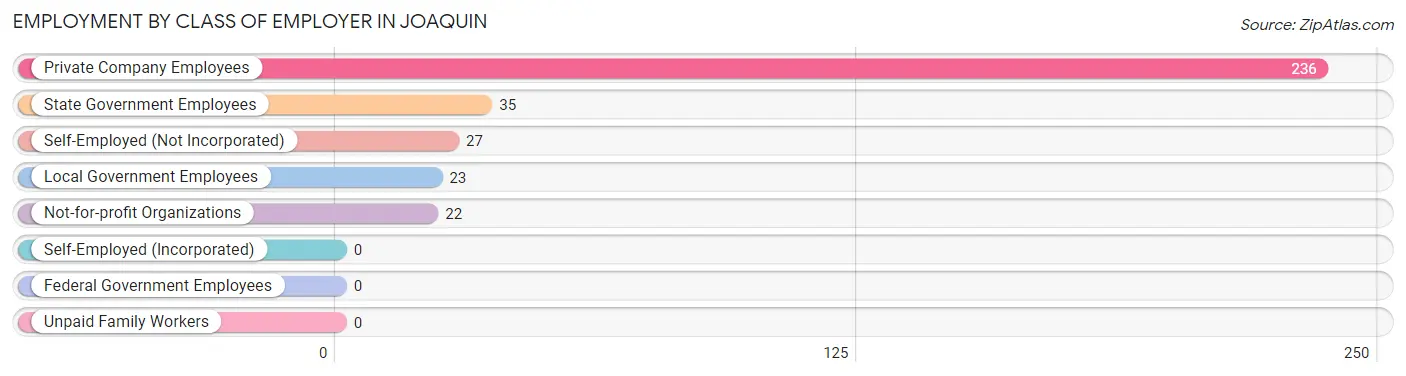
| Employer Class | # Employees | % Employees |
| Private Company Employees | 236 | 68.8% |
| Self-Employed (Incorporated) | 0 | 0.0% |
| Self-Employed (Not Incorporated) | 27 | 7.9% |
| Not-for-profit Organizations | 22 | 6.4% |
| Local Government Employees | 23 | 6.7% |
| State Government Employees | 35 | 10.2% |
| Federal Government Employees | 0 | 0.0% |
| Unpaid Family Workers | 0 | 0.0% |
| Total | 343 | 100.0% |
Employment Status by Age in Joaquin
According to the labor force statistics for Joaquin, out of the total population over 16 years of age (669), 53.4% or 357 individuals are in the labor force, with 3.9% or 14 of them unemployed. The age group with the highest labor force participation rate is 20 to 24 years, with 79.7% or 55 individuals in the labor force. Within the labor force, the 16 to 19 years age range has the highest percentage of unemployed individuals, with 17.9% or 5 of them being unemployed.
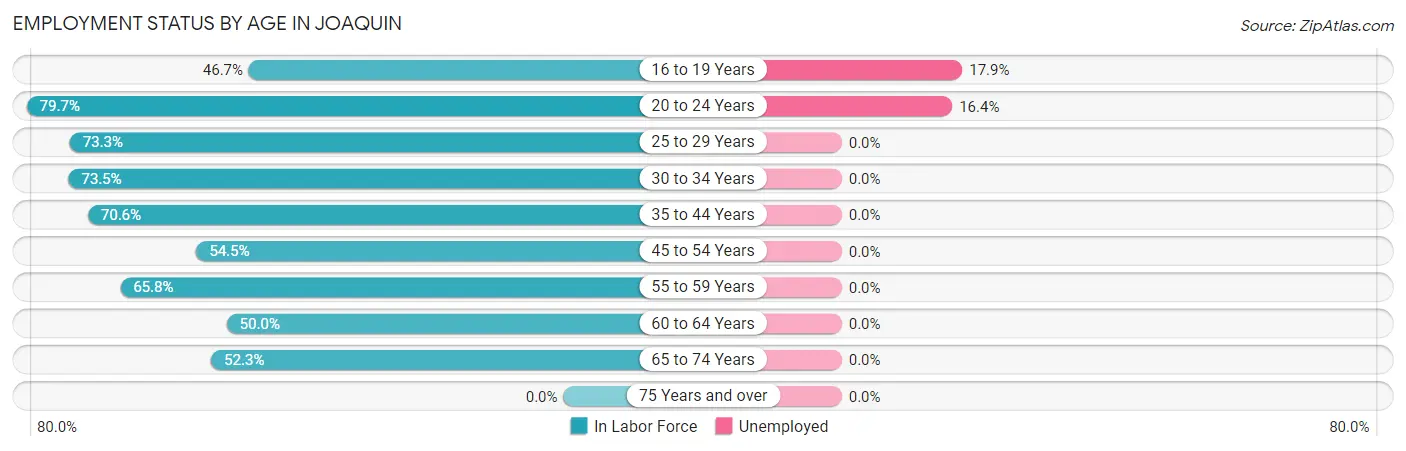
| Age Bracket | In Labor Force | Unemployed |
| 16 to 19 Years | 28 (46.7%) | 5 (17.9%) |
| 20 to 24 Years | 55 (79.7%) | 9 (16.4%) |
| 25 to 29 Years | 11 (73.3%) | 0 (0.0%) |
| 30 to 34 Years | 36 (73.5%) | 0 (0.0%) |
| 35 to 44 Years | 48 (70.6%) | 0 (0.0%) |
| 45 to 54 Years | 78 (54.5%) | 0 (0.0%) |
| 55 to 59 Years | 25 (65.8%) | 0 (0.0%) |
| 60 to 64 Years | 19 (50.0%) | 0 (0.0%) |
| 65 to 74 Years | 57 (52.3%) | 0 (0.0%) |
| 75 Years and over | 0 (0.0%) | 0 (0.0%) |
| Total | 357 (53.4%) | 14 (3.9%) |
Employment Status by Educational Attainment in Joaquin
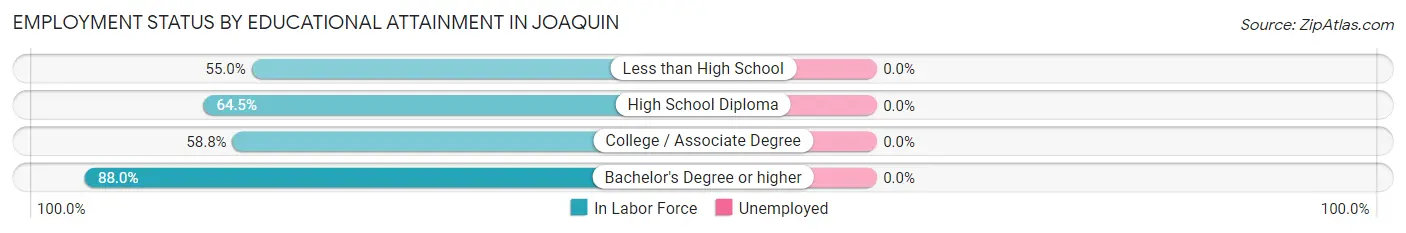
| Educational Attainment | In Labor Force | Unemployed |
| Less than High School | 55 (55.0%) | 0 (0.0%) |
| High School Diploma | 80 (64.5%) | 0 (0.0%) |
| College / Associate Degree | 60 (58.8%) | 0 (0.0%) |
| Bachelor's Degree or higher | 22 (88.0%) | 0 (0.0%) |
| Total | 217 (61.8%) | 0 (0.0%) |
Employment Occupations by Sex in Joaquin
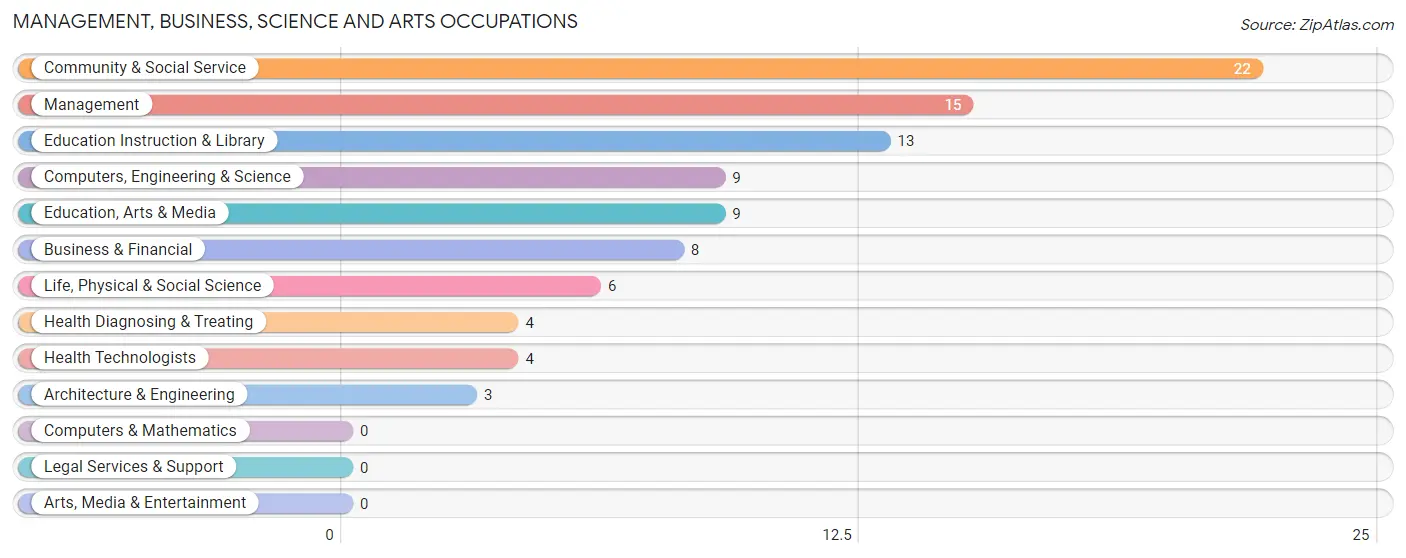
Management, Business, Science and Arts Occupations
The most common Management, Business, Science and Arts occupations in Joaquin are Community & Social Service (22 | 6.4%), Management (15 | 4.4%), Education Instruction & Library (13 | 3.8%), Computers, Engineering & Science (9 | 2.6%), and Education, Arts & Media (9 | 2.6%).
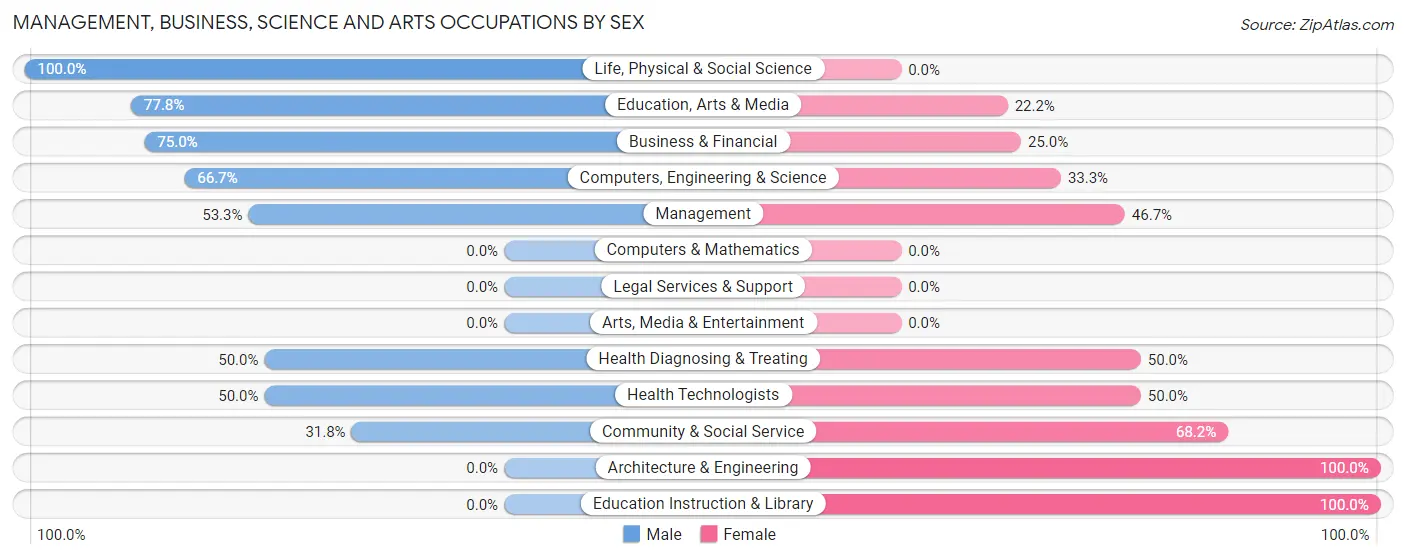
Management, Business, Science and Arts Occupations by Sex
Within the Management, Business, Science and Arts occupations in Joaquin, the most male-oriented occupations are Life, Physical & Social Science (100.0%), Education, Arts & Media (77.8%), and Business & Financial (75.0%), while the most female-oriented occupations are Architecture & Engineering (100.0%), Education Instruction & Library (100.0%), and Community & Social Service (68.2%).
| Occupation | Male | Female |
| Management | 8 (53.3%) | 7 (46.7%) |
| Business & Financial | 6 (75.0%) | 2 (25.0%) |
| Computers, Engineering & Science | 6 (66.7%) | 3 (33.3%) |
| Computers & Mathematics | 0 (0.0%) | 0 (0.0%) |
| Architecture & Engineering | 0 (0.0%) | 3 (100.0%) |
| Life, Physical & Social Science | 6 (100.0%) | 0 (0.0%) |
| Community & Social Service | 7 (31.8%) | 15 (68.2%) |
| Education, Arts & Media | 7 (77.8%) | 2 (22.2%) |
| Legal Services & Support | 0 (0.0%) | 0 (0.0%) |
| Education Instruction & Library | 0 (0.0%) | 13 (100.0%) |
| Arts, Media & Entertainment | 0 (0.0%) | 0 (0.0%) |
| Health Diagnosing & Treating | 2 (50.0%) | 2 (50.0%) |
| Health Technologists | 2 (50.0%) | 2 (50.0%) |
| Total (Category) | 29 (50.0%) | 29 (50.0%) |
| Total (Overall) | 205 (59.8%) | 138 (40.2%) |
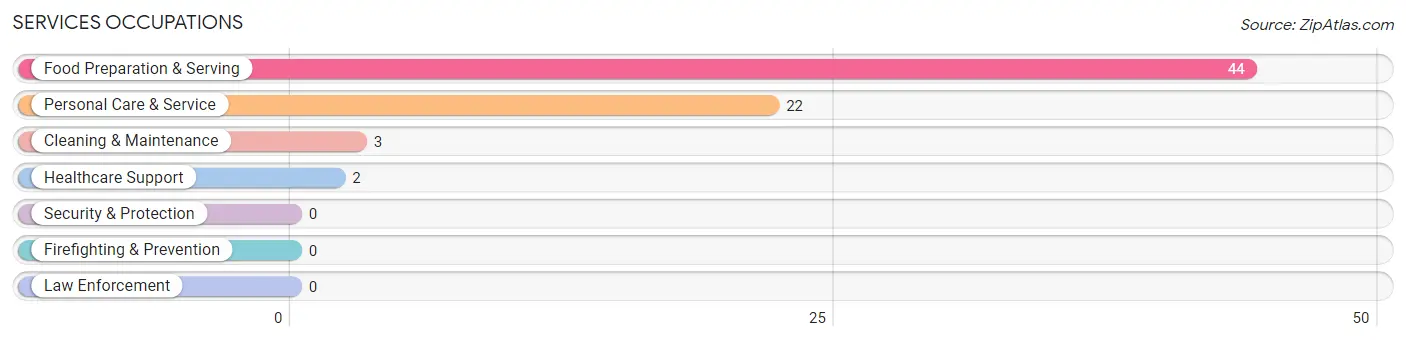
Services Occupations
The most common Services occupations in Joaquin are Food Preparation & Serving (44 | 12.8%), Personal Care & Service (22 | 6.4%), Cleaning & Maintenance (3 | 0.9%), and Healthcare Support (2 | 0.6%).
Services Occupations by Sex
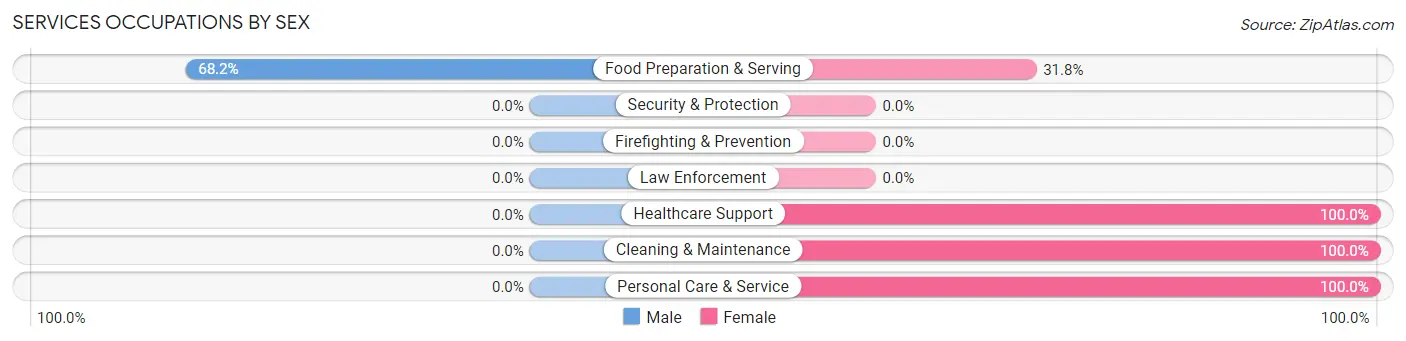
| Occupation | Male | Female |
| Healthcare Support | 0 (0.0%) | 2 (100.0%) |
| Security & Protection | 0 (0.0%) | 0 (0.0%) |
| Firefighting & Prevention | 0 (0.0%) | 0 (0.0%) |
| Law Enforcement | 0 (0.0%) | 0 (0.0%) |
| Food Preparation & Serving | 30 (68.2%) | 14 (31.8%) |
| Cleaning & Maintenance | 0 (0.0%) | 3 (100.0%) |
| Personal Care & Service | 0 (0.0%) | 22 (100.0%) |
| Total (Category) | 30 (42.2%) | 41 (57.8%) |
| Total (Overall) | 205 (59.8%) | 138 (40.2%) |
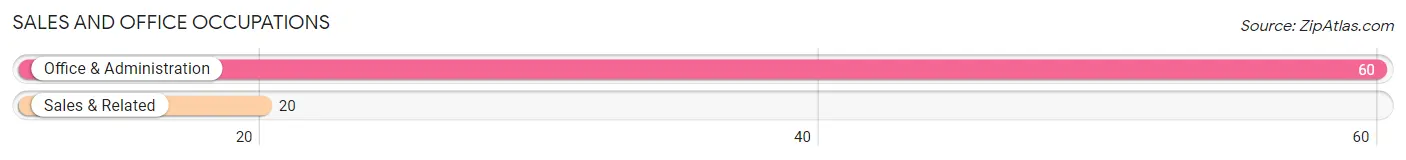
Sales and Office Occupations
The most common Sales and Office occupations in Joaquin are Office & Administration (60 | 17.5%), and Sales & Related (20 | 5.8%).
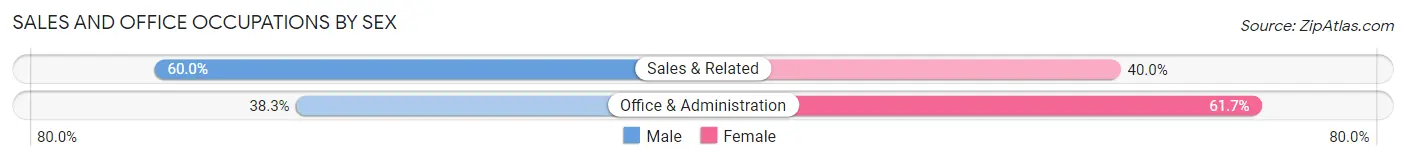
Sales and Office Occupations by Sex
| Occupation | Male | Female |
| Sales & Related | 12 (60.0%) | 8 (40.0%) |
| Office & Administration | 23 (38.3%) | 37 (61.7%) |
| Total (Category) | 35 (43.8%) | 45 (56.2%) |
| Total (Overall) | 205 (59.8%) | 138 (40.2%) |
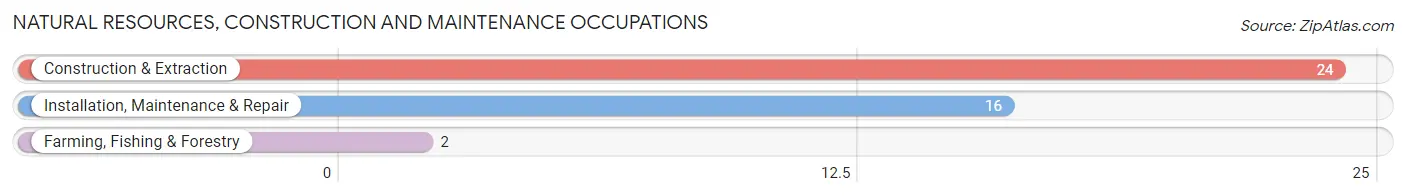
Natural Resources, Construction and Maintenance Occupations
The most common Natural Resources, Construction and Maintenance occupations in Joaquin are Construction & Extraction (24 | 7.0%), Installation, Maintenance & Repair (16 | 4.7%), and Farming, Fishing & Forestry (2 | 0.6%).
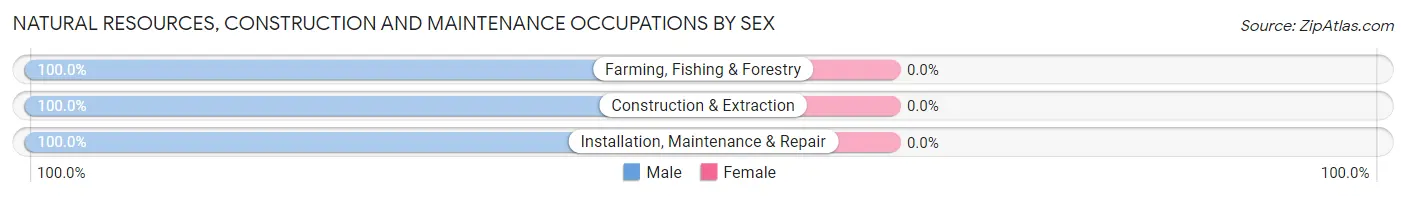
Natural Resources, Construction and Maintenance Occupations by Sex
| Occupation | Male | Female |
| Farming, Fishing & Forestry | 2 (100.0%) | 0 (0.0%) |
| Construction & Extraction | 24 (100.0%) | 0 (0.0%) |
| Installation, Maintenance & Repair | 16 (100.0%) | 0 (0.0%) |
| Total (Category) | 42 (100.0%) | 0 (0.0%) |
| Total (Overall) | 205 (59.8%) | 138 (40.2%) |
Production, Transportation and Moving Occupations
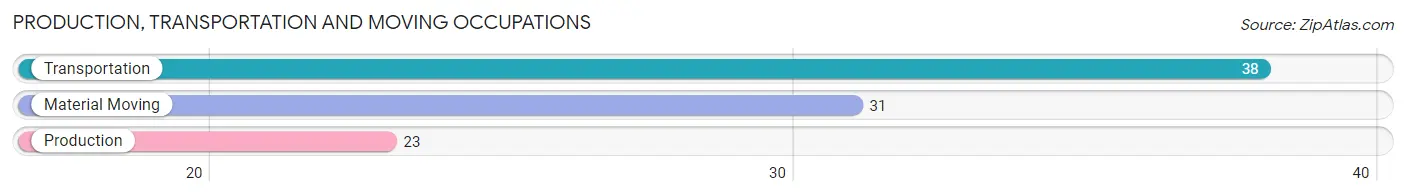
The most common Production, Transportation and Moving occupations in Joaquin are Transportation (38 | 11.1%), Material Moving (31 | 9.0%), and Production (23 | 6.7%).
Production, Transportation and Moving Occupations by Sex
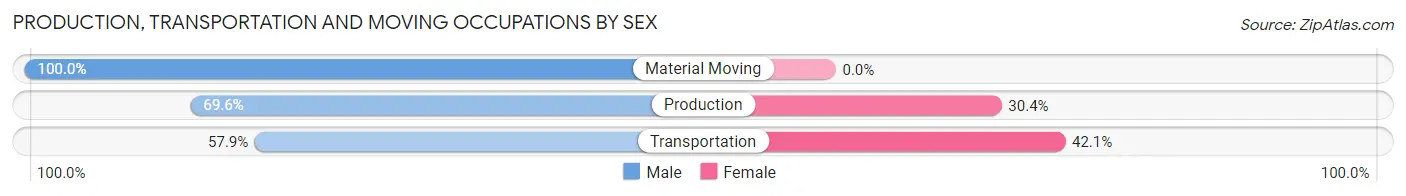
| Occupation | Male | Female |
| Production | 16 (69.6%) | 7 (30.4%) |
| Transportation | 22 (57.9%) | 16 (42.1%) |
| Material Moving | 31 (100.0%) | 0 (0.0%) |
| Total (Category) | 69 (75.0%) | 23 (25.0%) |
| Total (Overall) | 205 (59.8%) | 138 (40.2%) |
Employment Industries by Sex in Joaquin
Employment Industries in Joaquin
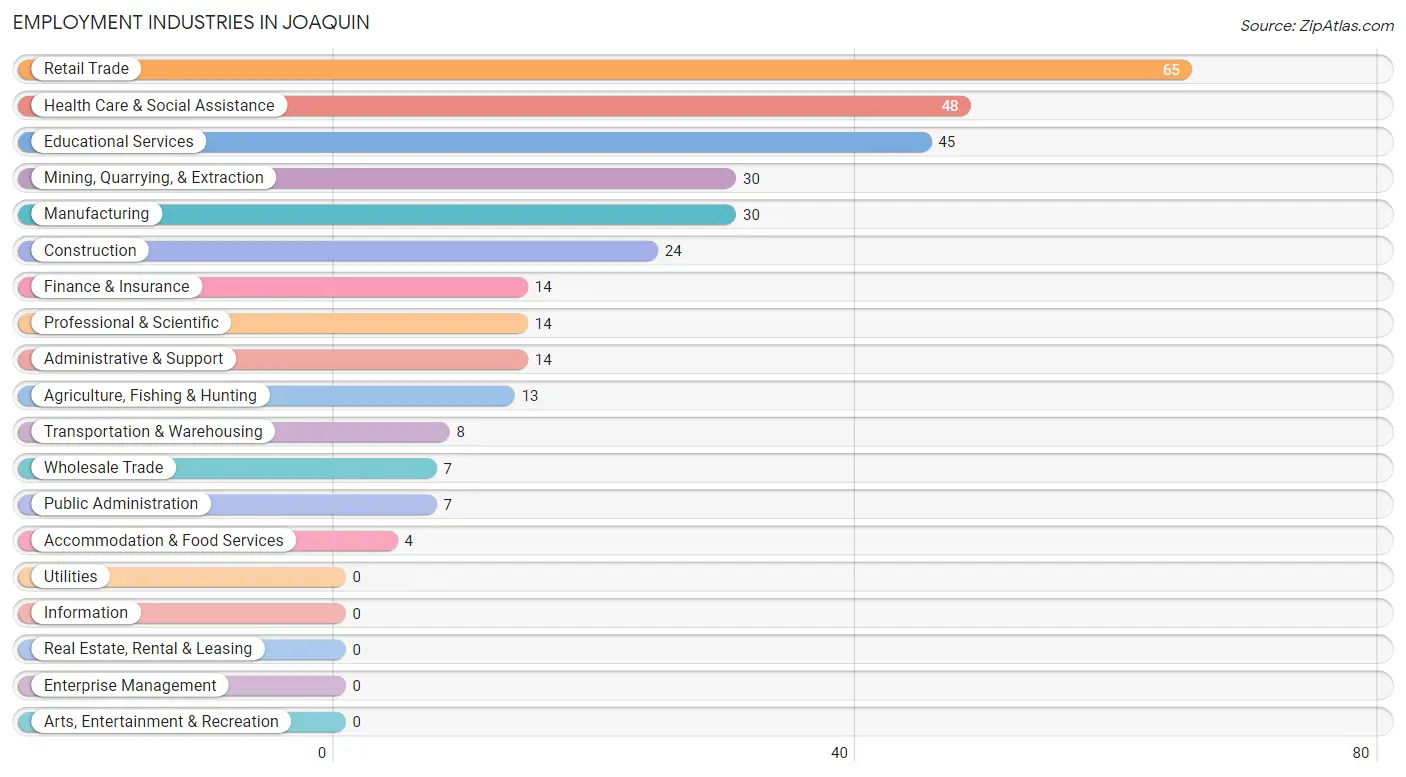
The major employment industries in Joaquin include Retail Trade (65 | 19.0%), Health Care & Social Assistance (48 | 14.0%), Educational Services (45 | 13.1%), Mining, Quarrying, & Extraction (30 | 8.7%), and Manufacturing (30 | 8.7%).
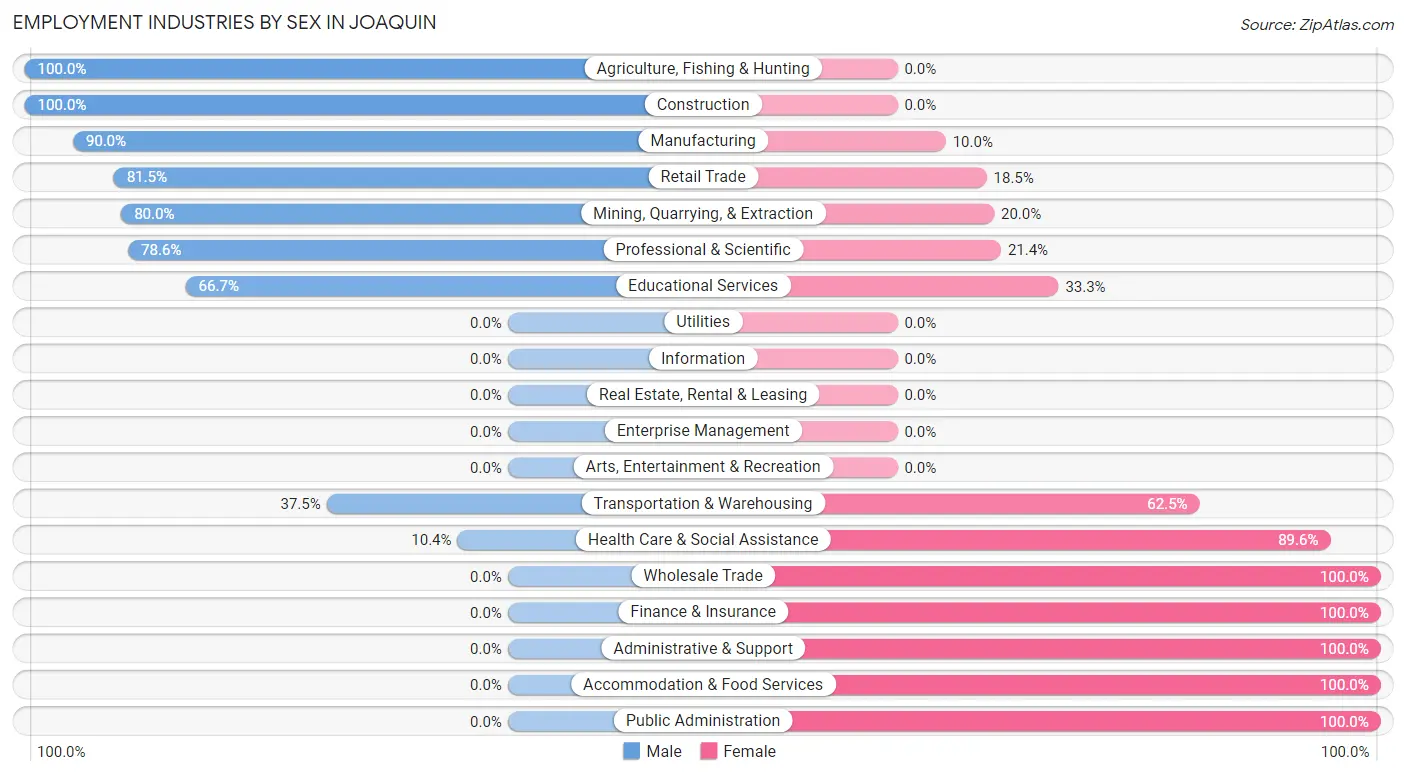
Employment Industries by Sex in Joaquin
The Joaquin industries that see more men than women are Agriculture, Fishing & Hunting (100.0%), Construction (100.0%), and Manufacturing (90.0%), whereas the industries that tend to have a higher number of women are Wholesale Trade (100.0%), Finance & Insurance (100.0%), and Administrative & Support (100.0%).
| Industry | Male | Female |
| Agriculture, Fishing & Hunting | 13 (100.0%) | 0 (0.0%) |
| Mining, Quarrying, & Extraction | 24 (80.0%) | 6 (20.0%) |
| Construction | 24 (100.0%) | 0 (0.0%) |
| Manufacturing | 27 (90.0%) | 3 (10.0%) |
| Wholesale Trade | 0 (0.0%) | 7 (100.0%) |
| Retail Trade | 53 (81.5%) | 12 (18.5%) |
| Transportation & Warehousing | 3 (37.5%) | 5 (62.5%) |
| Utilities | 0 (0.0%) | 0 (0.0%) |
| Information | 0 (0.0%) | 0 (0.0%) |
| Finance & Insurance | 0 (0.0%) | 14 (100.0%) |
| Real Estate, Rental & Leasing | 0 (0.0%) | 0 (0.0%) |
| Professional & Scientific | 11 (78.6%) | 3 (21.4%) |
| Enterprise Management | 0 (0.0%) | 0 (0.0%) |
| Administrative & Support | 0 (0.0%) | 14 (100.0%) |
| Educational Services | 30 (66.7%) | 15 (33.3%) |
| Health Care & Social Assistance | 5 (10.4%) | 43 (89.6%) |
| Arts, Entertainment & Recreation | 0 (0.0%) | 0 (0.0%) |
| Accommodation & Food Services | 0 (0.0%) | 4 (100.0%) |
| Public Administration | 0 (0.0%) | 7 (100.0%) |
| Total | 205 (59.8%) | 138 (40.2%) |
Education in Joaquin
School Enrollment in Joaquin
The most common levels of schooling among the 153 students in Joaquin are high school (74 | 48.4%), middle school (29 | 19.0%), and elementary school (27 | 17.6%).
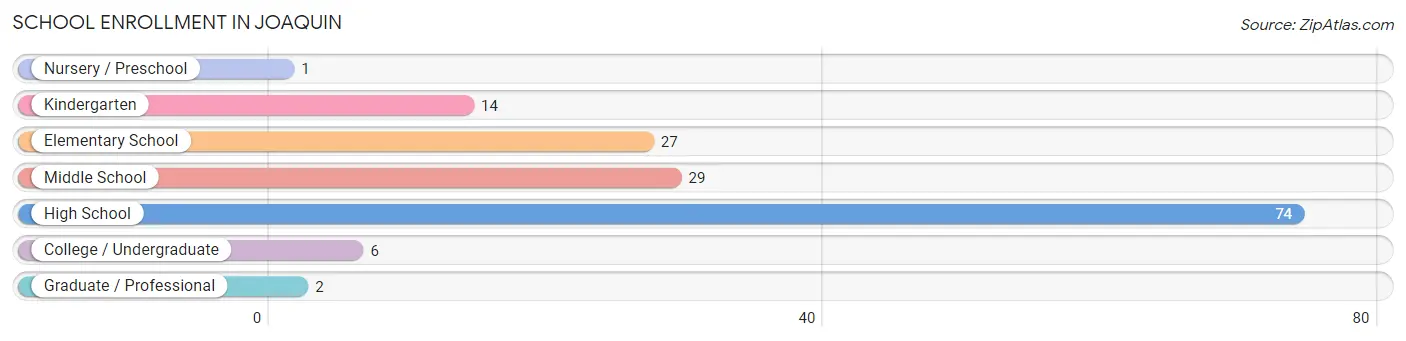
| School Level | # Students | % Students |
| Nursery / Preschool | 1 | 0.6% |
| Kindergarten | 14 | 9.1% |
| Elementary School | 27 | 17.6% |
| Middle School | 29 | 19.0% |
| High School | 74 | 48.4% |
| College / Undergraduate | 6 | 3.9% |
| Graduate / Professional | 2 | 1.3% |
| Total | 153 | 100.0% |
School Enrollment by Age by Funding Source in Joaquin
Out of a total of 153 students who are enrolled in schools in Joaquin, 2 (1.3%) attend a private institution, while the remaining 151 (98.7%) are enrolled in public schools. The age group of 18 to 19 year olds has the highest likelihood of being enrolled in private schools, with 2 (8.0% in the age bracket) enrolled. Conversely, the age group of 5 to 9 year old has the lowest likelihood of being enrolled in a private school, with 36 (100.0% in the age bracket) attending a public institution.
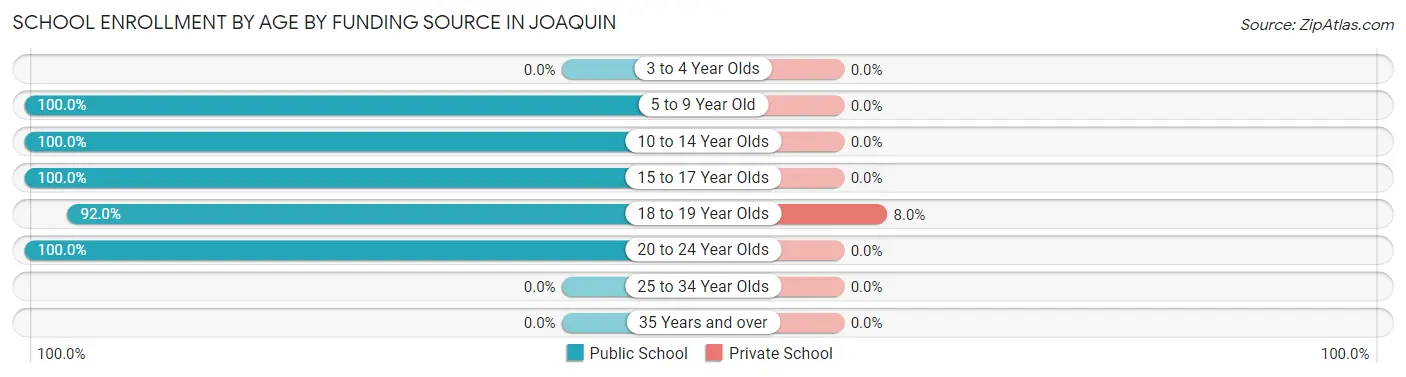
| Age Bracket | Public School | Private School |
| 3 to 4 Year Olds | 0 (0.0%) | 0 (0.0%) |
| 5 to 9 Year Old | 36 (100.0%) | 0 (0.0%) |
| 10 to 14 Year Olds | 40 (100.0%) | 0 (0.0%) |
| 15 to 17 Year Olds | 50 (100.0%) | 0 (0.0%) |
| 18 to 19 Year Olds | 23 (92.0%) | 2 (8.0%) |
| 20 to 24 Year Olds | 2 (100.0%) | 0 (0.0%) |
| 25 to 34 Year Olds | 0 (0.0%) | 0 (0.0%) |
| 35 Years and over | 0 (0.0%) | 0 (0.0%) |
| Total | 151 (98.7%) | 2 (1.3%) |
Educational Attainment by Field of Study in Joaquin
Education (15 | 32.6%), science & technology (13 | 28.3%), liberal arts & history (8 | 17.4%), psychology (3 | 6.5%), and social sciences (3 | 6.5%) are the most common fields of study among 46 individuals in Joaquin who have obtained a bachelor's degree or higher.

| Field of Study | # Graduates | % Graduates |
| Computers & Mathematics | 0 | 0.0% |
| Bio, Nature & Agricultural | 0 | 0.0% |
| Physical & Health Sciences | 0 | 0.0% |
| Psychology | 3 | 6.5% |
| Social Sciences | 3 | 6.5% |
| Engineering | 2 | 4.3% |
| Multidisciplinary Studies | 0 | 0.0% |
| Science & Technology | 13 | 28.3% |
| Business | 0 | 0.0% |
| Education | 15 | 32.6% |
| Literature & Languages | 0 | 0.0% |
| Liberal Arts & History | 8 | 17.4% |
| Visual & Performing Arts | 0 | 0.0% |
| Communications | 0 | 0.0% |
| Arts & Humanities | 2 | 4.3% |
| Total | 46 | 100.0% |
Transportation & Commute in Joaquin
Vehicle Availability by Sex in Joaquin
The most prevalent vehicle ownership categories in Joaquin are males with 1 vehicle (71, accounting for 34.6%) and females with 1 vehicle (14, making up 51.4%).
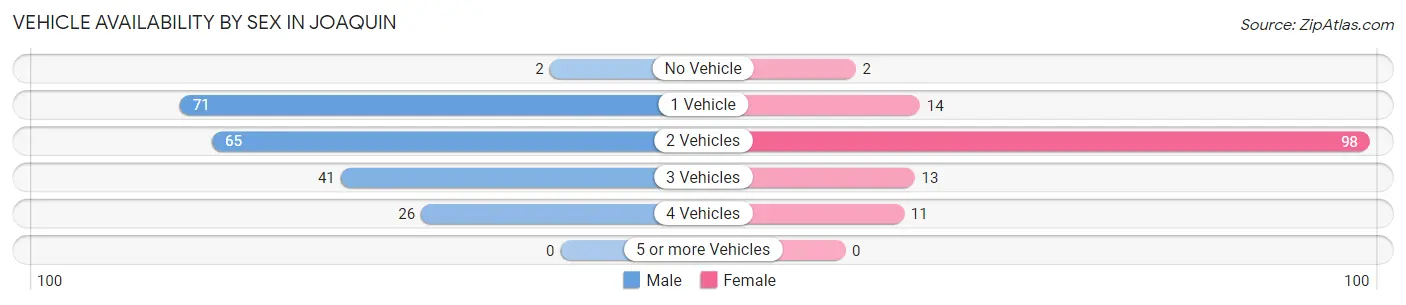
| Vehicles Available | Male | Female |
| No Vehicle | 2 (1.0%) | 2 (1.5%) |
| 1 Vehicle | 71 (34.6%) | 14 (10.1%) |
| 2 Vehicles | 65 (31.7%) | 98 (71.0%) |
| 3 Vehicles | 41 (20.0%) | 13 (9.4%) |
| 4 Vehicles | 26 (12.7%) | 11 (8.0%) |
| 5 or more Vehicles | 0 (0.0%) | 0 (0.0%) |
| Total | 205 (100.0%) | 138 (100.0%) |
Commute Time in Joaquin
The most frequently occuring commute durations in Joaquin are 15 to 19 minutes (87 commuters, 26.0%), 5 to 9 minutes (56 commuters, 16.7%), and 30 to 34 minutes (44 commuters, 13.1%).
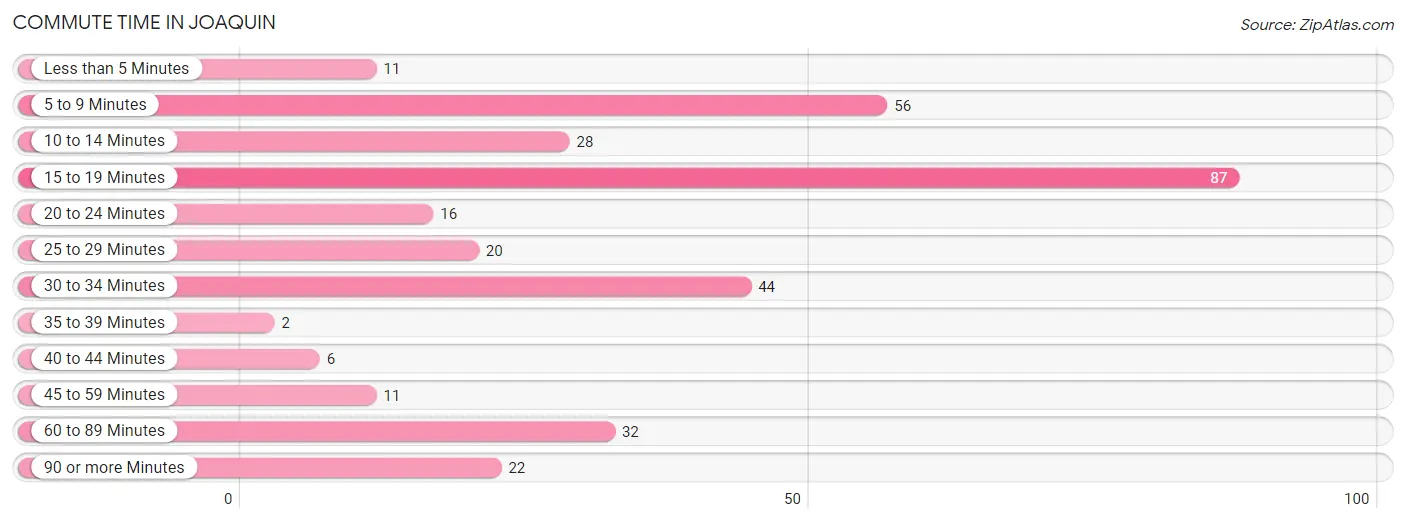
| Commute Time | # Commuters | % Commuters |
| Less than 5 Minutes | 11 | 3.3% |
| 5 to 9 Minutes | 56 | 16.7% |
| 10 to 14 Minutes | 28 | 8.4% |
| 15 to 19 Minutes | 87 | 26.0% |
| 20 to 24 Minutes | 16 | 4.8% |
| 25 to 29 Minutes | 20 | 6.0% |
| 30 to 34 Minutes | 44 | 13.1% |
| 35 to 39 Minutes | 2 | 0.6% |
| 40 to 44 Minutes | 6 | 1.8% |
| 45 to 59 Minutes | 11 | 3.3% |
| 60 to 89 Minutes | 32 | 9.6% |
| 90 or more Minutes | 22 | 6.6% |
Commute Time by Sex in Joaquin
The most common commute times in Joaquin are 5 to 9 minutes (49 commuters, 24.9%) for males and 15 to 19 minutes (60 commuters, 43.5%) for females.
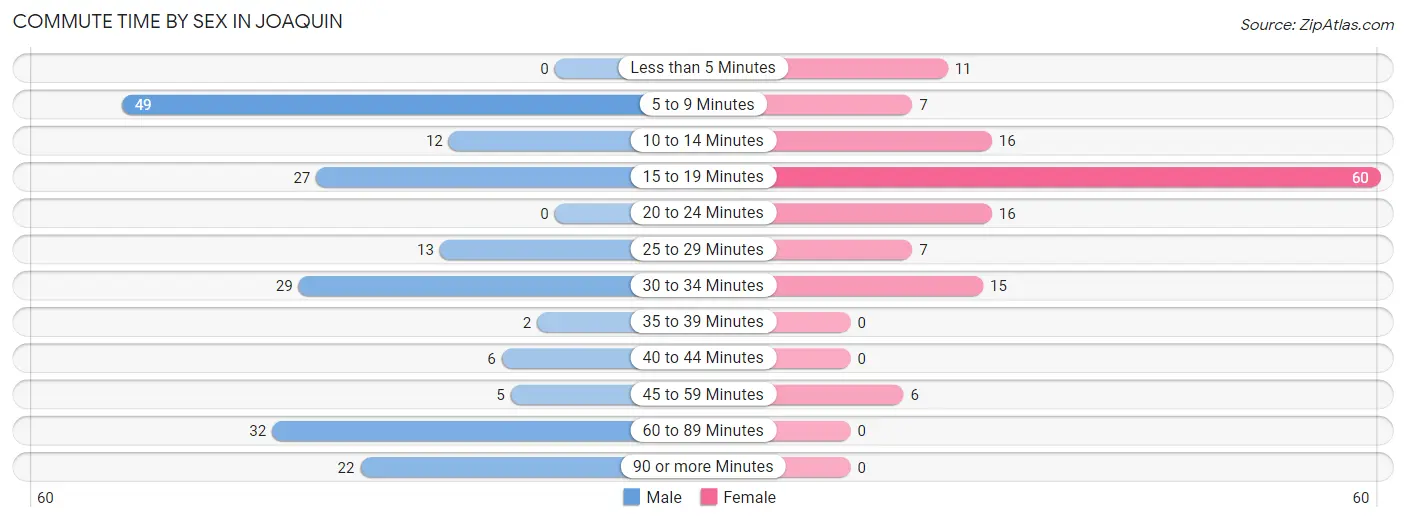
| Commute Time | Male | Female |
| Less than 5 Minutes | 0 (0.0%) | 11 (8.0%) |
| 5 to 9 Minutes | 49 (24.9%) | 7 (5.1%) |
| 10 to 14 Minutes | 12 (6.1%) | 16 (11.6%) |
| 15 to 19 Minutes | 27 (13.7%) | 60 (43.5%) |
| 20 to 24 Minutes | 0 (0.0%) | 16 (11.6%) |
| 25 to 29 Minutes | 13 (6.6%) | 7 (5.1%) |
| 30 to 34 Minutes | 29 (14.7%) | 15 (10.9%) |
| 35 to 39 Minutes | 2 (1.0%) | 0 (0.0%) |
| 40 to 44 Minutes | 6 (3.0%) | 0 (0.0%) |
| 45 to 59 Minutes | 5 (2.5%) | 6 (4.3%) |
| 60 to 89 Minutes | 32 (16.2%) | 0 (0.0%) |
| 90 or more Minutes | 22 (11.2%) | 0 (0.0%) |
Time of Departure to Work by Sex in Joaquin
The most frequent times of departure to work in Joaquin are 6:30 AM to 6:59 AM (30, 15.2%) for males and 7:30 AM to 7:59 AM (49, 35.5%) for females.
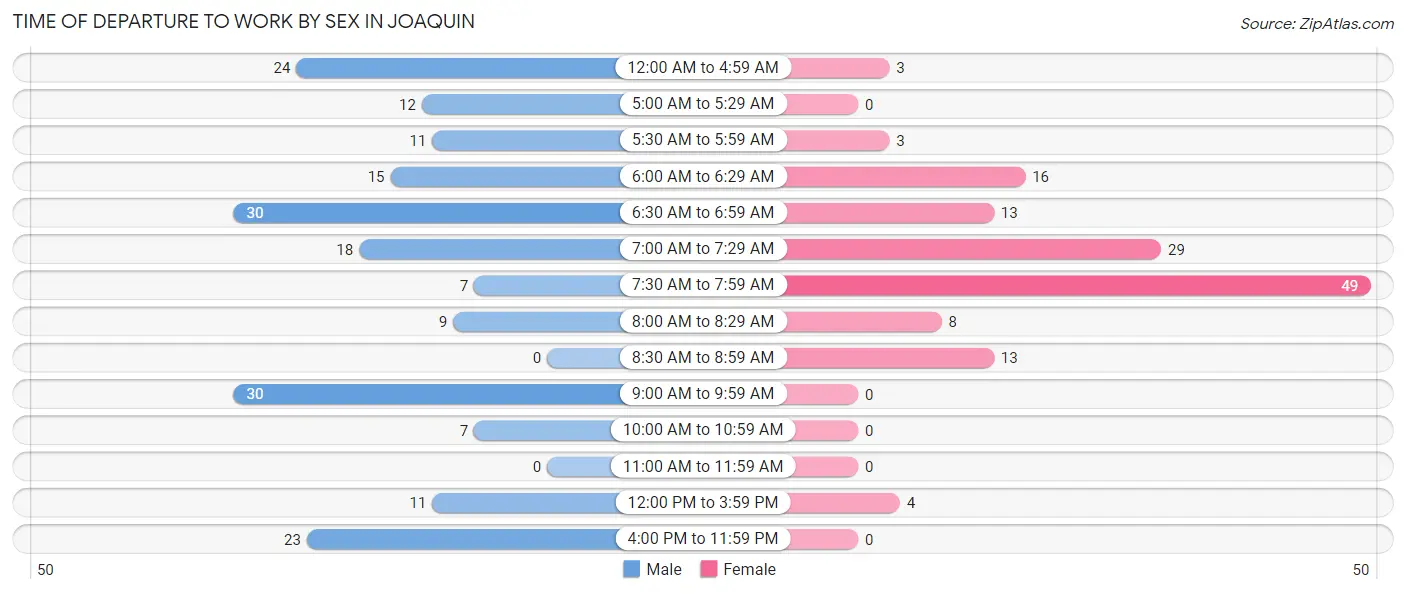
| Time of Departure | Male | Female |
| 12:00 AM to 4:59 AM | 24 (12.2%) | 3 (2.2%) |
| 5:00 AM to 5:29 AM | 12 (6.1%) | 0 (0.0%) |
| 5:30 AM to 5:59 AM | 11 (5.6%) | 3 (2.2%) |
| 6:00 AM to 6:29 AM | 15 (7.6%) | 16 (11.6%) |
| 6:30 AM to 6:59 AM | 30 (15.2%) | 13 (9.4%) |
| 7:00 AM to 7:29 AM | 18 (9.1%) | 29 (21.0%) |
| 7:30 AM to 7:59 AM | 7 (3.5%) | 49 (35.5%) |
| 8:00 AM to 8:29 AM | 9 (4.6%) | 8 (5.8%) |
| 8:30 AM to 8:59 AM | 0 (0.0%) | 13 (9.4%) |
| 9:00 AM to 9:59 AM | 30 (15.2%) | 0 (0.0%) |
| 10:00 AM to 10:59 AM | 7 (3.5%) | 0 (0.0%) |
| 11:00 AM to 11:59 AM | 0 (0.0%) | 0 (0.0%) |
| 12:00 PM to 3:59 PM | 11 (5.6%) | 4 (2.9%) |
| 4:00 PM to 11:59 PM | 23 (11.7%) | 0 (0.0%) |
| Total | 197 (100.0%) | 138 (100.0%) |
Housing Occupancy in Joaquin
Occupancy by Ownership in Joaquin
Of the total 299 dwellings in Joaquin, owner-occupied units account for 201 (67.2%), while renter-occupied units make up 98 (32.8%).
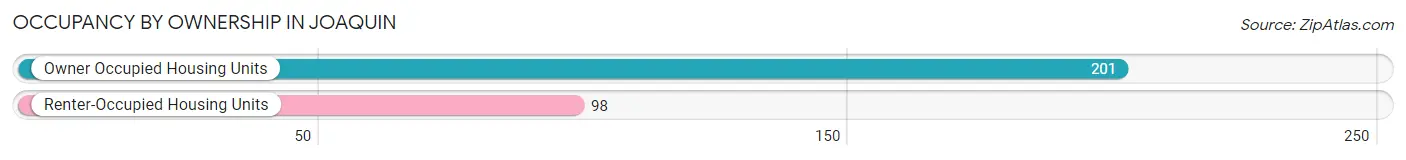
| Occupancy | # Housing Units | % Housing Units |
| Owner Occupied Housing Units | 201 | 67.2% |
| Renter-Occupied Housing Units | 98 | 32.8% |
| Total Occupied Housing Units | 299 | 100.0% |
Occupancy by Household Size in Joaquin
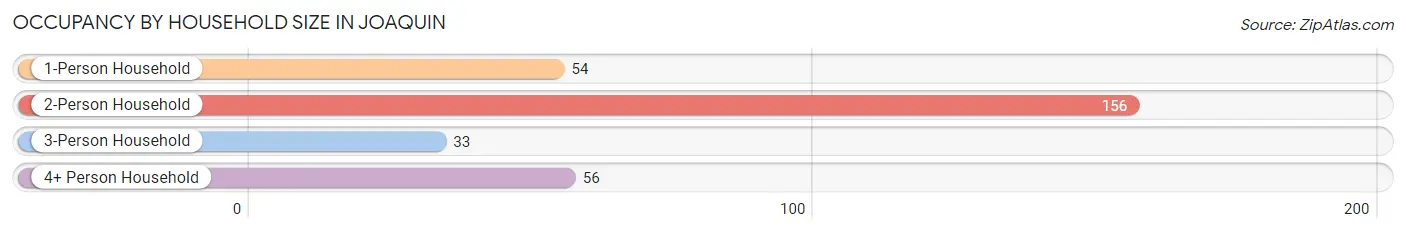
| Household Size | # Housing Units | % Housing Units |
| 1-Person Household | 54 | 18.1% |
| 2-Person Household | 156 | 52.2% |
| 3-Person Household | 33 | 11.0% |
| 4+ Person Household | 56 | 18.7% |
| Total Housing Units | 299 | 100.0% |
Occupancy by Ownership by Household Size in Joaquin
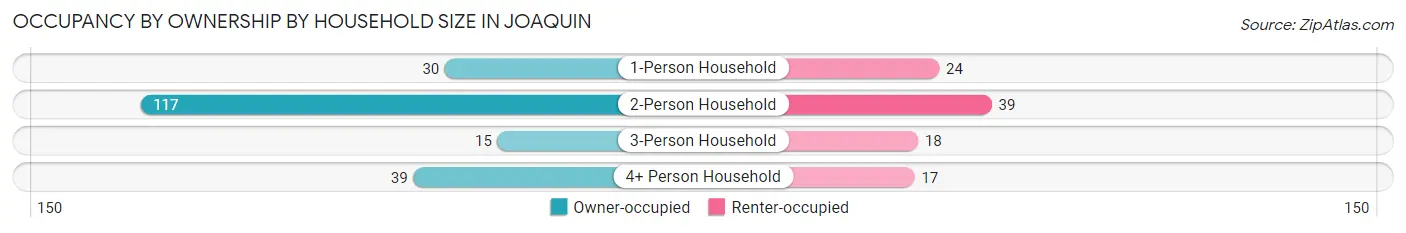
| Household Size | Owner-occupied | Renter-occupied |
| 1-Person Household | 30 (55.6%) | 24 (44.4%) |
| 2-Person Household | 117 (75.0%) | 39 (25.0%) |
| 3-Person Household | 15 (45.5%) | 18 (54.5%) |
| 4+ Person Household | 39 (69.6%) | 17 (30.4%) |
| Total Housing Units | 201 (67.2%) | 98 (32.8%) |
Occupancy by Educational Attainment in Joaquin
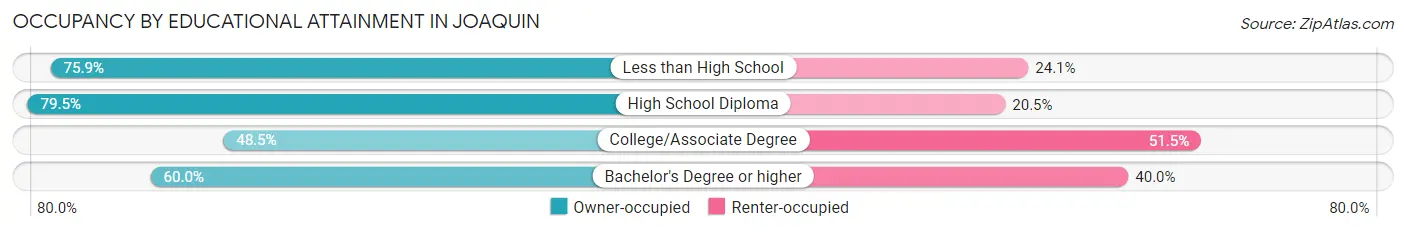
| Household Size | Owner-occupied | Renter-occupied |
| Less than High School | 44 (75.9%) | 14 (24.1%) |
| High School Diploma | 97 (79.5%) | 25 (20.5%) |
| College/Associate Degree | 48 (48.5%) | 51 (51.5%) |
| Bachelor's Degree or higher | 12 (60.0%) | 8 (40.0%) |
Occupancy by Age of Householder in Joaquin
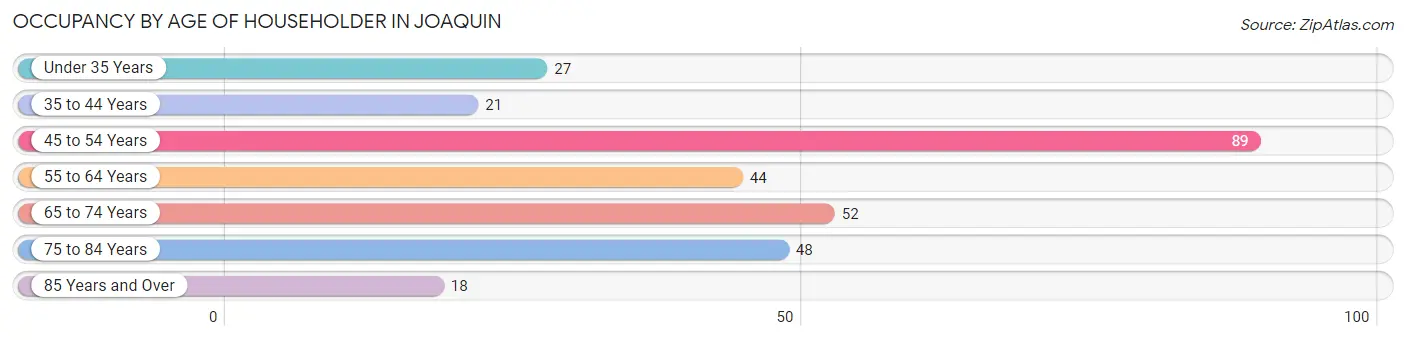
| Age Bracket | # Households | % Households |
| Under 35 Years | 27 | 9.0% |
| 35 to 44 Years | 21 | 7.0% |
| 45 to 54 Years | 89 | 29.8% |
| 55 to 64 Years | 44 | 14.7% |
| 65 to 74 Years | 52 | 17.4% |
| 75 to 84 Years | 48 | 16.1% |
| 85 Years and Over | 18 | 6.0% |
| Total | 299 | 100.0% |
Housing Finances in Joaquin
Median Income by Occupancy in Joaquin
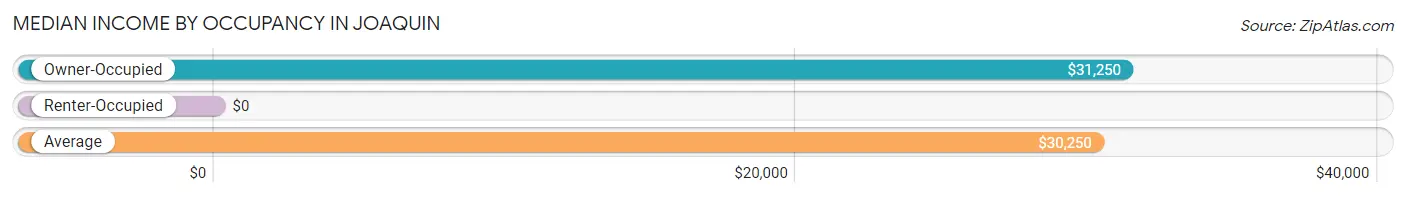
| Occupancy Type | # Households | Median Income |
| Owner-Occupied | 201 (67.2%) | $31,250 |
| Renter-Occupied | 98 (32.8%) | $0 |
| Average | 299 (100.0%) | $30,250 |
Occupancy by Householder Income Bracket in Joaquin
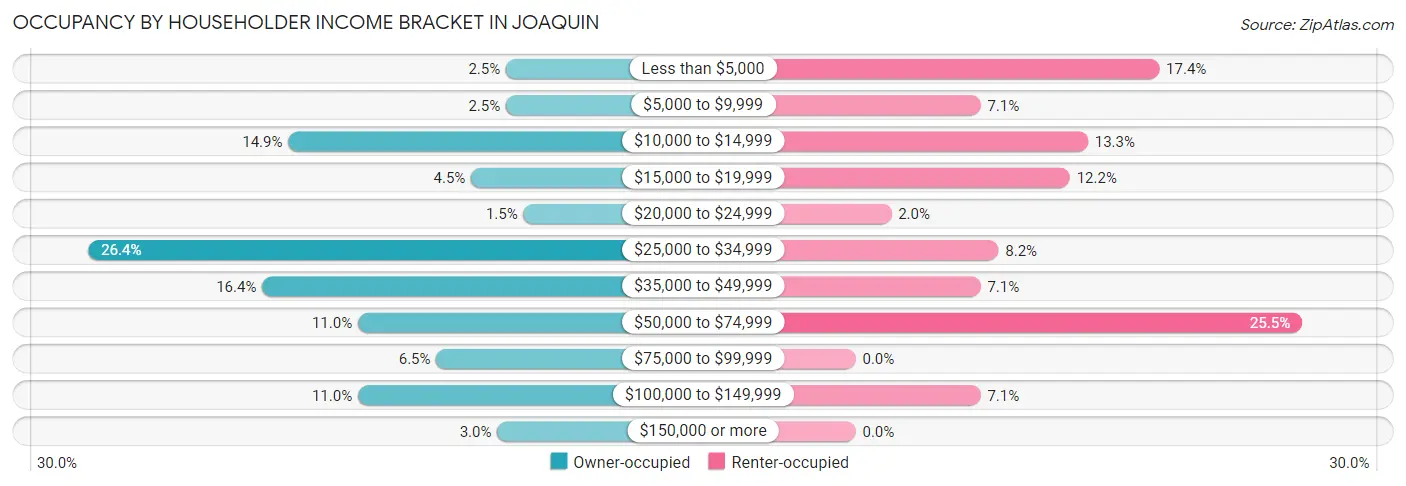
| Income Bracket | Owner-occupied | Renter-occupied |
| Less than $5,000 | 5 (2.5%) | 17 (17.3%) |
| $5,000 to $9,999 | 5 (2.5%) | 7 (7.1%) |
| $10,000 to $14,999 | 30 (14.9%) | 13 (13.3%) |
| $15,000 to $19,999 | 9 (4.5%) | 12 (12.2%) |
| $20,000 to $24,999 | 3 (1.5%) | 2 (2.0%) |
| $25,000 to $34,999 | 53 (26.4%) | 8 (8.2%) |
| $35,000 to $49,999 | 33 (16.4%) | 7 (7.1%) |
| $50,000 to $74,999 | 22 (11.0%) | 25 (25.5%) |
| $75,000 to $99,999 | 13 (6.5%) | 0 (0.0%) |
| $100,000 to $149,999 | 22 (11.0%) | 7 (7.1%) |
| $150,000 or more | 6 (3.0%) | 0 (0.0%) |
| Total | 201 (100.0%) | 98 (100.0%) |
Monthly Housing Cost Tiers in Joaquin
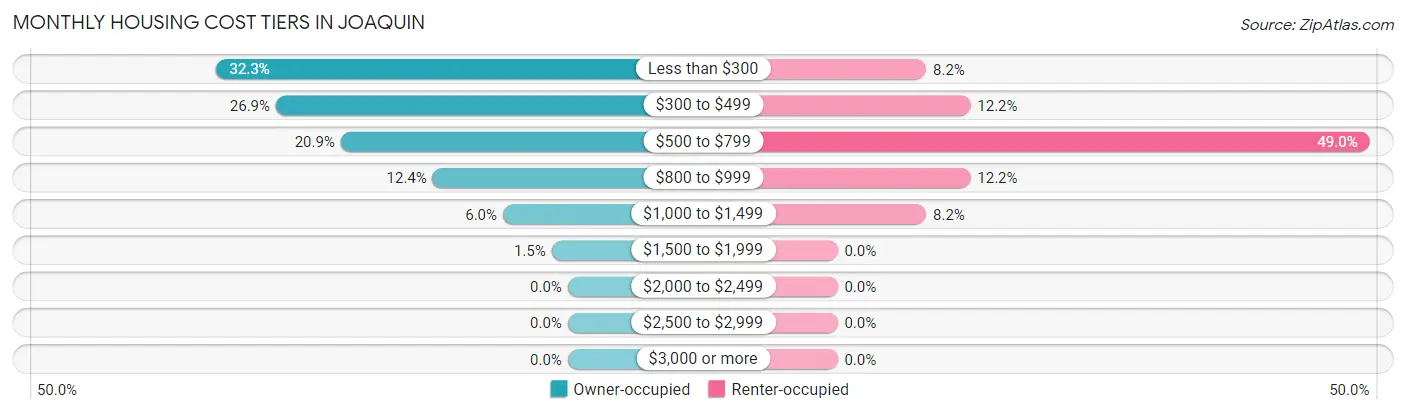
| Monthly Cost | Owner-occupied | Renter-occupied |
| Less than $300 | 65 (32.3%) | 8 (8.2%) |
| $300 to $499 | 54 (26.9%) | 12 (12.2%) |
| $500 to $799 | 42 (20.9%) | 48 (49.0%) |
| $800 to $999 | 25 (12.4%) | 12 (12.2%) |
| $1,000 to $1,499 | 12 (6.0%) | 8 (8.2%) |
| $1,500 to $1,999 | 3 (1.5%) | 0 (0.0%) |
| $2,000 to $2,499 | 0 (0.0%) | 0 (0.0%) |
| $2,500 to $2,999 | 0 (0.0%) | 0 (0.0%) |
| $3,000 or more | 0 (0.0%) | 0 (0.0%) |
| Total | 201 (100.0%) | 98 (100.0%) |
Physical Housing Characteristics in Joaquin
Housing Structures in Joaquin
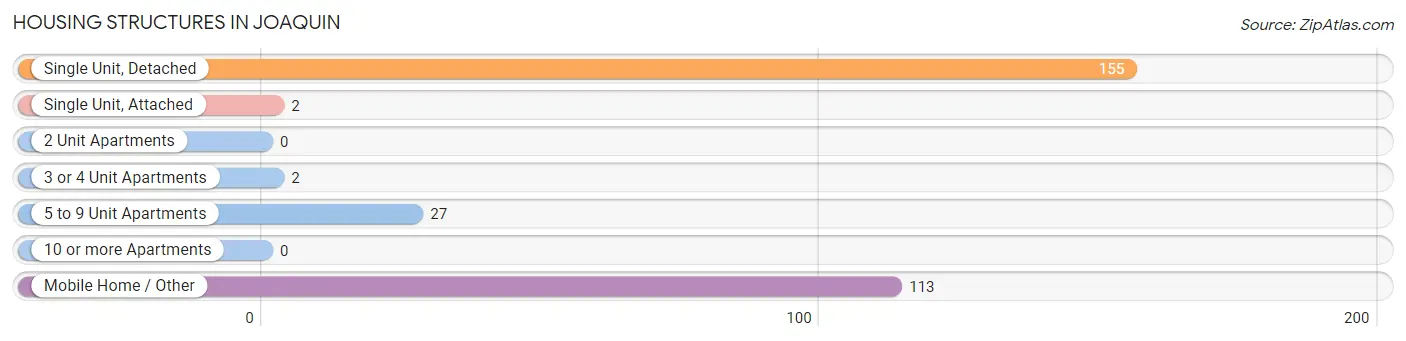
| Structure Type | # Housing Units | % Housing Units |
| Single Unit, Detached | 155 | 51.8% |
| Single Unit, Attached | 2 | 0.7% |
| 2 Unit Apartments | 0 | 0.0% |
| 3 or 4 Unit Apartments | 2 | 0.7% |
| 5 to 9 Unit Apartments | 27 | 9.0% |
| 10 or more Apartments | 0 | 0.0% |
| Mobile Home / Other | 113 | 37.8% |
| Total | 299 | 100.0% |
Housing Structures by Occupancy in Joaquin
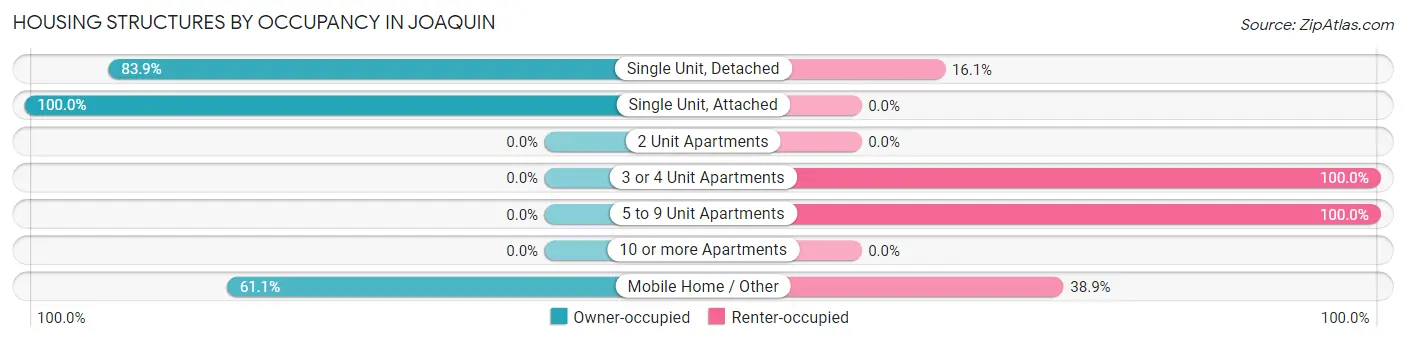
| Structure Type | Owner-occupied | Renter-occupied |
| Single Unit, Detached | 130 (83.9%) | 25 (16.1%) |
| Single Unit, Attached | 2 (100.0%) | 0 (0.0%) |
| 2 Unit Apartments | 0 (0.0%) | 0 (0.0%) |
| 3 or 4 Unit Apartments | 0 (0.0%) | 2 (100.0%) |
| 5 to 9 Unit Apartments | 0 (0.0%) | 27 (100.0%) |
| 10 or more Apartments | 0 (0.0%) | 0 (0.0%) |
| Mobile Home / Other | 69 (61.1%) | 44 (38.9%) |
| Total | 201 (67.2%) | 98 (32.8%) |
Housing Structures by Number of Rooms in Joaquin
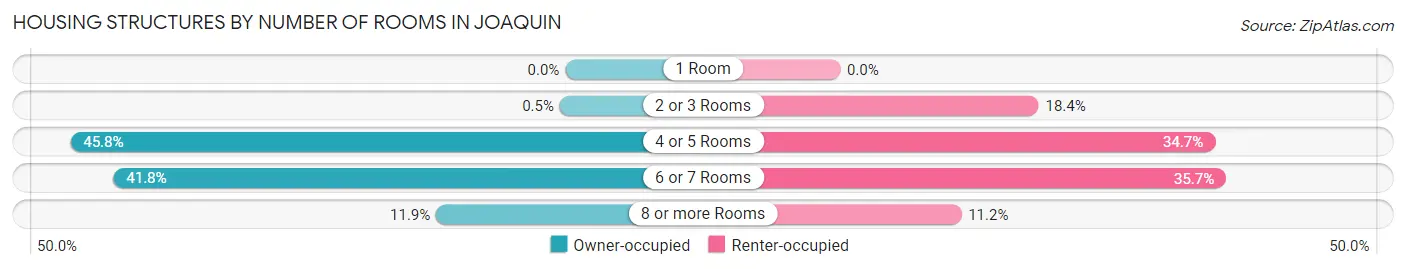
| Number of Rooms | Owner-occupied | Renter-occupied |
| 1 Room | 0 (0.0%) | 0 (0.0%) |
| 2 or 3 Rooms | 1 (0.5%) | 18 (18.4%) |
| 4 or 5 Rooms | 92 (45.8%) | 34 (34.7%) |
| 6 or 7 Rooms | 84 (41.8%) | 35 (35.7%) |
| 8 or more Rooms | 24 (11.9%) | 11 (11.2%) |
| Total | 201 (100.0%) | 98 (100.0%) |
Housing Structure by Heating Type in Joaquin
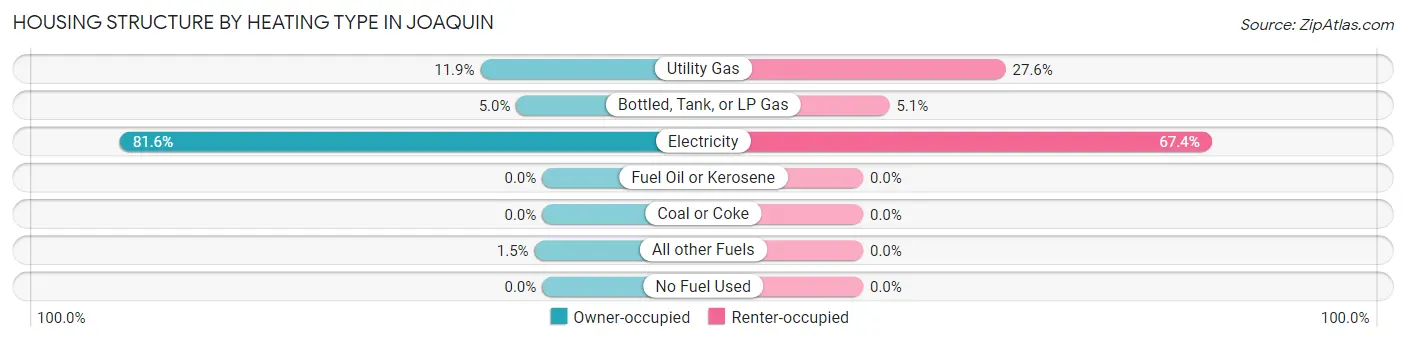
| Heating Type | Owner-occupied | Renter-occupied |
| Utility Gas | 24 (11.9%) | 27 (27.6%) |
| Bottled, Tank, or LP Gas | 10 (5.0%) | 5 (5.1%) |
| Electricity | 164 (81.6%) | 66 (67.3%) |
| Fuel Oil or Kerosene | 0 (0.0%) | 0 (0.0%) |
| Coal or Coke | 0 (0.0%) | 0 (0.0%) |
| All other Fuels | 3 (1.5%) | 0 (0.0%) |
| No Fuel Used | 0 (0.0%) | 0 (0.0%) |
| Total | 201 (100.0%) | 98 (100.0%) |
Household Vehicle Usage in Joaquin
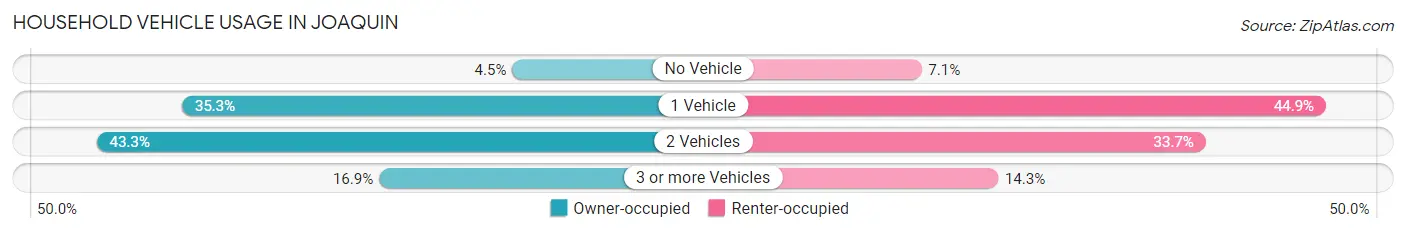
| Vehicles per Household | Owner-occupied | Renter-occupied |
| No Vehicle | 9 (4.5%) | 7 (7.1%) |
| 1 Vehicle | 71 (35.3%) | 44 (44.9%) |
| 2 Vehicles | 87 (43.3%) | 33 (33.7%) |
| 3 or more Vehicles | 34 (16.9%) | 14 (14.3%) |
| Total | 201 (100.0%) | 98 (100.0%) |
Real Estate & Mortgages in Joaquin
Real Estate and Mortgage Overview in Joaquin
| Characteristic | Without Mortgage | With Mortgage |
| Housing Units | 159 | 42 |
| Median Property Value | $49,300 | $52,000 |
| Median Household Income | $28,933 | $2 |
| Monthly Housing Costs | $336 | $0 |
| Real Estate Taxes | $367 | $3 |
Property Value by Mortgage Status in Joaquin
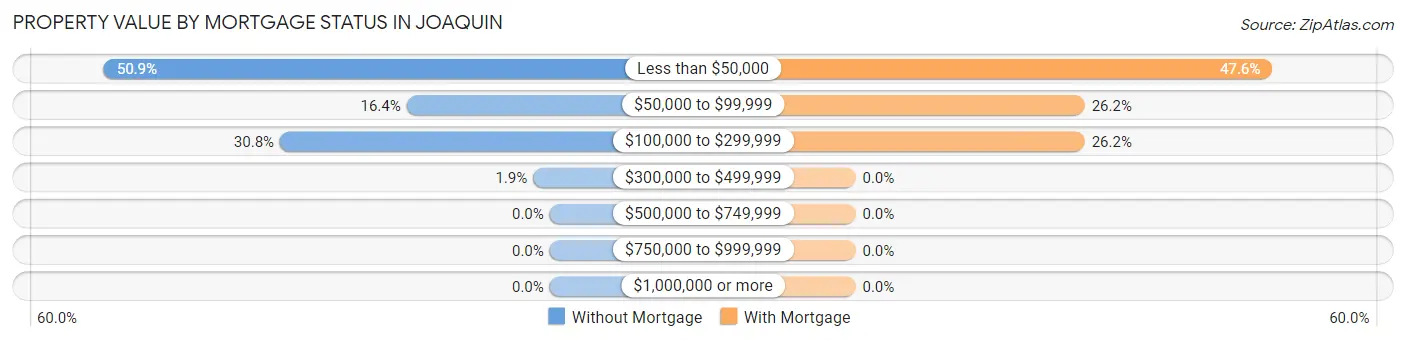
| Property Value | Without Mortgage | With Mortgage |
| Less than $50,000 | 81 (50.9%) | 20 (47.6%) |
| $50,000 to $99,999 | 26 (16.4%) | 11 (26.2%) |
| $100,000 to $299,999 | 49 (30.8%) | 11 (26.2%) |
| $300,000 to $499,999 | 3 (1.9%) | 0 (0.0%) |
| $500,000 to $749,999 | 0 (0.0%) | 0 (0.0%) |
| $750,000 to $999,999 | 0 (0.0%) | 0 (0.0%) |
| $1,000,000 or more | 0 (0.0%) | 0 (0.0%) |
| Total | 159 (100.0%) | 42 (100.0%) |
Household Income by Mortgage Status in Joaquin
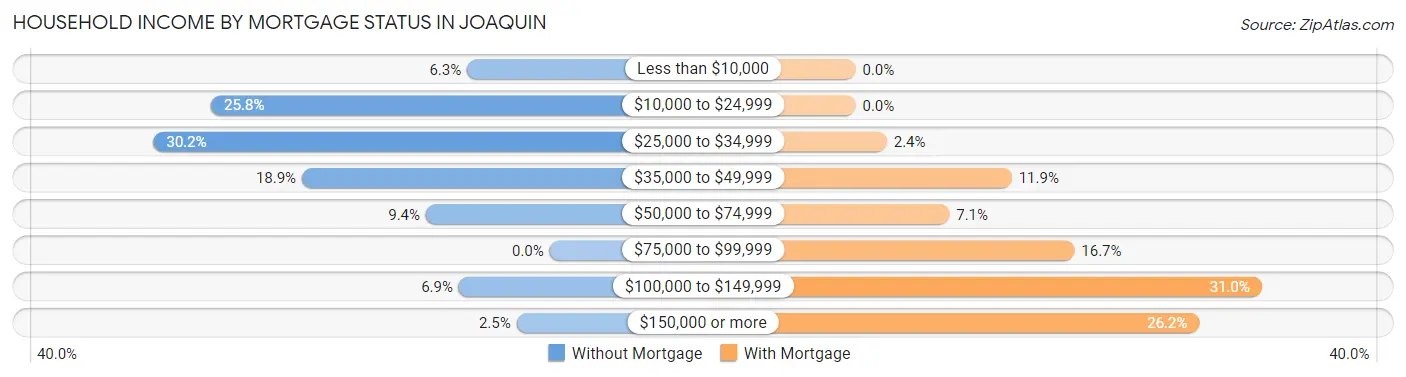
| Household Income | Without Mortgage | With Mortgage |
| Less than $10,000 | 10 (6.3%) | 0 (0.0%) |
| $10,000 to $24,999 | 41 (25.8%) | 0 (0.0%) |
| $25,000 to $34,999 | 48 (30.2%) | 1 (2.4%) |
| $35,000 to $49,999 | 30 (18.9%) | 5 (11.9%) |
| $50,000 to $74,999 | 15 (9.4%) | 3 (7.1%) |
| $75,000 to $99,999 | 0 (0.0%) | 7 (16.7%) |
| $100,000 to $149,999 | 11 (6.9%) | 13 (30.9%) |
| $150,000 or more | 4 (2.5%) | 11 (26.2%) |
| Total | 159 (100.0%) | 42 (100.0%) |
Property Value to Household Income Ratio in Joaquin
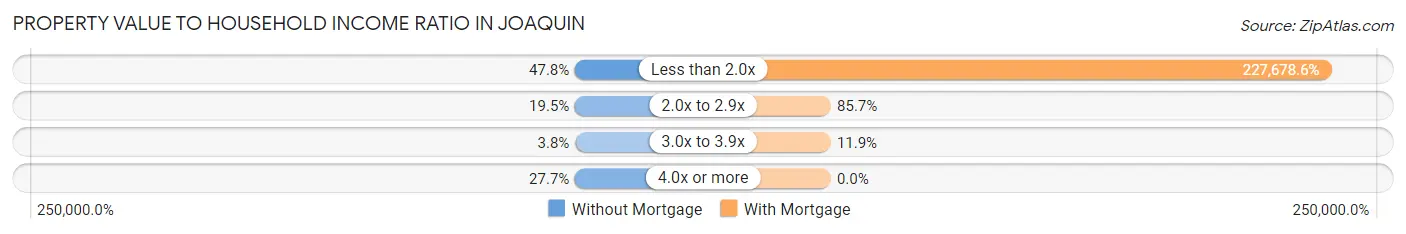
| Value-to-Income Ratio | Without Mortgage | With Mortgage |
| Less than 2.0x | 76 (47.8%) | 95,625 (227,678.6%) |
| 2.0x to 2.9x | 31 (19.5%) | 36 (85.7%) |
| 3.0x to 3.9x | 6 (3.8%) | 5 (11.9%) |
| 4.0x or more | 44 (27.7%) | 0 (0.0%) |
| Total | 159 (100.0%) | 42 (100.0%) |
Real Estate Taxes by Mortgage Status in Joaquin
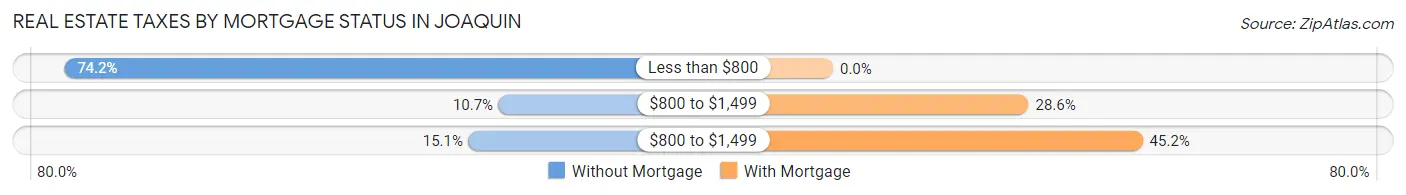
| Property Taxes | Without Mortgage | With Mortgage |
| Less than $800 | 118 (74.2%) | 0 (0.0%) |
| $800 to $1,499 | 17 (10.7%) | 12 (28.6%) |
| $800 to $1,499 | 24 (15.1%) | 19 (45.2%) |
| Total | 159 (100.0%) | 42 (100.0%) |
Health & Disability in Joaquin
Health Insurance Coverage by Age in Joaquin
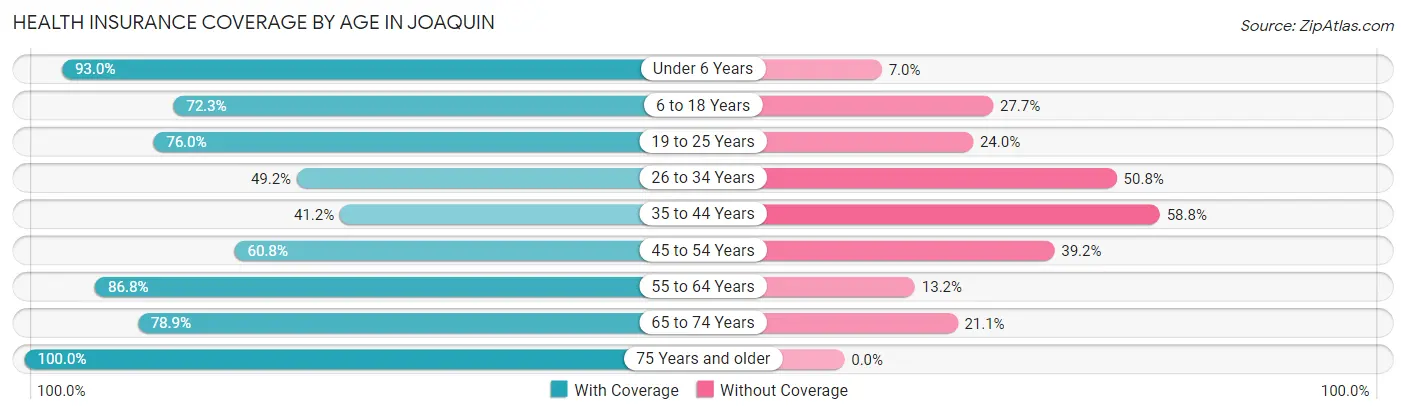
| Age Bracket | With Coverage | Without Coverage |
| Under 6 Years | 40 (93.0%) | 3 (7.0%) |
| 6 to 18 Years | 99 (72.3%) | 38 (27.7%) |
| 19 to 25 Years | 57 (76.0%) | 18 (24.0%) |
| 26 to 34 Years | 31 (49.2%) | 32 (50.8%) |
| 35 to 44 Years | 28 (41.2%) | 40 (58.8%) |
| 45 to 54 Years | 87 (60.8%) | 56 (39.2%) |
| 55 to 64 Years | 66 (86.8%) | 10 (13.2%) |
| 65 to 74 Years | 86 (78.9%) | 23 (21.1%) |
| 75 Years and older | 80 (100.0%) | 0 (0.0%) |
| Total | 574 (72.3%) | 220 (27.7%) |
Health Insurance Coverage by Citizenship Status in Joaquin
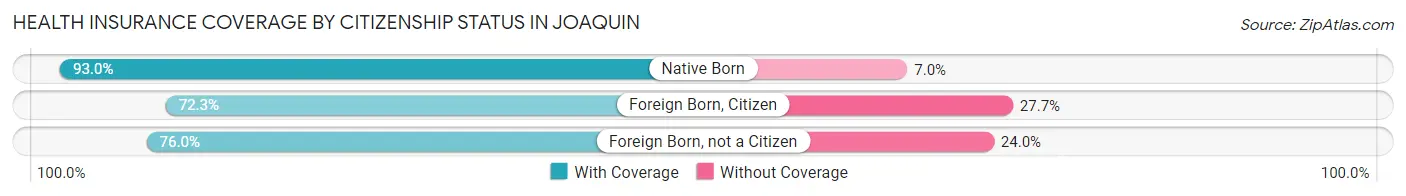
| Citizenship Status | With Coverage | Without Coverage |
| Native Born | 40 (93.0%) | 3 (7.0%) |
| Foreign Born, Citizen | 99 (72.3%) | 38 (27.7%) |
| Foreign Born, not a Citizen | 57 (76.0%) | 18 (24.0%) |
Health Insurance Coverage by Household Income in Joaquin
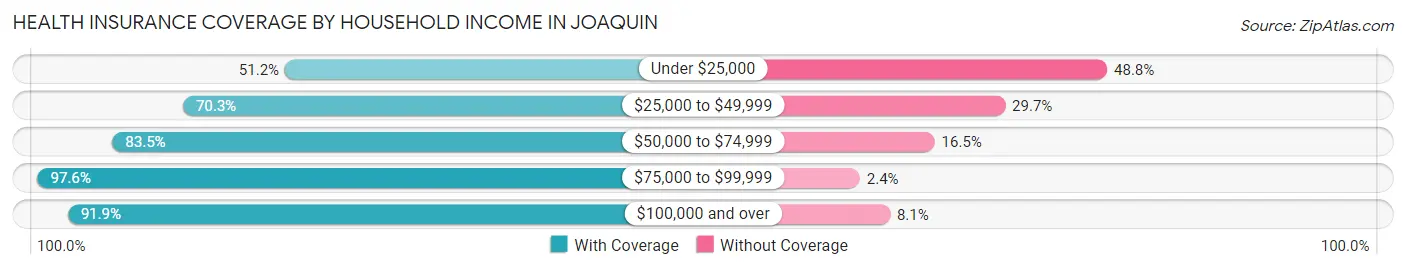
| Household Income | With Coverage | Without Coverage |
| Under $25,000 | 125 (51.2%) | 119 (48.8%) |
| $25,000 to $49,999 | 147 (70.3%) | 62 (29.7%) |
| $50,000 to $74,999 | 137 (83.5%) | 27 (16.5%) |
| $75,000 to $99,999 | 40 (97.6%) | 1 (2.4%) |
| $100,000 and over | 125 (91.9%) | 11 (8.1%) |
Public vs Private Health Insurance Coverage by Age in Joaquin
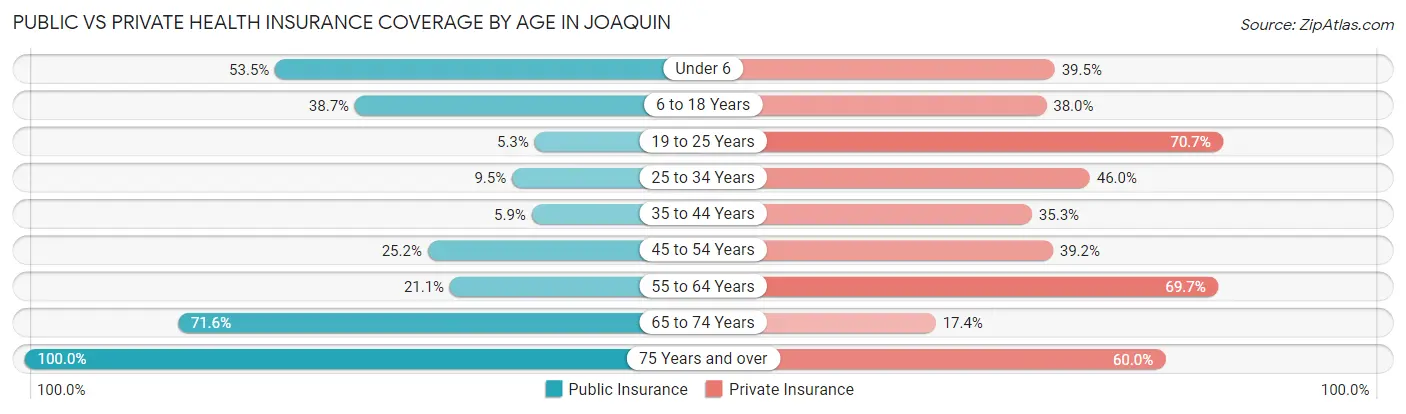
| Age Bracket | Public Insurance | Private Insurance |
| Under 6 | 23 (53.5%) | 17 (39.5%) |
| 6 to 18 Years | 53 (38.7%) | 52 (38.0%) |
| 19 to 25 Years | 4 (5.3%) | 53 (70.7%) |
| 25 to 34 Years | 6 (9.5%) | 29 (46.0%) |
| 35 to 44 Years | 4 (5.9%) | 24 (35.3%) |
| 45 to 54 Years | 36 (25.2%) | 56 (39.2%) |
| 55 to 64 Years | 16 (21.0%) | 53 (69.7%) |
| 65 to 74 Years | 78 (71.6%) | 19 (17.4%) |
| 75 Years and over | 80 (100.0%) | 48 (60.0%) |
| Total | 300 (37.8%) | 351 (44.2%) |
Disability Status by Sex by Age in Joaquin
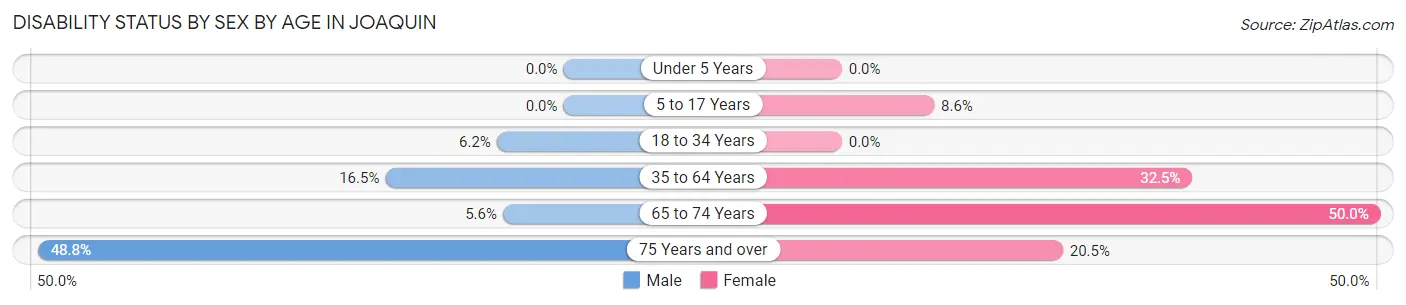
| Age Bracket | Male | Female |
| Under 5 Years | 0 (0.0%) | 0 (0.0%) |
| 5 to 17 Years | 0 (0.0%) | 3 (8.6%) |
| 18 to 34 Years | 6 (6.2%) | 0 (0.0%) |
| 35 to 64 Years | 20 (16.5%) | 54 (32.5%) |
| 65 to 74 Years | 5 (5.6%) | 10 (50.0%) |
| 75 Years and over | 20 (48.8%) | 8 (20.5%) |
Disability Class by Sex by Age in Joaquin
Disability Class: Hearing Difficulty
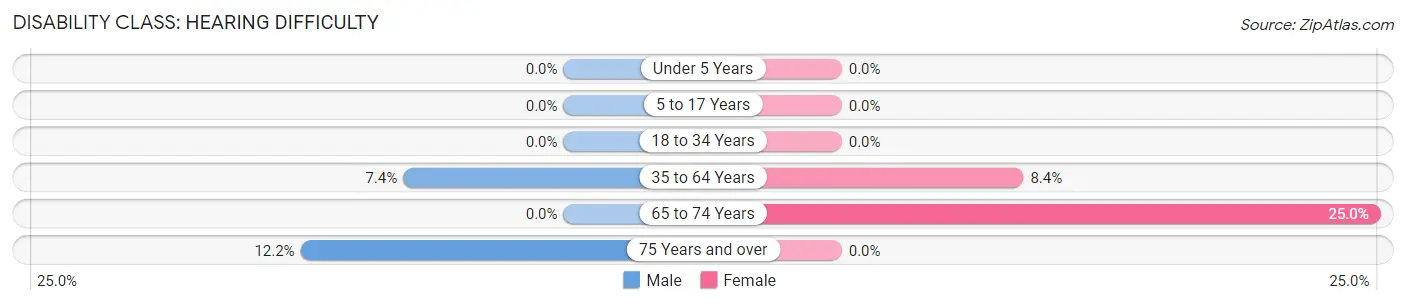
| Age Bracket | Male | Female |
| Under 5 Years | 0 (0.0%) | 0 (0.0%) |
| 5 to 17 Years | 0 (0.0%) | 0 (0.0%) |
| 18 to 34 Years | 0 (0.0%) | 0 (0.0%) |
| 35 to 64 Years | 9 (7.4%) | 14 (8.4%) |
| 65 to 74 Years | 0 (0.0%) | 5 (25.0%) |
| 75 Years and over | 5 (12.2%) | 0 (0.0%) |
Disability Class: Vision Difficulty
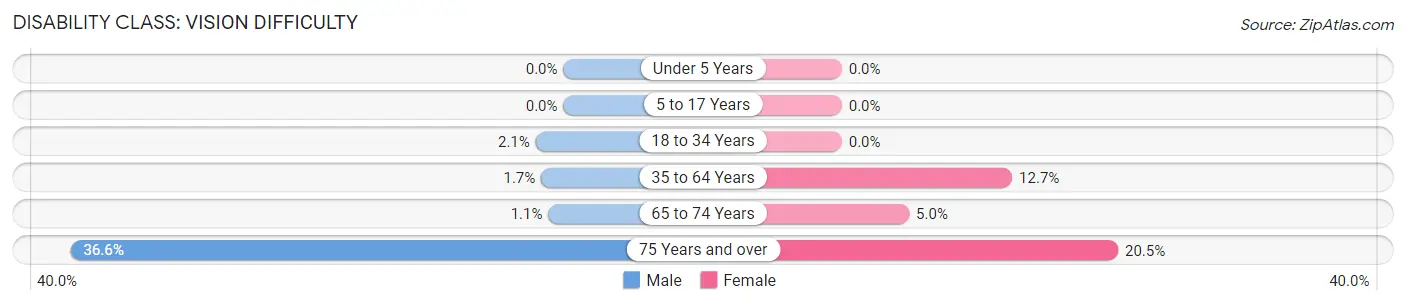
| Age Bracket | Male | Female |
| Under 5 Years | 0 (0.0%) | 0 (0.0%) |
| 5 to 17 Years | 0 (0.0%) | 0 (0.0%) |
| 18 to 34 Years | 2 (2.1%) | 0 (0.0%) |
| 35 to 64 Years | 2 (1.7%) | 21 (12.7%) |
| 65 to 74 Years | 1 (1.1%) | 1 (5.0%) |
| 75 Years and over | 15 (36.6%) | 8 (20.5%) |
Disability Class: Cognitive Difficulty
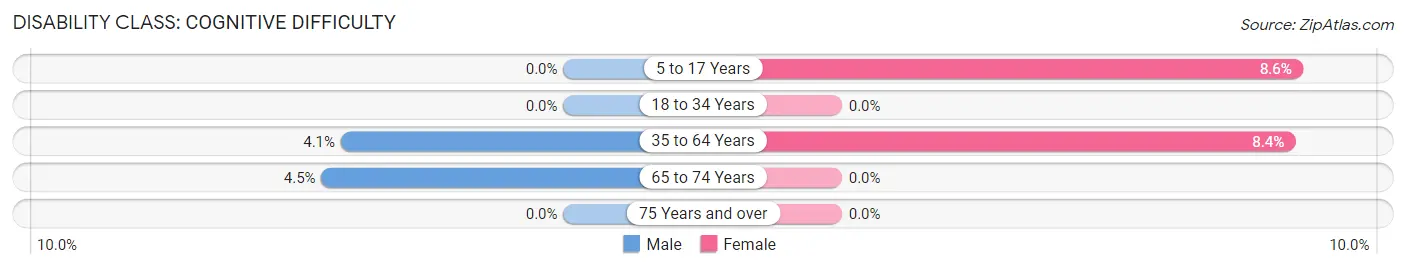
| Age Bracket | Male | Female |
| 5 to 17 Years | 0 (0.0%) | 3 (8.6%) |
| 18 to 34 Years | 0 (0.0%) | 0 (0.0%) |
| 35 to 64 Years | 5 (4.1%) | 14 (8.4%) |
| 65 to 74 Years | 4 (4.5%) | 0 (0.0%) |
| 75 Years and over | 0 (0.0%) | 0 (0.0%) |
Disability Class: Ambulatory Difficulty
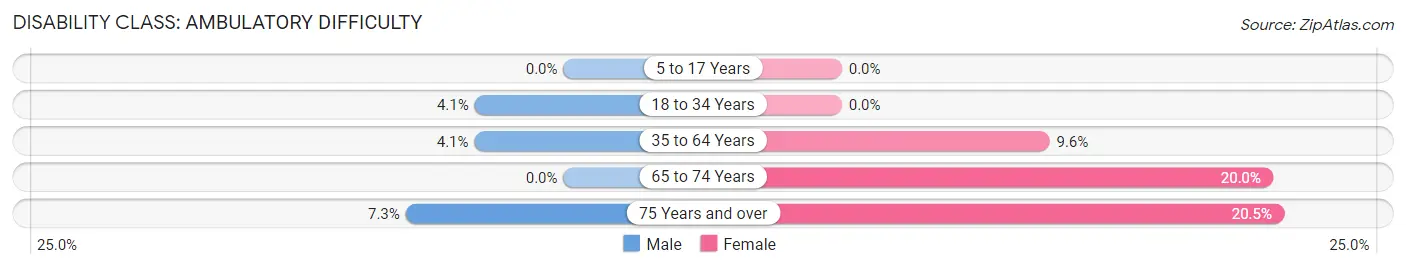
| Age Bracket | Male | Female |
| 5 to 17 Years | 0 (0.0%) | 0 (0.0%) |
| 18 to 34 Years | 4 (4.1%) | 0 (0.0%) |
| 35 to 64 Years | 5 (4.1%) | 16 (9.6%) |
| 65 to 74 Years | 0 (0.0%) | 4 (20.0%) |
| 75 Years and over | 3 (7.3%) | 8 (20.5%) |
Disability Class: Self-Care Difficulty
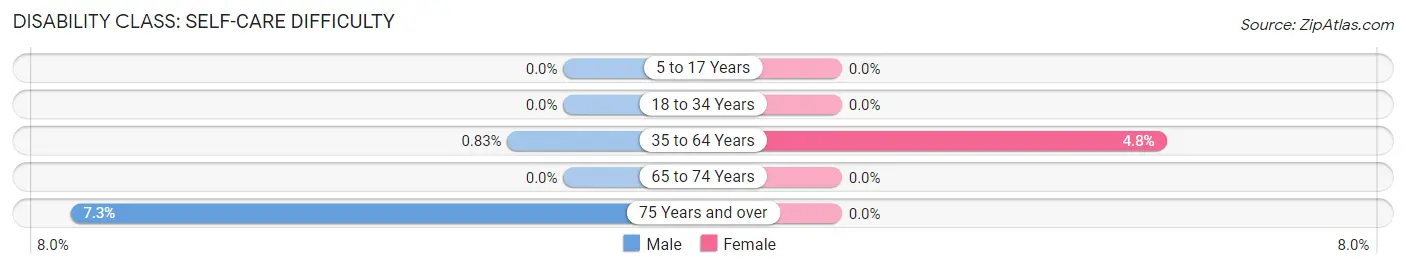
| Age Bracket | Male | Female |
| 5 to 17 Years | 0 (0.0%) | 0 (0.0%) |
| 18 to 34 Years | 0 (0.0%) | 0 (0.0%) |
| 35 to 64 Years | 1 (0.8%) | 8 (4.8%) |
| 65 to 74 Years | 0 (0.0%) | 0 (0.0%) |
| 75 Years and over | 3 (7.3%) | 0 (0.0%) |
Technology Access in Joaquin
Computing Device Access in Joaquin
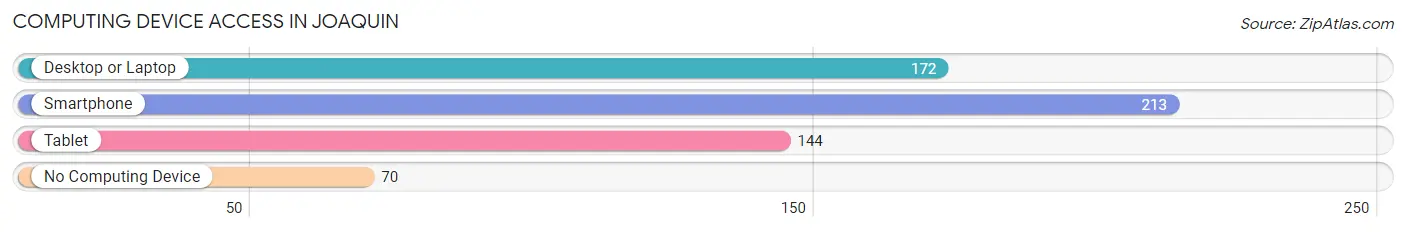
| Device Type | # Households | % Households |
| Desktop or Laptop | 172 | 57.5% |
| Smartphone | 213 | 71.2% |
| Tablet | 144 | 48.2% |
| No Computing Device | 70 | 23.4% |
| Total | 299 | 100.0% |
Internet Access in Joaquin
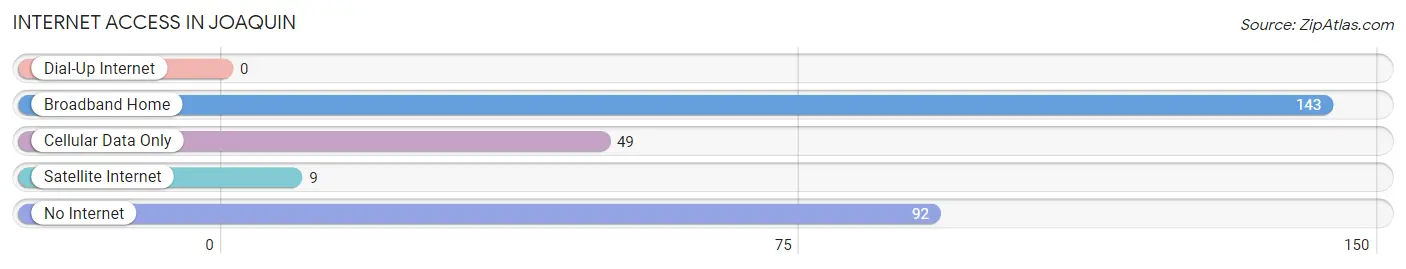
| Internet Type | # Households | % Households |
| Dial-Up Internet | 0 | 0.0% |
| Broadband Home | 143 | 47.8% |
| Cellular Data Only | 49 | 16.4% |
| Satellite Internet | 9 | 3.0% |
| No Internet | 92 | 30.8% |
| Total | 299 | 100.0% |
Joaquin Summary
Joaquin, Texas is a small town located in Shelby County, Texas. It is situated in the northeast corner of the state, about 90 miles from the Louisiana border. The town was founded in 1873 and has a population of approximately 1,000 people.
Geography
Joaquin is located in the Piney Woods region of East Texas. The town is situated on the banks of the Sabine River, which forms the border between Texas and Louisiana. The terrain is mostly flat, with some rolling hills in the area. The climate is humid subtropical, with hot summers and mild winters. The average annual temperature is around 70 degrees Fahrenheit.
Economy
The economy of Joaquin is largely based on agriculture. The town is home to several farms, which produce cotton, corn, soybeans, and other crops. There are also several timber companies in the area, which harvest pine and hardwood trees. The town also has a few small businesses, including a grocery store, a hardware store, and a few restaurants.
Demographics
As of the 2010 census, the population of Joaquin was 1,000 people. The racial makeup of the town was 95.2% White, 0.7% African American, 0.3% Native American, 0.2% Asian, 0.1% Pacific Islander, and 3.5% from other races. The median household income was $30,000, and the median family income was $35,000.
History
Joaquin was founded in 1873 by a group of settlers from Louisiana. The town was named after Joaquin de la Garza, a prominent local rancher. The town grew slowly over the years, and by the early 1900s, it had become a thriving agricultural center. In the 1920s, the town was connected to the outside world by the construction of a railroad line.
In the 1950s, the town began to decline as the local economy shifted away from agriculture. The population decreased, and many businesses closed. In the late 1970s, the town was revitalized by the construction of a new highway, which connected it to nearby towns and cities.
Today, Joaquin is a small, rural town with a population of around 1,000 people. The town is home to several small businesses, and the local economy is still largely based on agriculture. The town is also home to a few historic sites, including the Joaquin Cemetery, which dates back to the 1800s.
Common Questions
What is Per Capita Income in Joaquin?
Per Capita income in Joaquin is $19,203.
What is the Median Family Income in Joaquin?
Median Family Income in Joaquin is $35,703.
What is the Median Household income in Joaquin?
Median Household Income in Joaquin is $30,250.
What is Income or Wage Gap in Joaquin?
Income or Wage Gap in Joaquin is 15.3%.
Women in Joaquin earn 84.7 cents for every dollar earned by a man.
What is Inequality or Gini Index in Joaquin?
Inequality or Gini Index in Joaquin is 0.45.
What is the Total Population of Joaquin?
Total Population of Joaquin is 794.
What is the Total Male Population of Joaquin?
Total Male Population of Joaquin is 466.
What is the Total Female Population of Joaquin?
Total Female Population of Joaquin is 328.
What is the Ratio of Males per 100 Females in Joaquin?
There are 142.07 Males per 100 Females in Joaquin.
What is the Ratio of Females per 100 Males in Joaquin?
There are 70.39 Females per 100 Males in Joaquin.
What is the Median Population Age in Joaquin?
Median Population Age in Joaquin is 46.1 Years.
What is the Average Family Size in Joaquin
Average Family Size in Joaquin is 3.0 People.
What is the Average Household Size in Joaquin
Average Household Size in Joaquin is 2.7 People.
How Large is the Labor Force in Joaquin?
There are 357 People in the Labor Forcein in Joaquin.
What is the Percentage of People in the Labor Force in Joaquin?
53.4% of People are in the Labor Force in Joaquin.
What is the Unemployment Rate in Joaquin?
Unemployment Rate in Joaquin is 3.9%.