Cotulla, TX Map & Demographics
Cotulla Map
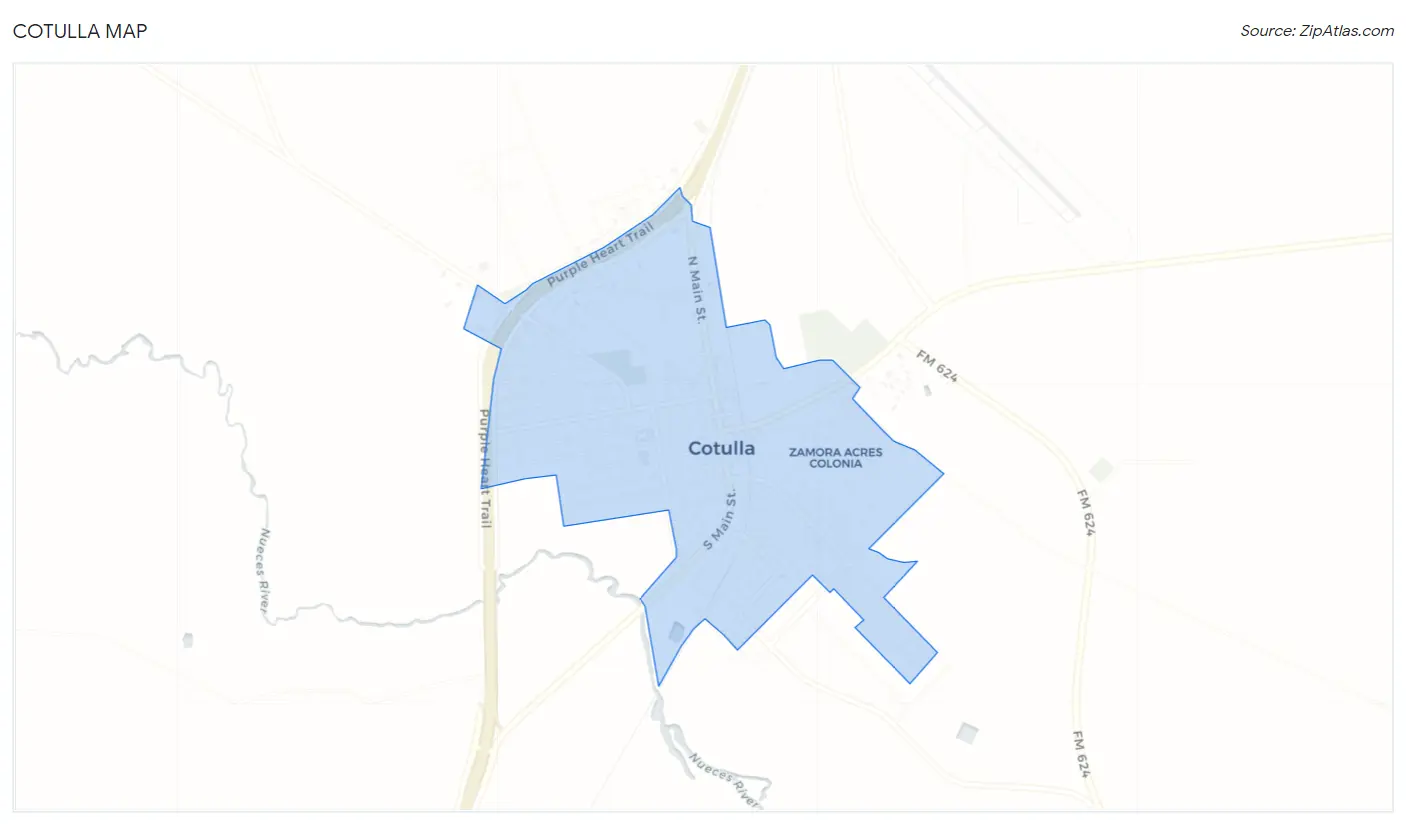
Cotulla Overview
$17,867
PER CAPITA INCOME
$55,671
AVG FAMILY INCOME
$68,431
AVG HOUSEHOLD INCOME
$8,105
FAMILY INCOME DEFICIT
0.35
INEQUALITY / GINI INDEX
3,714
TOTAL POPULATION
2,136
MALE POPULATION
1,578
FEMALE POPULATION
135.36
MALES / 100 FEMALES
73.88
FEMALES / 100 MALES
33.1
MEDIAN AGE
3.6
AVG FAMILY SIZE
3.5
AVG HOUSEHOLD SIZE
1,460
LABOR FORCE [ PEOPLE ]
52.6%
PERCENT IN LABOR FORCE
5.9%
UNEMPLOYMENT RATE
Cotulla Zip Codes
Income in Cotulla
Income Overview in Cotulla
Per Capita Income in Cotulla is $17,867, while median incomes of families and households are $55,671 and $68,431 respectively.
| Characteristic | Number | Measure |
| Per Capita Income | 3,714 | $17,867 |
| Median Family Income | 868 | $55,671 |
| Mean Family Income | 868 | $55,573 |
| Median Household Income | 1,060 | $68,431 |
| Mean Household Income | 1,060 | $63,610 |
| Income Deficit | 868 | $8,105 |
| Wage / Income Gap (%) | 3,714 | 0.00% |
| Wage / Income Gap ($) | 3,714 | 100.00¢ per $1 |
| Gini / Inequality Index | 3,714 | 0.35 |
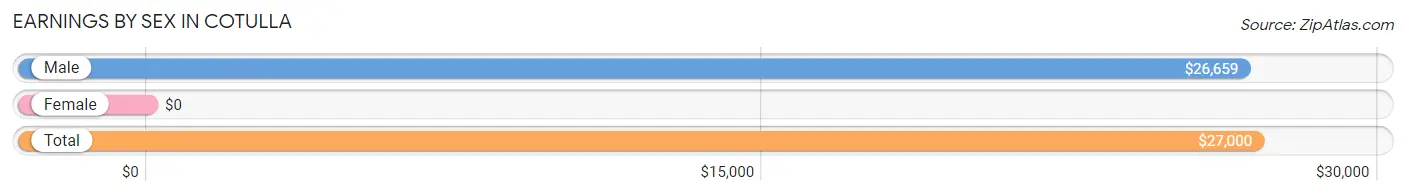
Earnings by Sex in Cotulla
| Sex | Number | Average Earnings |
| Male | 1,019 (70.6%) | $26,659 |
| Female | 425 (29.4%) | $0 |
| Total | 1,444 (100.0%) | $27,000 |
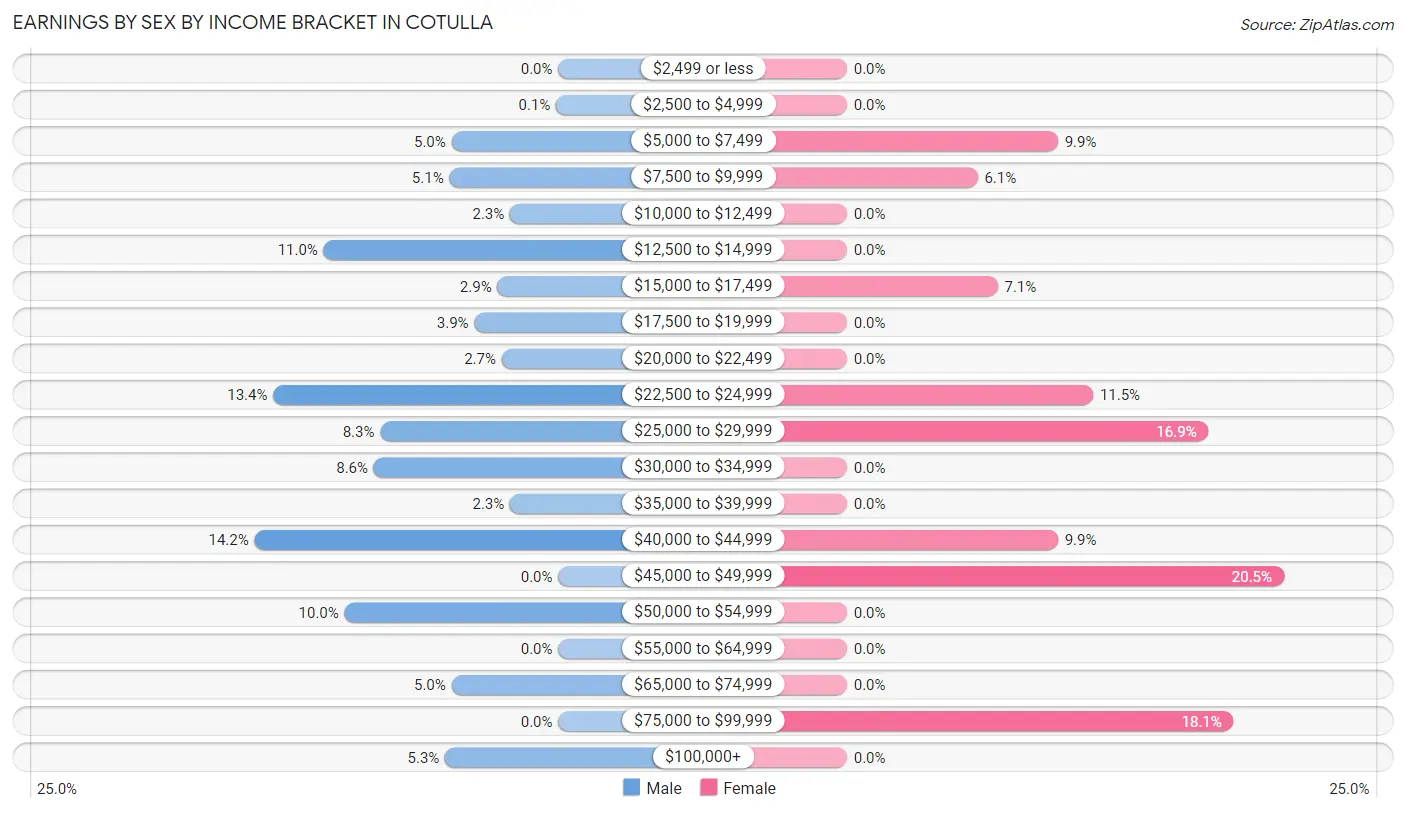
Earnings by Sex by Income Bracket in Cotulla
The most common earnings brackets in Cotulla are $40,000 to $44,999 for men (145 | 14.2%) and $45,000 to $49,999 for women (87 | 20.5%).
| Income | Male | Female |
| $2,499 or less | 0 (0.0%) | 0 (0.0%) |
| $2,500 to $4,999 | 1 (0.1%) | 0 (0.0%) |
| $5,000 to $7,499 | 51 (5.0%) | 42 (9.9%) |
| $7,500 to $9,999 | 52 (5.1%) | 26 (6.1%) |
| $10,000 to $12,499 | 23 (2.3%) | 0 (0.0%) |
| $12,500 to $14,999 | 112 (11.0%) | 0 (0.0%) |
| $15,000 to $17,499 | 29 (2.9%) | 30 (7.1%) |
| $17,500 to $19,999 | 40 (3.9%) | 0 (0.0%) |
| $20,000 to $22,499 | 27 (2.6%) | 0 (0.0%) |
| $22,500 to $24,999 | 136 (13.4%) | 49 (11.5%) |
| $25,000 to $29,999 | 85 (8.3%) | 72 (16.9%) |
| $30,000 to $34,999 | 88 (8.6%) | 0 (0.0%) |
| $35,000 to $39,999 | 23 (2.3%) | 0 (0.0%) |
| $40,000 to $44,999 | 145 (14.2%) | 42 (9.9%) |
| $45,000 to $49,999 | 0 (0.0%) | 87 (20.5%) |
| $50,000 to $54,999 | 102 (10.0%) | 0 (0.0%) |
| $55,000 to $64,999 | 0 (0.0%) | 0 (0.0%) |
| $65,000 to $74,999 | 51 (5.0%) | 0 (0.0%) |
| $75,000 to $99,999 | 0 (0.0%) | 77 (18.1%) |
| $100,000+ | 54 (5.3%) | 0 (0.0%) |
| Total | 1,019 (100.0%) | 425 (100.0%) |
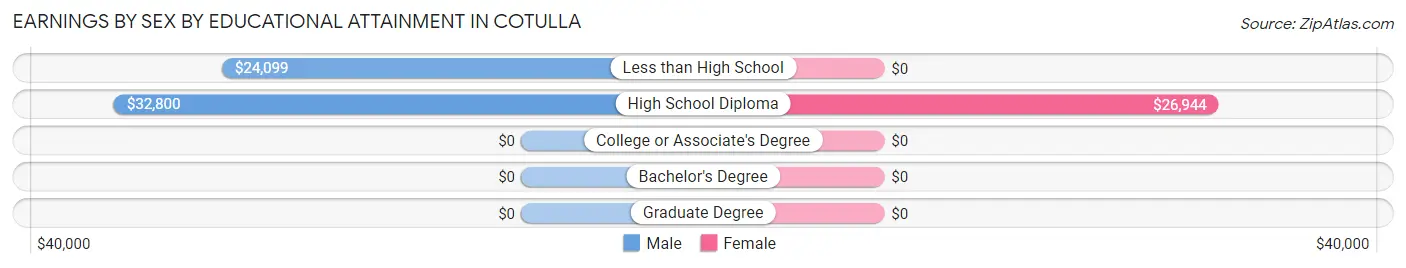
Earnings by Sex by Educational Attainment in Cotulla
| Educational Attainment | Male Income | Female Income |
| Less than High School | $24,099 | $0 |
| High School Diploma | $32,800 | $26,944 |
| College or Associate's Degree | - | - |
| Bachelor's Degree | - | - |
| Graduate Degree | - | - |
| Total | $26,789 | $0 |
Family Income in Cotulla
Family Income Brackets in Cotulla
According to the Cotulla family income data, there are 301 families falling into the $75,000 to $99,999 income range, which is the most common income bracket and makes up 34.7% of all families.
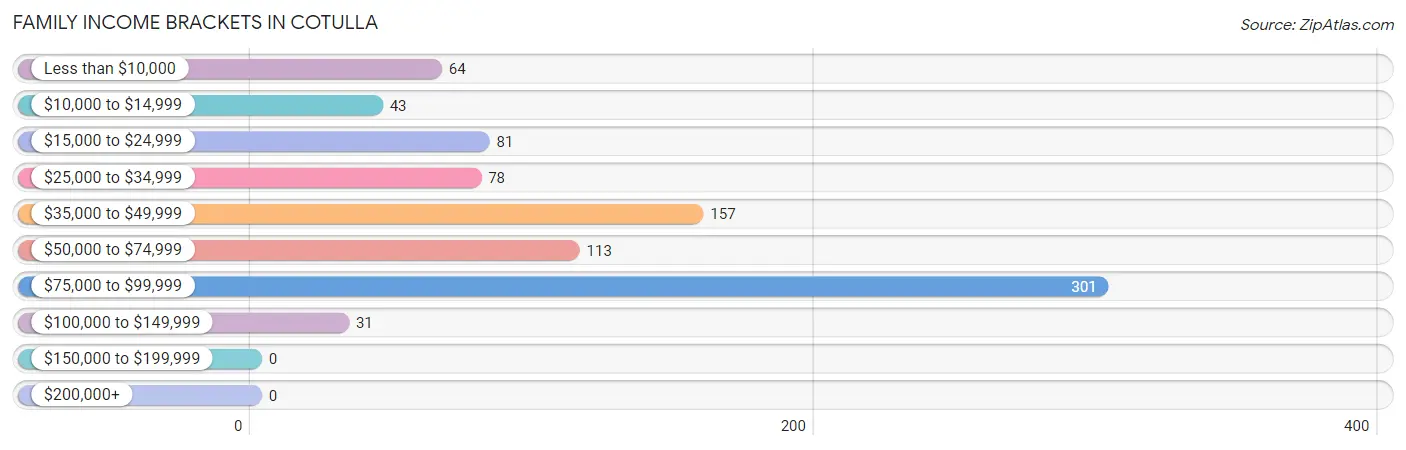
| Income Bracket | # Families | % Families |
| Less than $10,000 | 64 | 7.4% |
| $10,000 to $14,999 | 43 | 5.0% |
| $15,000 to $24,999 | 81 | 9.3% |
| $25,000 to $34,999 | 78 | 9.0% |
| $35,000 to $49,999 | 157 | 18.1% |
| $50,000 to $74,999 | 113 | 13.0% |
| $75,000 to $99,999 | 301 | 34.7% |
| $100,000 to $149,999 | 31 | 3.6% |
| $150,000 to $199,999 | 0 | 0.0% |
| $200,000+ | 0 | 0.0% |
Family Income by Famaliy Size in Cotulla
3-person families (345 | 39.8%) account for the highest median family income in Cotulla with $44,957 per family, while 3-person families (345 | 39.8%) have the highest median income of $14,986 per family member.
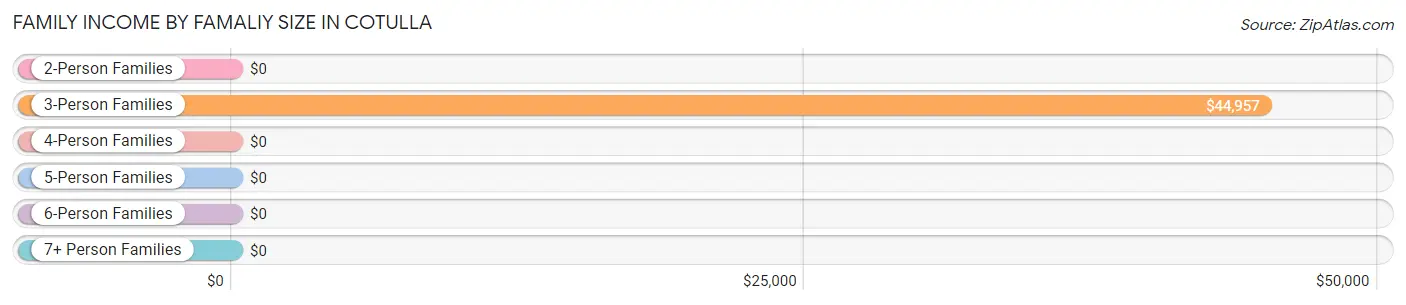
| Income Bracket | # Families | Median Income |
| 2-Person Families | 239 (27.5%) | $0 |
| 3-Person Families | 345 (39.8%) | $44,957 |
| 4-Person Families | 114 (13.1%) | $0 |
| 5-Person Families | 170 (19.6%) | $0 |
| 6-Person Families | 0 (0.0%) | $0 |
| 7+ Person Families | 0 (0.0%) | $0 |
| Total | 868 (100.0%) | $55,671 |
Family Income by Number of Earners in Cotulla
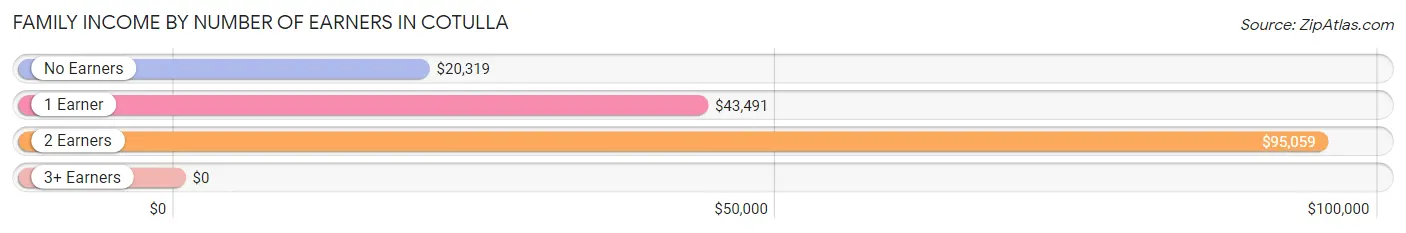
| Number of Earners | # Families | Median Income |
| No Earners | 113 (13.0%) | $20,319 |
| 1 Earner | 445 (51.3%) | $43,491 |
| 2 Earners | 310 (35.7%) | $95,059 |
| 3+ Earners | 0 (0.0%) | $0 |
| Total | 868 (100.0%) | $55,671 |
Household Income in Cotulla
Household Income Brackets in Cotulla
With 305 households falling in the category, the $75,000 to $99,999 income range is the most frequent in Cotulla, accounting for 28.8% of all households.
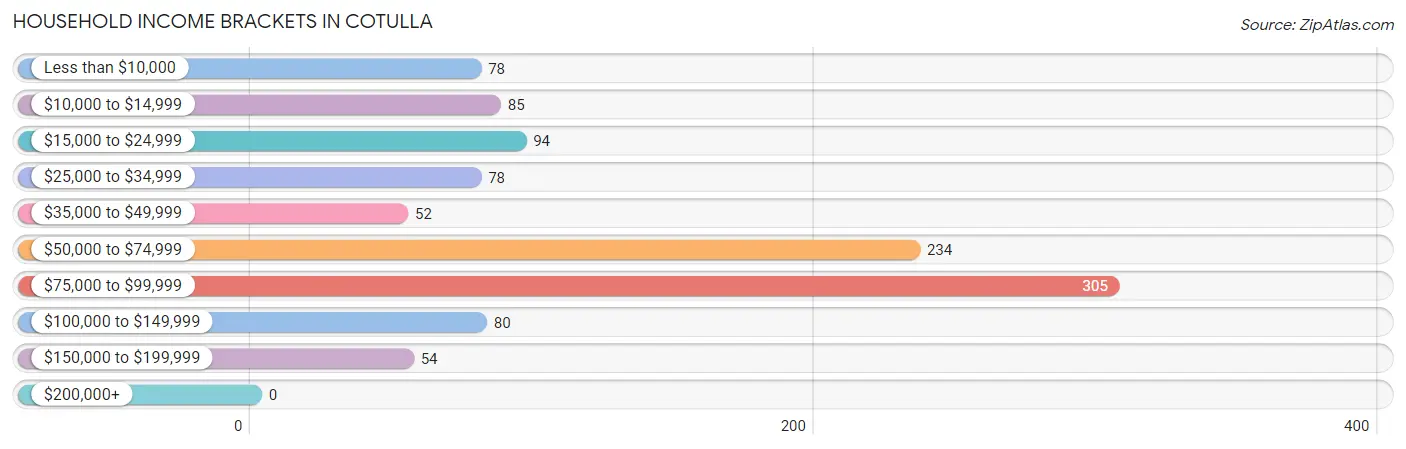
| Income Bracket | # Households | % Households |
| Less than $10,000 | 78 | 7.4% |
| $10,000 to $14,999 | 85 | 8.0% |
| $15,000 to $24,999 | 94 | 8.9% |
| $25,000 to $34,999 | 78 | 7.4% |
| $35,000 to $49,999 | 52 | 4.9% |
| $50,000 to $74,999 | 234 | 22.1% |
| $75,000 to $99,999 | 305 | 28.8% |
| $100,000 to $149,999 | 80 | 7.5% |
| $150,000 to $199,999 | 54 | 5.1% |
| $200,000+ | 0 | 0.0% |
Household Income by Householder Age in Cotulla
The median household income in Cotulla is $68,431, with the highest median household income of $79,641 found in the 45 to 64 years age bracket for the primary householder. A total of 301 households (28.4%) fall into this category. Meanwhile, the 15 to 24 years age bracket for the primary householder has the lowest median household income of $0, with 6 households (0.6%) in this group.
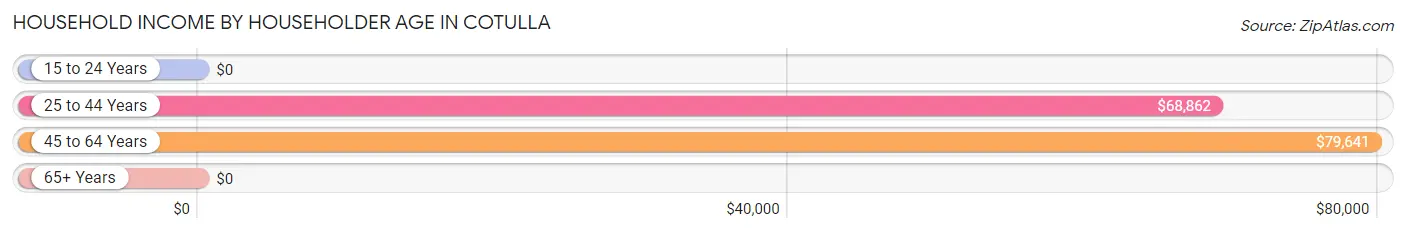
| Income Bracket | # Households | Median Income |
| 15 to 24 Years | 6 (0.6%) | $0 |
| 25 to 44 Years | 450 (42.4%) | $68,862 |
| 45 to 64 Years | 301 (28.4%) | $79,641 |
| 65+ Years | 303 (28.6%) | $0 |
| Total | 1,060 (100.0%) | $68,431 |
Poverty in Cotulla
Income Below Poverty by Sex and Age in Cotulla
With 32.7% poverty level for males and 42.1% for females among the residents of Cotulla, 12 to 14 year old males and 15 year old females are the most vulnerable to poverty, with 47 males (100.0%) and 26 females (100.0%) in their respective age groups living below the poverty level.
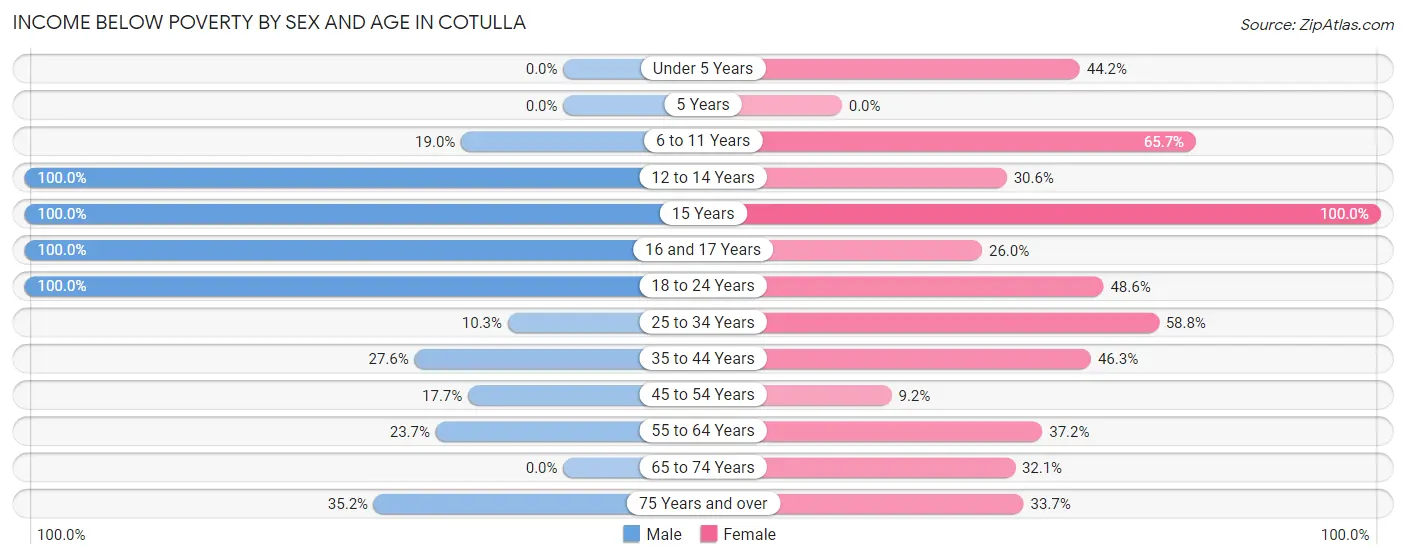
| Age Bracket | Male | Female |
| Under 5 Years | 0 (0.0%) | 38 (44.2%) |
| 5 Years | 0 (0.0%) | 0 (0.0%) |
| 6 to 11 Years | 66 (19.0%) | 140 (65.7%) |
| 12 to 14 Years | 47 (100.0%) | 30 (30.6%) |
| 15 Years | 91 (100.0%) | 26 (100.0%) |
| 16 and 17 Years | 24 (100.0%) | 25 (26.0%) |
| 18 to 24 Years | 251 (100.0%) | 68 (48.6%) |
| 25 to 34 Years | 52 (10.3%) | 60 (58.8%) |
| 35 to 44 Years | 50 (27.6%) | 111 (46.3%) |
| 45 to 54 Years | 29 (17.7%) | 12 (9.2%) |
| 55 to 64 Years | 45 (23.7%) | 48 (37.2%) |
| 65 to 74 Years | 0 (0.0%) | 45 (32.1%) |
| 75 Years and over | 32 (35.2%) | 56 (33.7%) |
| Total | 687 (32.7%) | 659 (42.1%) |
Income Above Poverty by Sex and Age in Cotulla
According to the poverty statistics in Cotulla, males aged under 5 years and females aged 45 to 54 years are the age groups that are most secure financially, with 100.0% of males and 90.8% of females in these age groups living above the poverty line.
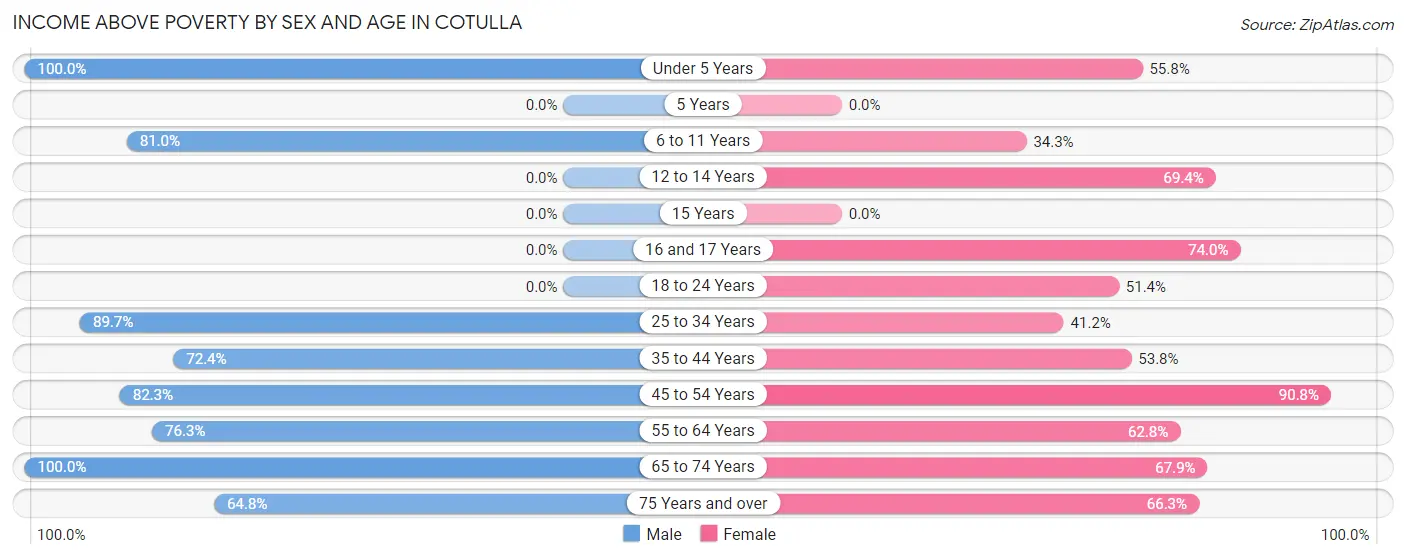
| Age Bracket | Male | Female |
| Under 5 Years | 29 (100.0%) | 48 (55.8%) |
| 5 Years | 0 (0.0%) | 0 (0.0%) |
| 6 to 11 Years | 282 (81.0%) | 73 (34.3%) |
| 12 to 14 Years | 0 (0.0%) | 68 (69.4%) |
| 15 Years | 0 (0.0%) | 0 (0.0%) |
| 16 and 17 Years | 0 (0.0%) | 71 (74.0%) |
| 18 to 24 Years | 0 (0.0%) | 72 (51.4%) |
| 25 to 34 Years | 453 (89.7%) | 42 (41.2%) |
| 35 to 44 Years | 131 (72.4%) | 129 (53.7%) |
| 45 to 54 Years | 135 (82.3%) | 118 (90.8%) |
| 55 to 64 Years | 145 (76.3%) | 81 (62.8%) |
| 65 to 74 Years | 181 (100.0%) | 95 (67.9%) |
| 75 Years and over | 59 (64.8%) | 110 (66.3%) |
| Total | 1,415 (67.3%) | 907 (57.9%) |
Income Below Poverty Among Married-Couple Families in Cotulla
The poverty statistics for married-couple families in Cotulla show that 22.4% or 127 of the total 567 families live below the poverty line. Families with no children have the highest poverty rate of 22.6%, comprising of 77 families. On the other hand, families with 1 or 2 children have the lowest poverty rate of 22.1%, which includes 50 families.
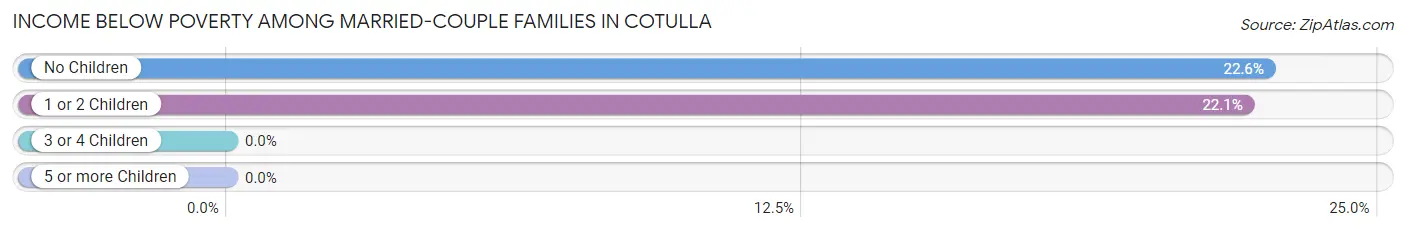
| Children | Above Poverty | Below Poverty |
| No Children | 264 (77.4%) | 77 (22.6%) |
| 1 or 2 Children | 176 (77.9%) | 50 (22.1%) |
| 3 or 4 Children | 0 (0.0%) | 0 (0.0%) |
| 5 or more Children | 0 (0.0%) | 0 (0.0%) |
| Total | 440 (77.6%) | 127 (22.4%) |
Income Below Poverty Among Single-Parent Households in Cotulla
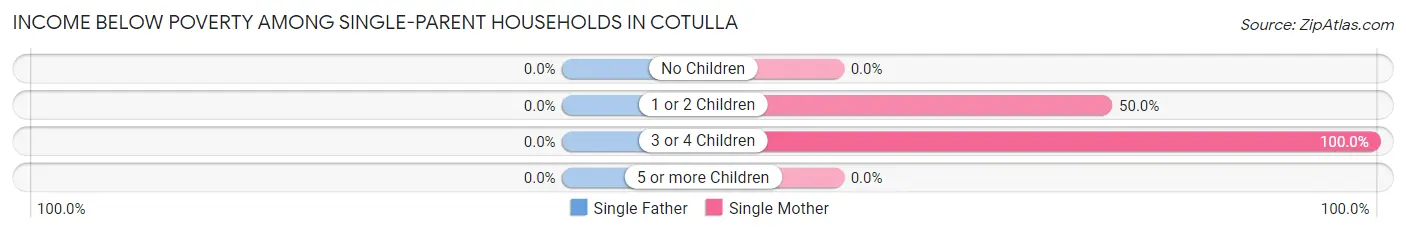
| Children | Single Father | Single Mother |
| No Children | 0 (0.0%) | 0 (0.0%) |
| 1 or 2 Children | 0 (0.0%) | 42 (50.0%) |
| 3 or 4 Children | 0 (0.0%) | 46 (100.0%) |
| 5 or more Children | 0 (0.0%) | 0 (0.0%) |
| Total | 0 (0.0%) | 88 (67.7%) |
Income Below Poverty Among Married-Couple vs Single-Parent Households in Cotulla
The poverty data for Cotulla shows that 127 of the married-couple family households (22.4%) and 88 of the single-parent households (29.2%) are living below the poverty level. Within the married-couple family households, those with no children have the highest poverty rate, with 77 households (22.6%) falling below the poverty line. Among the single-parent households, those with 3 or 4 children have the highest poverty rate, with 46 household (100.0%) living below poverty.
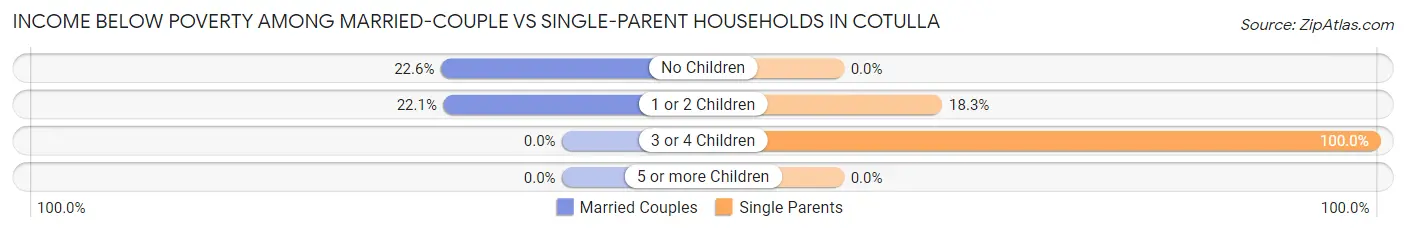
| Children | Married-Couple Families | Single-Parent Households |
| No Children | 77 (22.6%) | 0 (0.0%) |
| 1 or 2 Children | 50 (22.1%) | 42 (18.3%) |
| 3 or 4 Children | 0 (0.0%) | 46 (100.0%) |
| 5 or more Children | 0 (0.0%) | 0 (0.0%) |
| Total | 127 (22.4%) | 88 (29.2%) |
Race in Cotulla
The most populous races in Cotulla are Hispanic or Latino (3,585 | 96.5%), White / Caucasian (1,863 | 50.2%), and Two or more Races (1,141 | 30.7%).
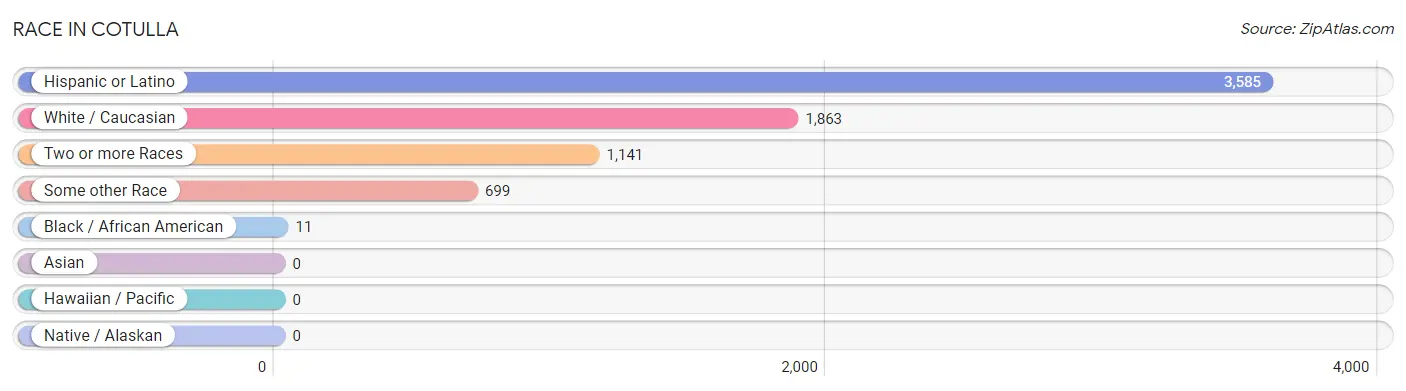
| Race | # Population | % Population |
| Asian | 0 | 0.0% |
| Black / African American | 11 | 0.3% |
| Hawaiian / Pacific | 0 | 0.0% |
| Hispanic or Latino | 3,585 | 96.5% |
| Native / Alaskan | 0 | 0.0% |
| White / Caucasian | 1,863 | 50.2% |
| Two or more Races | 1,141 | 30.7% |
| Some other Race | 699 | 18.8% |
| Total | 3,714 | 100.0% |
Ancestry in Cotulla
The most populous ancestries reported in Cotulla are Mexican (3,294 | 88.7%), American (321 | 8.6%), Spaniard (86 | 2.3%), German (63 | 1.7%), and Danish (54 | 1.5%), together accounting for 102.8% of all Cotulla residents.
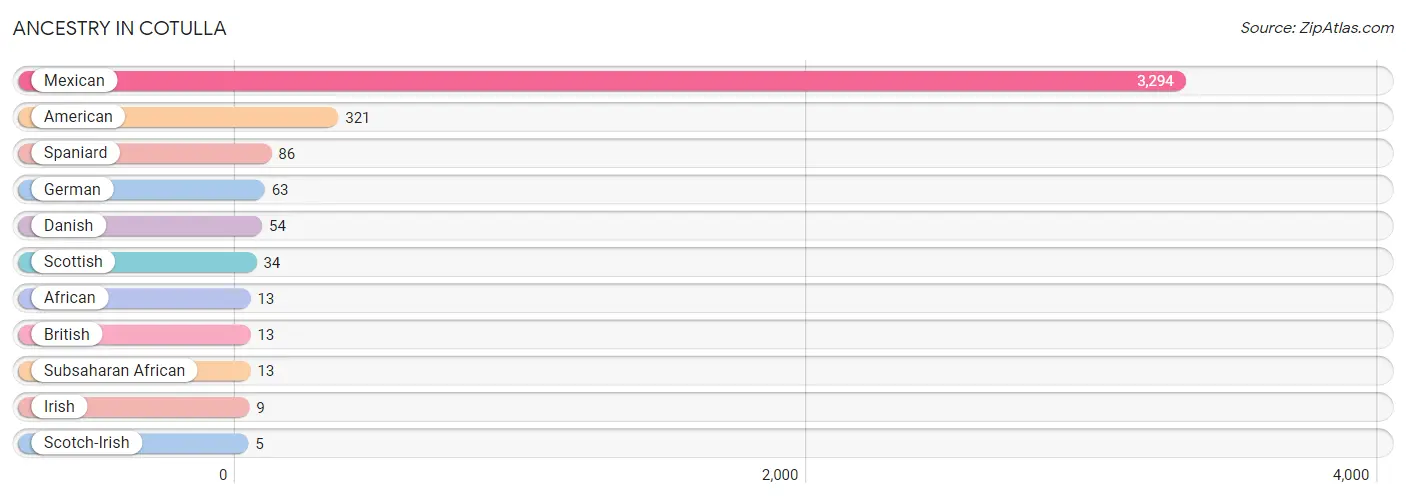
| Ancestry | # Population | % Population |
| African | 13 | 0.4% |
| American | 321 | 8.6% |
| British | 13 | 0.4% |
| Danish | 54 | 1.5% |
| German | 63 | 1.7% |
| Irish | 9 | 0.2% |
| Mexican | 3,294 | 88.7% |
| Scotch-Irish | 5 | 0.1% |
| Scottish | 34 | 0.9% |
| Spaniard | 86 | 2.3% |
| Subsaharan African | 13 | 0.4% | View All 11 Rows |
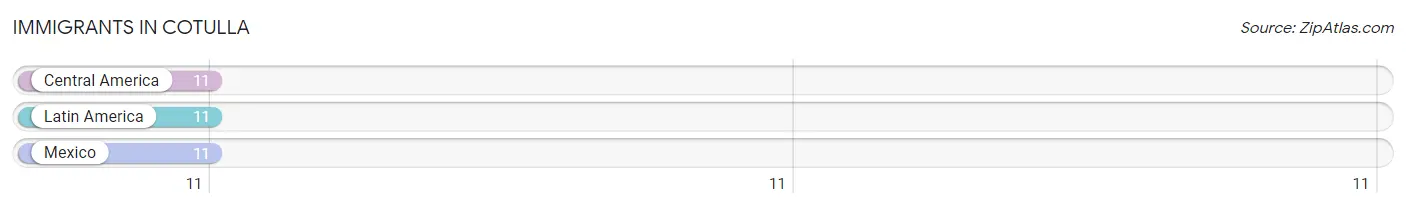
Immigrants in Cotulla
The most numerous immigrant groups reported in Cotulla came from Central America (11 | 0.3%), Latin America (11 | 0.3%), and Mexico (11 | 0.3%), together accounting for 0.9% of all Cotulla residents.
| Immigration Origin | # Population | % Population |
| Central America | 11 | 0.3% |
| Latin America | 11 | 0.3% |
| Mexico | 11 | 0.3% | View All 3 Rows |
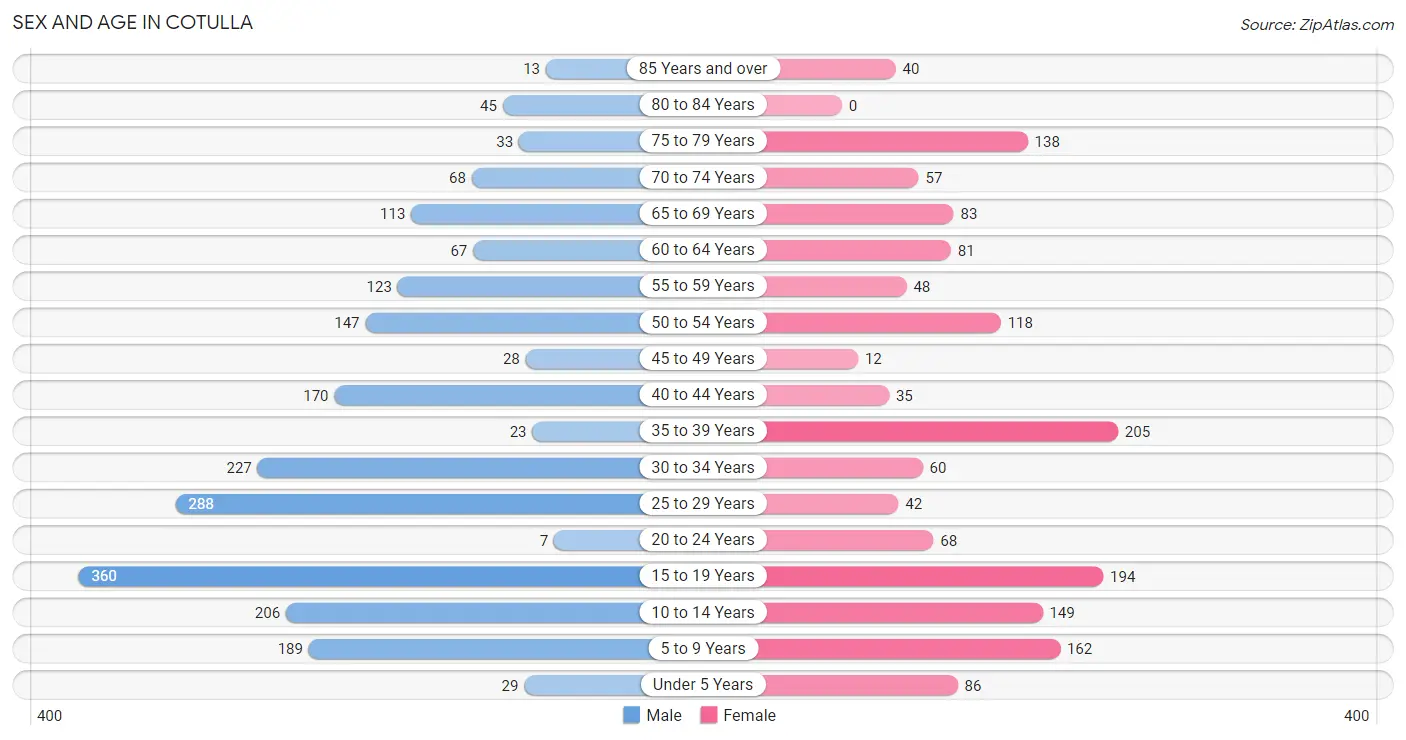
Sex and Age in Cotulla
Sex and Age in Cotulla
The most populous age groups in Cotulla are 15 to 19 Years (360 | 16.9%) for men and 35 to 39 Years (205 | 13.0%) for women.
| Age Bracket | Male | Female |
| Under 5 Years | 29 (1.4%) | 86 (5.4%) |
| 5 to 9 Years | 189 (8.8%) | 162 (10.3%) |
| 10 to 14 Years | 206 (9.6%) | 149 (9.4%) |
| 15 to 19 Years | 360 (16.9%) | 194 (12.3%) |
| 20 to 24 Years | 7 (0.3%) | 68 (4.3%) |
| 25 to 29 Years | 288 (13.5%) | 42 (2.7%) |
| 30 to 34 Years | 227 (10.6%) | 60 (3.8%) |
| 35 to 39 Years | 23 (1.1%) | 205 (13.0%) |
| 40 to 44 Years | 170 (8.0%) | 35 (2.2%) |
| 45 to 49 Years | 28 (1.3%) | 12 (0.8%) |
| 50 to 54 Years | 147 (6.9%) | 118 (7.5%) |
| 55 to 59 Years | 123 (5.8%) | 48 (3.0%) |
| 60 to 64 Years | 67 (3.1%) | 81 (5.1%) |
| 65 to 69 Years | 113 (5.3%) | 83 (5.3%) |
| 70 to 74 Years | 68 (3.2%) | 57 (3.6%) |
| 75 to 79 Years | 33 (1.5%) | 138 (8.7%) |
| 80 to 84 Years | 45 (2.1%) | 0 (0.0%) |
| 85 Years and over | 13 (0.6%) | 40 (2.5%) |
| Total | 2,136 (100.0%) | 1,578 (100.0%) |
Families and Households in Cotulla
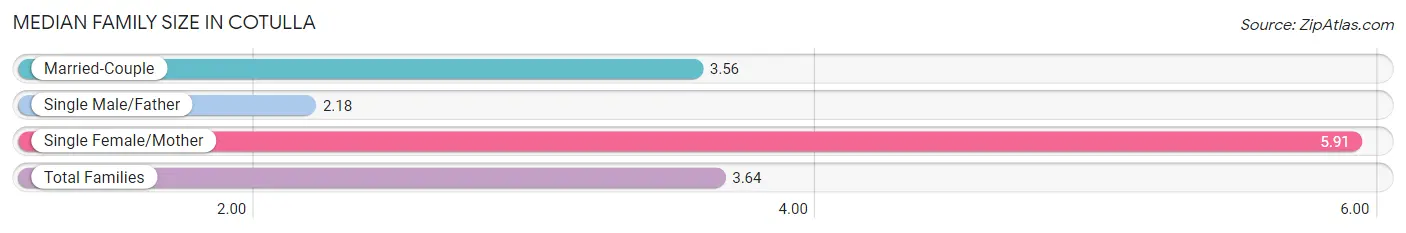
Median Family Size in Cotulla
The median family size in Cotulla is 3.64 persons per family, with single female/mother families (130 | 15.0%) accounting for the largest median family size of 5.91 persons per family. On the other hand, single male/father families (171 | 19.7%) represent the smallest median family size with 2.18 persons per family.
| Family Type | # Families | Family Size |
| Married-Couple | 567 (65.3%) | 3.56 |
| Single Male/Father | 171 (19.7%) | 2.18 |
| Single Female/Mother | 130 (15.0%) | 5.91 |
| Total Families | 868 (100.0%) | 3.64 |
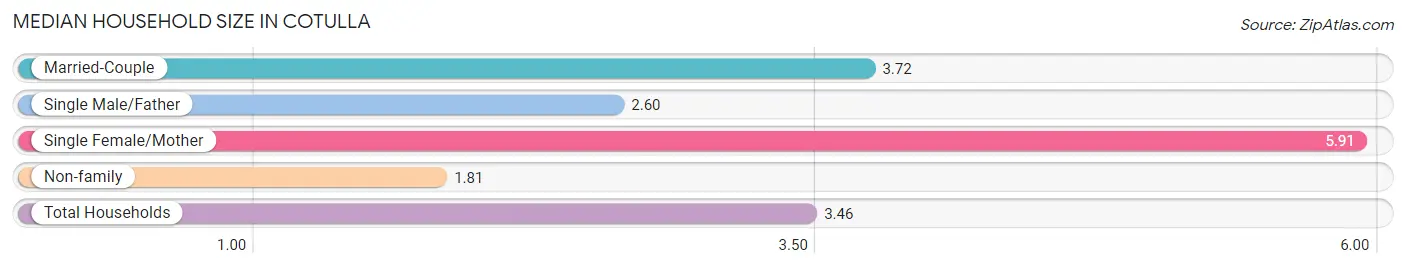
Median Household Size in Cotulla
The median household size in Cotulla is 3.46 persons per household, with single female/mother households (130 | 12.3%) accounting for the largest median household size of 5.91 persons per household. non-family households (192 | 18.1%) represent the smallest median household size with 1.81 persons per household.
| Household Type | # Households | Household Size |
| Married-Couple | 567 (53.5%) | 3.72 |
| Single Male/Father | 171 (16.1%) | 2.60 |
| Single Female/Mother | 130 (12.3%) | 5.91 |
| Non-family | 192 (18.1%) | 1.81 |
| Total Households | 1,060 (100.0%) | 3.46 |
Household Size by Marriage Status in Cotulla
Out of a total of 1,060 households in Cotulla, 868 (81.9%) are family households, while 192 (18.1%) are nonfamily households. The most numerous type of family households are 4-person households, comprising 259, and the most common type of nonfamily households are 1-person households, comprising 132.
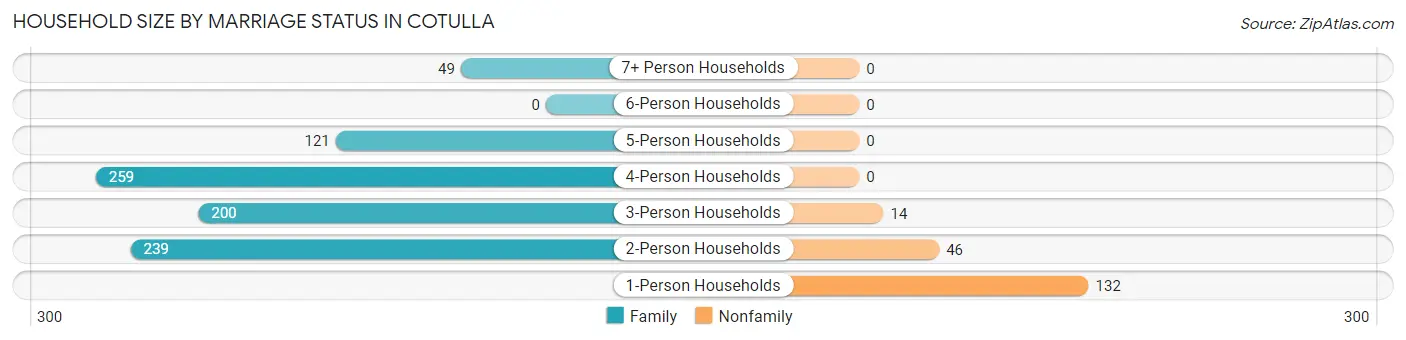
| Household Size | Family Households | Nonfamily Households |
| 1-Person Households | - | 132 (12.4%) |
| 2-Person Households | 239 (22.6%) | 46 (4.3%) |
| 3-Person Households | 200 (18.9%) | 14 (1.3%) |
| 4-Person Households | 259 (24.4%) | 0 (0.0%) |
| 5-Person Households | 121 (11.4%) | 0 (0.0%) |
| 6-Person Households | 0 (0.0%) | 0 (0.0%) |
| 7+ Person Households | 49 (4.6%) | 0 (0.0%) |
| Total | 868 (81.9%) | 192 (18.1%) |
Female Fertility in Cotulla
Fertility by Age in Cotulla
| Age Bracket | Women with Births | Births / 1,000 Women |
| 15 to 19 years | 0 (0.0%) | 0.0 |
| 20 to 34 years | 0 (0.0%) | 0.0 |
| 35 to 50 years | 0 (0.0%) | 0.0 |
| Total | 0 (0.0%) | 0.0 |
Fertility by Age by Marriage Status in Cotulla
| Age Bracket | Married | Unmarried |
| 15 to 19 years | 0 (0.0%) | 0 (0.0%) |
| 20 to 34 years | 0 (0.0%) | 0 (0.0%) |
| 35 to 50 years | 0 (0.0%) | 0 (0.0%) |
| Total | 0 (0.0%) | 0 (0.0%) |
Fertility by Education in Cotulla
| Educational Attainment | Women with Births | Births / 1,000 Women |
| Less than High School | 0 (0.0%) | 0.0 |
| High School Diploma | 0 (0.0%) | 0.0 |
| College or Associate's Degree | 0 (0.0%) | 0.0 |
| Bachelor's Degree | 0 (0.0%) | 0.0 |
| Graduate Degree | 0 (0.0%) | 0.0 |
| Total | 0 (0.0%) | 0.0 |
Fertility by Education by Marriage Status in Cotulla
| Educational Attainment | Married | Unmarried |
| Less than High School | 0 (0.0%) | 0 (0.0%) |
| High School Diploma | 0 (0.0%) | 0 (0.0%) |
| College or Associate's Degree | 0 (0.0%) | 0 (0.0%) |
| Bachelor's Degree | 0 (0.0%) | 0 (0.0%) |
| Graduate Degree | 0 (0.0%) | 0 (0.0%) |
| Total | 0 (0.0%) | 0 (0.0%) |
Employment Characteristics in Cotulla
Employment by Class of Employer in Cotulla
Among the 1,373 employed individuals in Cotulla, private company employees (691 | 50.3%), local government employees (297 | 21.6%), and state government employees (137 | 10.0%) make up the most common classes of employment.
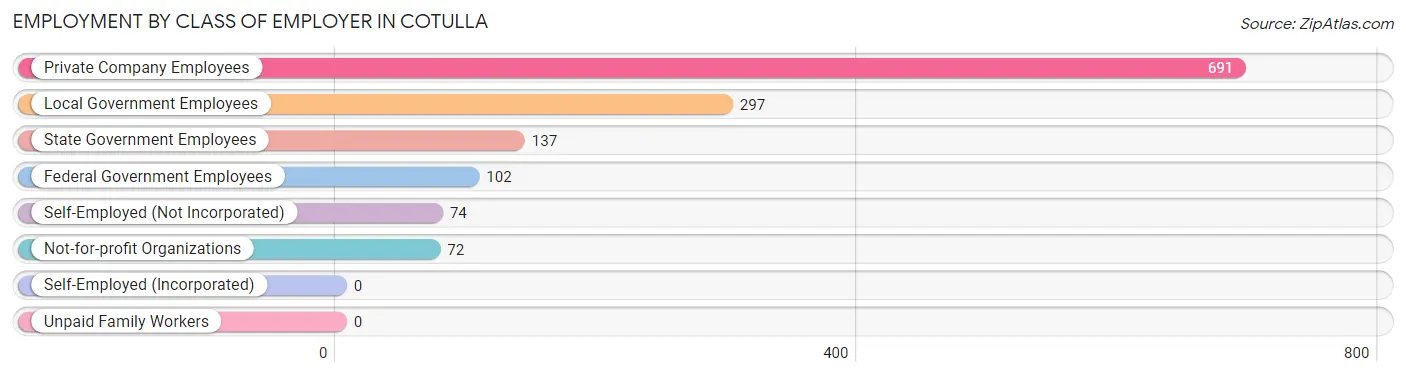
| Employer Class | # Employees | % Employees |
| Private Company Employees | 691 | 50.3% |
| Self-Employed (Incorporated) | 0 | 0.0% |
| Self-Employed (Not Incorporated) | 74 | 5.4% |
| Not-for-profit Organizations | 72 | 5.2% |
| Local Government Employees | 297 | 21.6% |
| State Government Employees | 137 | 10.0% |
| Federal Government Employees | 102 | 7.4% |
| Unpaid Family Workers | 0 | 0.0% |
| Total | 1,373 | 100.0% |
Employment Status by Age in Cotulla
According to the labor force statistics for Cotulla, out of the total population over 16 years of age (2,776), 52.6% or 1,460 individuals are in the labor force, with 5.9% or 86 of them unemployed. The age group with the highest labor force participation rate is 45 to 54 years, with 96.4% or 294 individuals in the labor force. Within the labor force, the 45 to 54 years age range has the highest percentage of unemployed individuals, with 29.3% or 86 of them being unemployed.
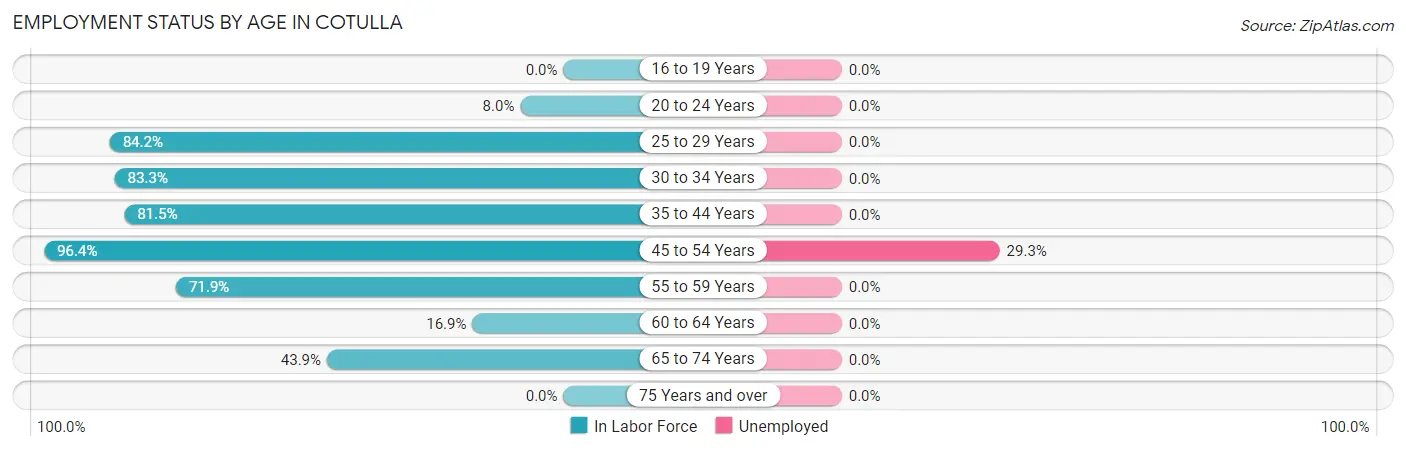
| Age Bracket | In Labor Force | Unemployed |
| 16 to 19 Years | 0 (0.0%) | 0 (0.0%) |
| 20 to 24 Years | 6 (8.0%) | 0 (0.0%) |
| 25 to 29 Years | 278 (84.2%) | 0 (0.0%) |
| 30 to 34 Years | 239 (83.3%) | 0 (0.0%) |
| 35 to 44 Years | 353 (81.5%) | 0 (0.0%) |
| 45 to 54 Years | 294 (96.4%) | 86 (29.3%) |
| 55 to 59 Years | 123 (71.9%) | 0 (0.0%) |
| 60 to 64 Years | 25 (16.9%) | 0 (0.0%) |
| 65 to 74 Years | 141 (43.9%) | 0 (0.0%) |
| 75 Years and over | 0 (0.0%) | 0 (0.0%) |
| Total | 1,460 (52.6%) | 86 (5.9%) |
Employment Status by Educational Attainment in Cotulla
According to labor force statistics for Cotulla, 78.4% of individuals (1,312) out of the total population between 25 and 64 years of age (1,674) are in the labor force, with 6.6% or 87 of them being unemployed. The group with the highest labor force participation rate are those with the educational attainment of bachelor's degree or higher, with 100.0% or 96 individuals in the labor force. Within the labor force, individuals with less than high school education have the highest percentage of unemployment, with 20.1% or 47 of them being unemployed.
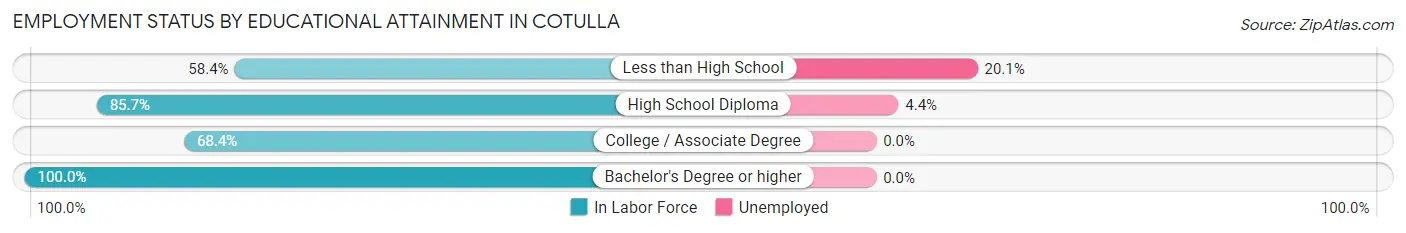
| Educational Attainment | In Labor Force | Unemployed |
| Less than High School | 234 (58.4%) | 81 (20.1%) |
| High School Diploma | 878 (85.7%) | 45 (4.4%) |
| College / Associate Degree | 104 (68.4%) | 0 (0.0%) |
| Bachelor's Degree or higher | 96 (100.0%) | 0 (0.0%) |
| Total | 1,312 (78.4%) | 110 (6.6%) |
Employment Occupations by Sex in Cotulla
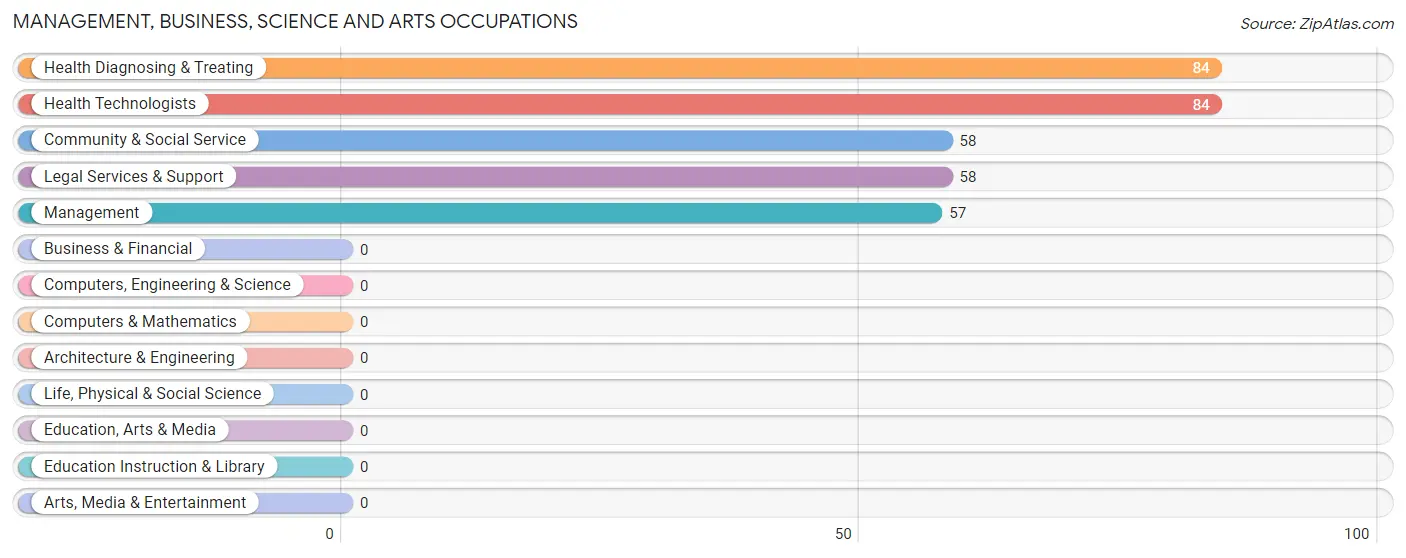
Management, Business, Science and Arts Occupations
The most common Management, Business, Science and Arts occupations in Cotulla are Health Diagnosing & Treating (84 | 6.1%), Health Technologists (84 | 6.1%), Community & Social Service (58 | 4.2%), Legal Services & Support (58 | 4.2%), and Management (57 | 4.2%).
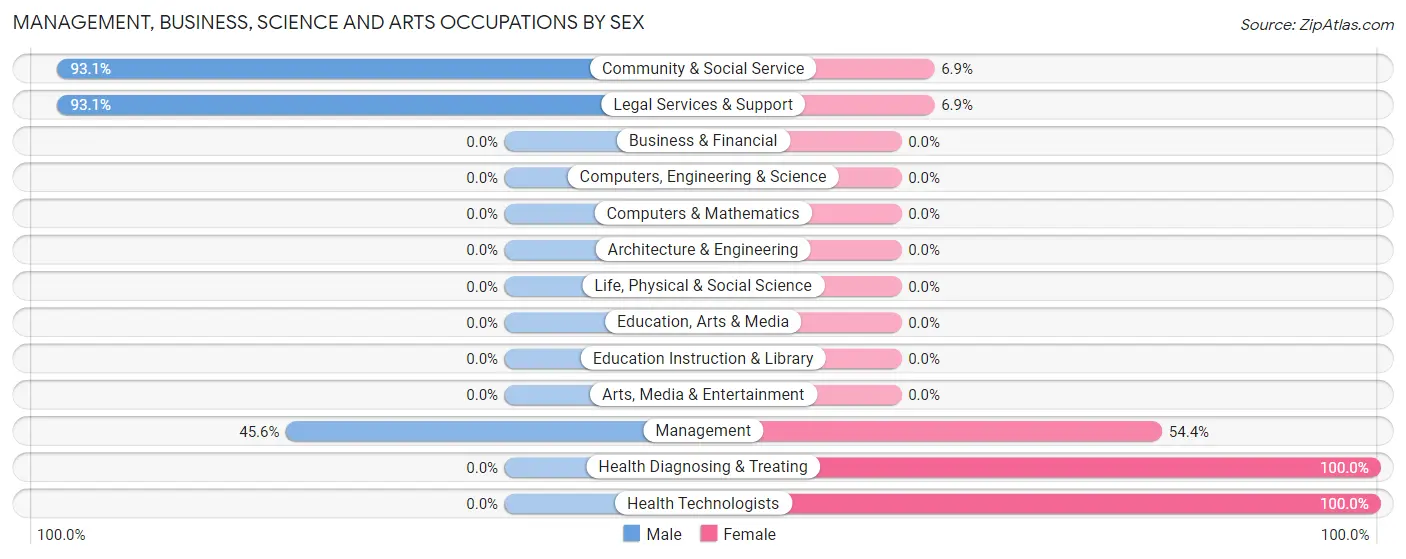
Management, Business, Science and Arts Occupations by Sex
Within the Management, Business, Science and Arts occupations in Cotulla, the most male-oriented occupations are Community & Social Service (93.1%), Legal Services & Support (93.1%), and Management (45.6%), while the most female-oriented occupations are Health Diagnosing & Treating (100.0%), Health Technologists (100.0%), and Management (54.4%).
| Occupation | Male | Female |
| Management | 26 (45.6%) | 31 (54.4%) |
| Business & Financial | 0 (0.0%) | 0 (0.0%) |
| Computers, Engineering & Science | 0 (0.0%) | 0 (0.0%) |
| Computers & Mathematics | 0 (0.0%) | 0 (0.0%) |
| Architecture & Engineering | 0 (0.0%) | 0 (0.0%) |
| Life, Physical & Social Science | 0 (0.0%) | 0 (0.0%) |
| Community & Social Service | 54 (93.1%) | 4 (6.9%) |
| Education, Arts & Media | 0 (0.0%) | 0 (0.0%) |
| Legal Services & Support | 54 (93.1%) | 4 (6.9%) |
| Education Instruction & Library | 0 (0.0%) | 0 (0.0%) |
| Arts, Media & Entertainment | 0 (0.0%) | 0 (0.0%) |
| Health Diagnosing & Treating | 0 (0.0%) | 84 (100.0%) |
| Health Technologists | 0 (0.0%) | 84 (100.0%) |
| Total (Category) | 80 (40.2%) | 119 (59.8%) |
| Total (Overall) | 990 (72.1%) | 383 (27.9%) |
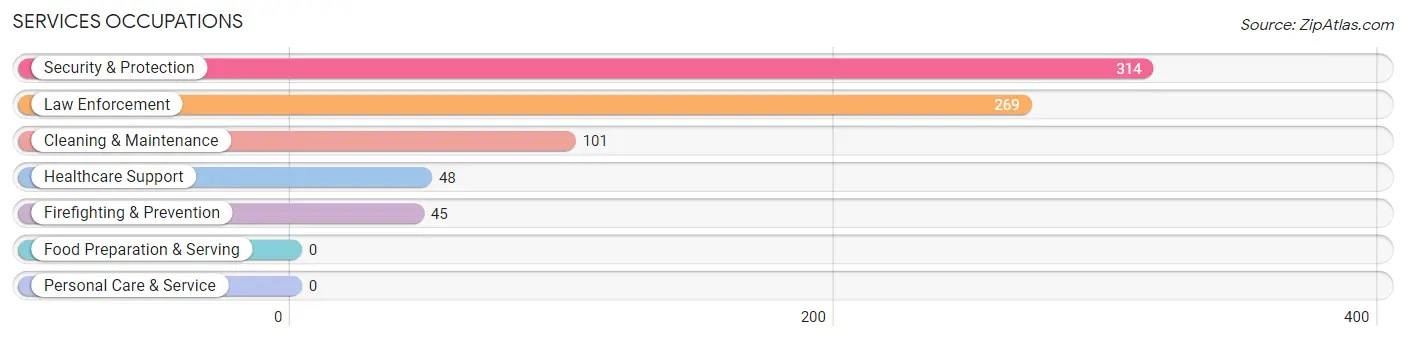
Services Occupations
The most common Services occupations in Cotulla are Security & Protection (314 | 22.9%), Law Enforcement (269 | 19.6%), Cleaning & Maintenance (101 | 7.4%), Healthcare Support (48 | 3.5%), and Firefighting & Prevention (45 | 3.3%).
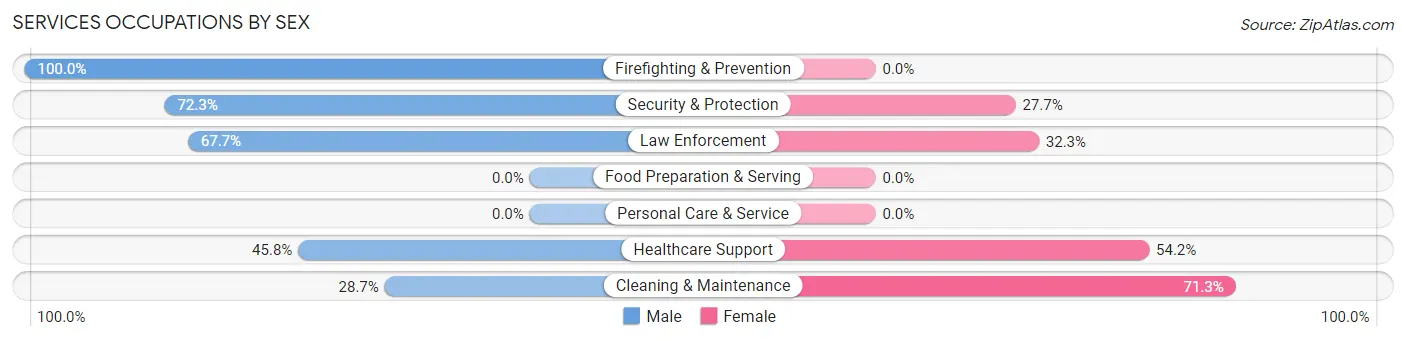
Services Occupations by Sex
Within the Services occupations in Cotulla, the most male-oriented occupations are Firefighting & Prevention (100.0%), Security & Protection (72.3%), and Law Enforcement (67.7%), while the most female-oriented occupations are Cleaning & Maintenance (71.3%), Healthcare Support (54.2%), and Law Enforcement (32.3%).
| Occupation | Male | Female |
| Healthcare Support | 22 (45.8%) | 26 (54.2%) |
| Security & Protection | 227 (72.3%) | 87 (27.7%) |
| Firefighting & Prevention | 45 (100.0%) | 0 (0.0%) |
| Law Enforcement | 182 (67.7%) | 87 (32.3%) |
| Food Preparation & Serving | 0 (0.0%) | 0 (0.0%) |
| Cleaning & Maintenance | 29 (28.7%) | 72 (71.3%) |
| Personal Care & Service | 0 (0.0%) | 0 (0.0%) |
| Total (Category) | 278 (60.0%) | 185 (40.0%) |
| Total (Overall) | 990 (72.1%) | 383 (27.9%) |
Sales and Office Occupations
The most common Sales and Office occupations in Cotulla are Office & Administration (49 | 3.6%), and Sales & Related (30 | 2.2%).
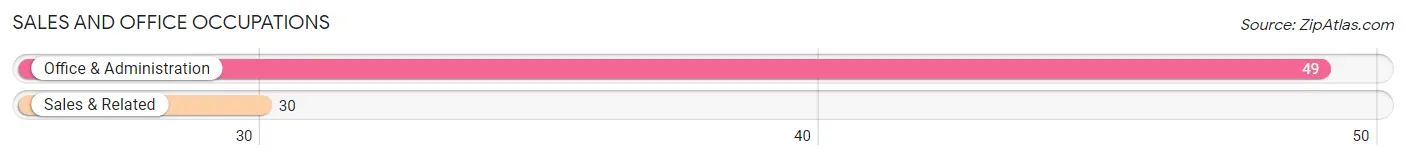
Sales and Office Occupations by Sex
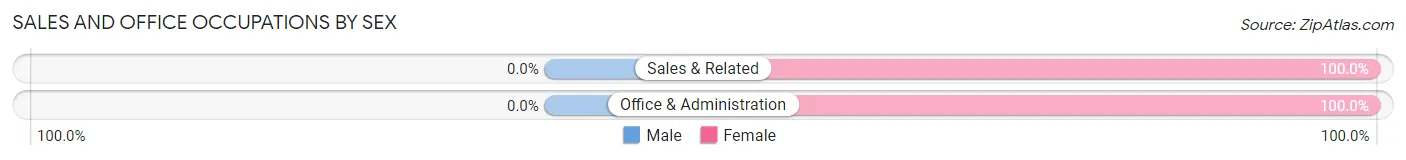
| Occupation | Male | Female |
| Sales & Related | 0 (0.0%) | 30 (100.0%) |
| Office & Administration | 0 (0.0%) | 49 (100.0%) |
| Total (Category) | 0 (0.0%) | 79 (100.0%) |
| Total (Overall) | 990 (72.1%) | 383 (27.9%) |
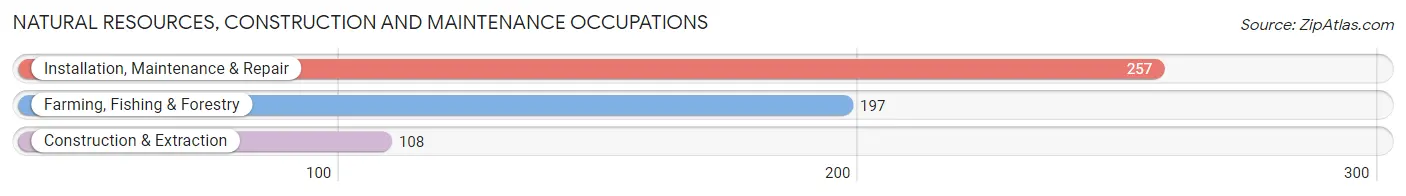
Natural Resources, Construction and Maintenance Occupations
The most common Natural Resources, Construction and Maintenance occupations in Cotulla are Installation, Maintenance & Repair (257 | 18.7%), Farming, Fishing & Forestry (197 | 14.3%), and Construction & Extraction (108 | 7.9%).
Natural Resources, Construction and Maintenance Occupations by Sex
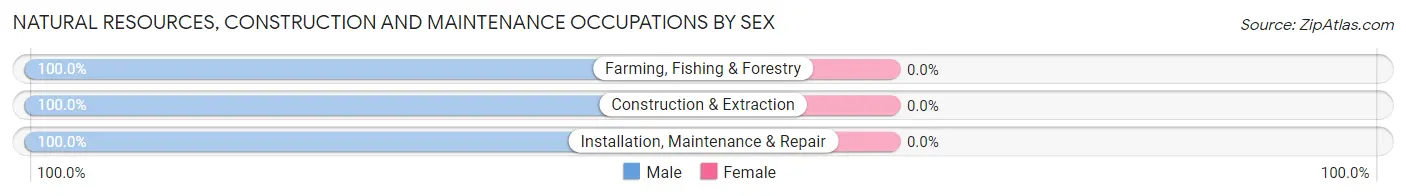
| Occupation | Male | Female |
| Farming, Fishing & Forestry | 197 (100.0%) | 0 (0.0%) |
| Construction & Extraction | 108 (100.0%) | 0 (0.0%) |
| Installation, Maintenance & Repair | 257 (100.0%) | 0 (0.0%) |
| Total (Category) | 562 (100.0%) | 0 (0.0%) |
| Total (Overall) | 990 (72.1%) | 383 (27.9%) |
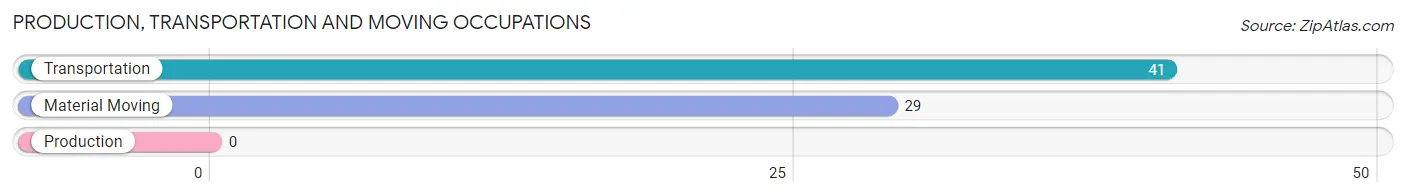
Production, Transportation and Moving Occupations
The most common Production, Transportation and Moving occupations in Cotulla are Transportation (41 | 3.0%), and Material Moving (29 | 2.1%).
Production, Transportation and Moving Occupations by Sex
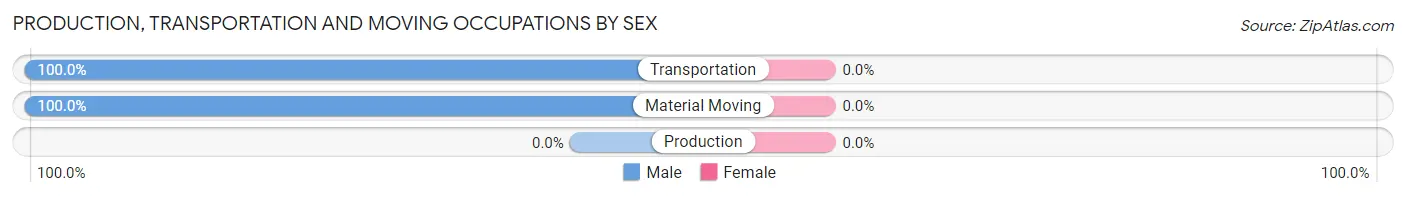
| Occupation | Male | Female |
| Production | 0 (0.0%) | 0 (0.0%) |
| Transportation | 41 (100.0%) | 0 (0.0%) |
| Material Moving | 29 (100.0%) | 0 (0.0%) |
| Total (Category) | 70 (100.0%) | 0 (0.0%) |
| Total (Overall) | 990 (72.1%) | 383 (27.9%) |
Employment Industries by Sex in Cotulla
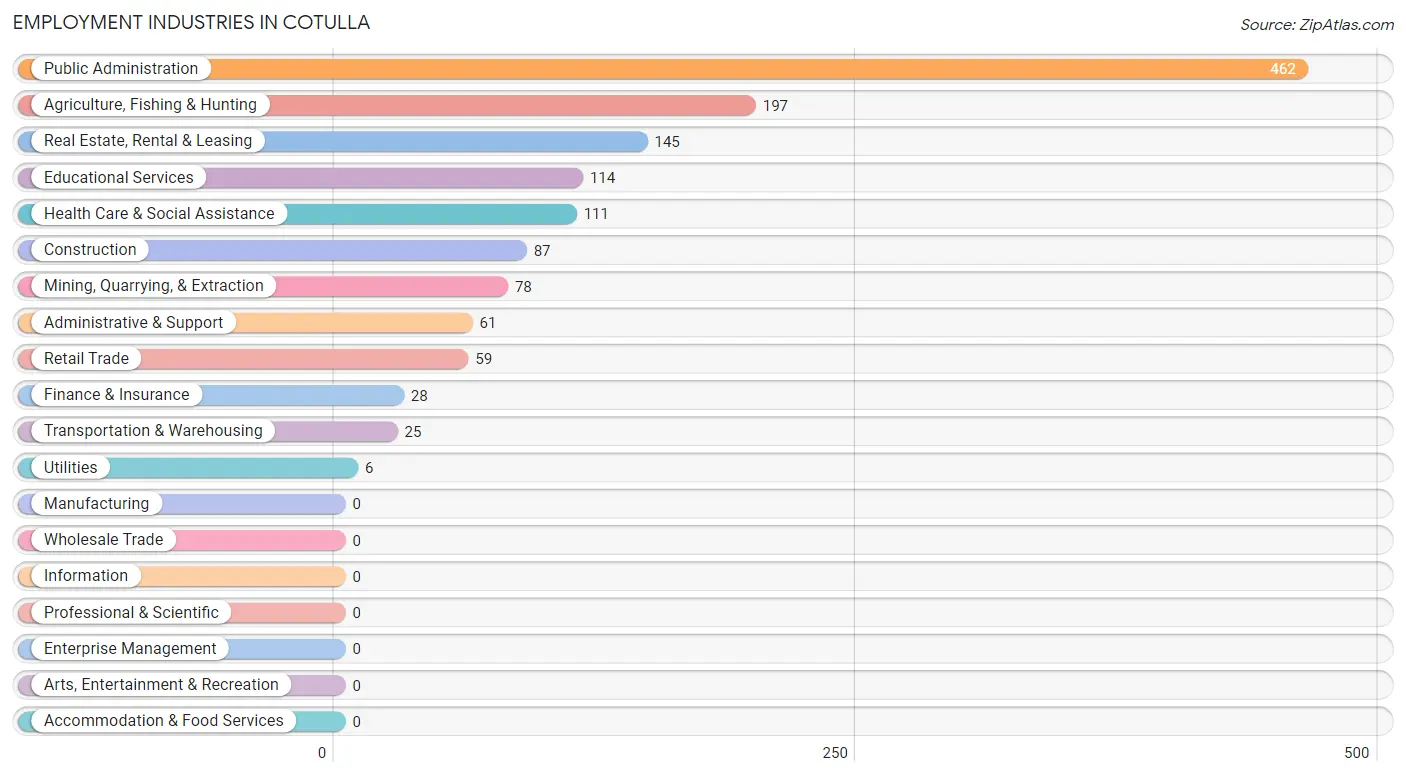
Employment Industries in Cotulla
The major employment industries in Cotulla include Public Administration (462 | 33.7%), Agriculture, Fishing & Hunting (197 | 14.3%), Real Estate, Rental & Leasing (145 | 10.6%), Educational Services (114 | 8.3%), and Health Care & Social Assistance (111 | 8.1%).
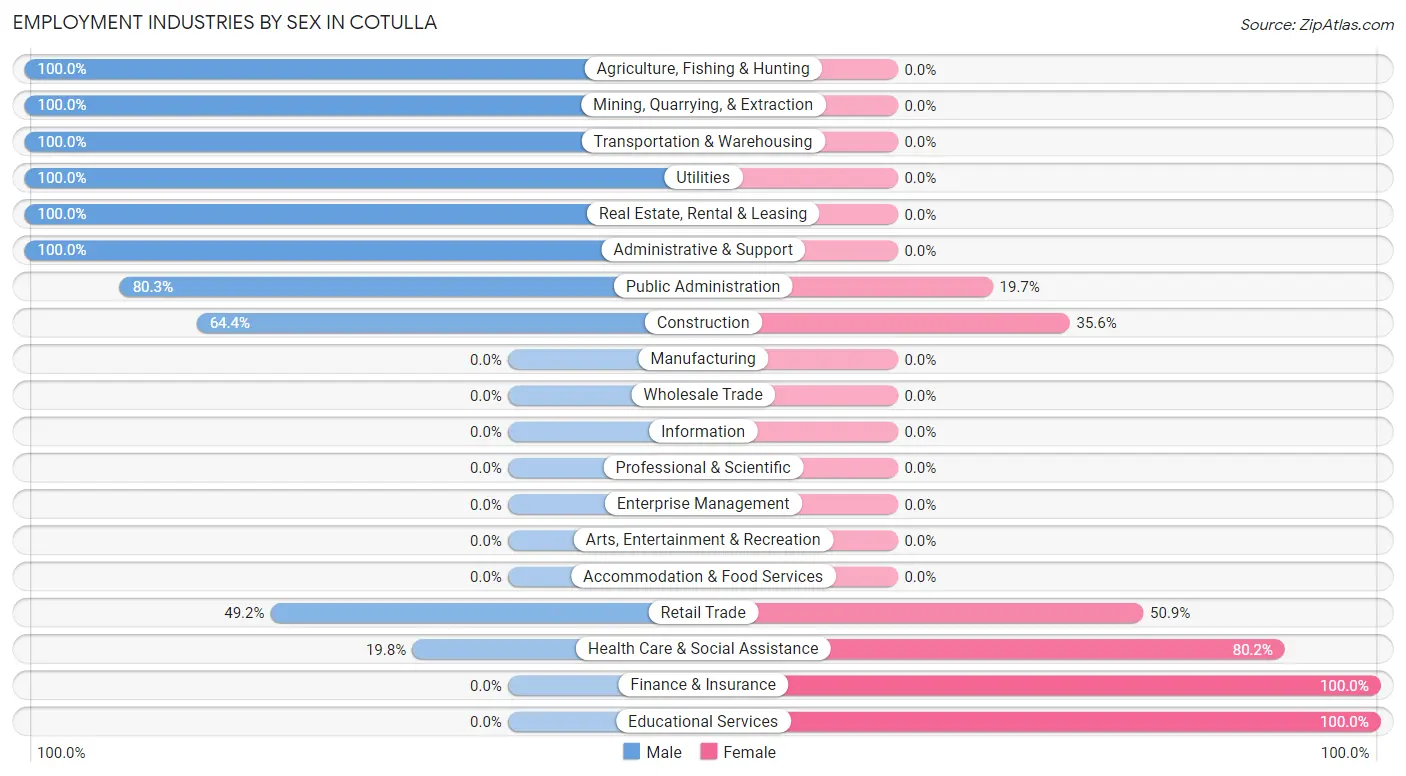
Employment Industries by Sex in Cotulla
The Cotulla industries that see more men than women are Agriculture, Fishing & Hunting (100.0%), Mining, Quarrying, & Extraction (100.0%), and Transportation & Warehousing (100.0%), whereas the industries that tend to have a higher number of women are Finance & Insurance (100.0%), Educational Services (100.0%), and Health Care & Social Assistance (80.2%).
| Industry | Male | Female |
| Agriculture, Fishing & Hunting | 197 (100.0%) | 0 (0.0%) |
| Mining, Quarrying, & Extraction | 78 (100.0%) | 0 (0.0%) |
| Construction | 56 (64.4%) | 31 (35.6%) |
| Manufacturing | 0 (0.0%) | 0 (0.0%) |
| Wholesale Trade | 0 (0.0%) | 0 (0.0%) |
| Retail Trade | 29 (49.1%) | 30 (50.8%) |
| Transportation & Warehousing | 25 (100.0%) | 0 (0.0%) |
| Utilities | 6 (100.0%) | 0 (0.0%) |
| Information | 0 (0.0%) | 0 (0.0%) |
| Finance & Insurance | 0 (0.0%) | 28 (100.0%) |
| Real Estate, Rental & Leasing | 145 (100.0%) | 0 (0.0%) |
| Professional & Scientific | 0 (0.0%) | 0 (0.0%) |
| Enterprise Management | 0 (0.0%) | 0 (0.0%) |
| Administrative & Support | 61 (100.0%) | 0 (0.0%) |
| Educational Services | 0 (0.0%) | 114 (100.0%) |
| Health Care & Social Assistance | 22 (19.8%) | 89 (80.2%) |
| Arts, Entertainment & Recreation | 0 (0.0%) | 0 (0.0%) |
| Accommodation & Food Services | 0 (0.0%) | 0 (0.0%) |
| Public Administration | 371 (80.3%) | 91 (19.7%) |
| Total | 990 (72.1%) | 383 (27.9%) |
Education in Cotulla
School Enrollment in Cotulla
The most common levels of schooling among the 1,068 students in Cotulla are high school (554 | 51.9%), elementary school (351 | 32.9%), and middle school (121 | 11.3%).
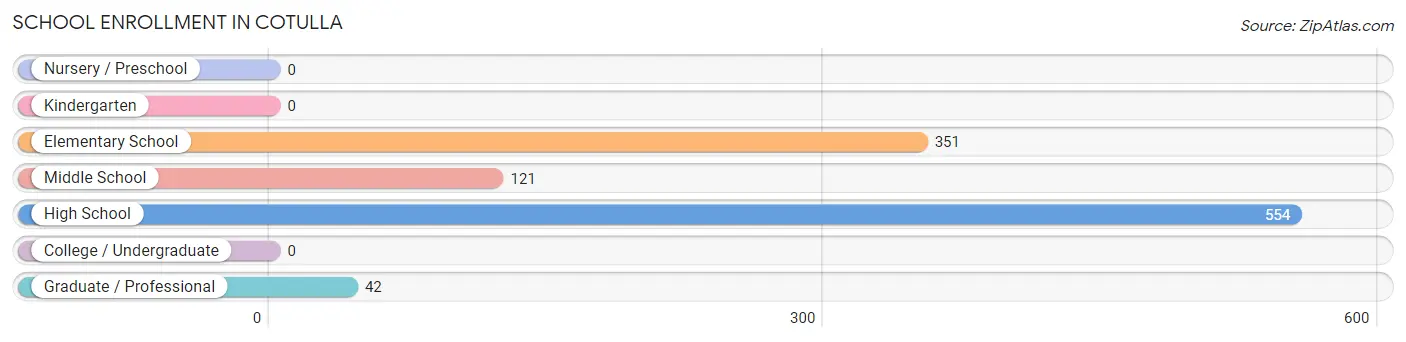
| School Level | # Students | % Students |
| Nursery / Preschool | 0 | 0.0% |
| Kindergarten | 0 | 0.0% |
| Elementary School | 351 | 32.9% |
| Middle School | 121 | 11.3% |
| High School | 554 | 51.9% |
| College / Undergraduate | 0 | 0.0% |
| Graduate / Professional | 42 | 3.9% |
| Total | 1,068 | 100.0% |
School Enrollment by Age by Funding Source in Cotulla
Out of a total of 1,068 students who are enrolled in schools in Cotulla, 61 (5.7%) attend a private institution, while the remaining 1,007 (94.3%) are enrolled in public schools. The age group of 35 years and over has the highest likelihood of being enrolled in private schools, with 10 (100.0% in the age bracket) enrolled. Conversely, the age group of 10 to 14 year olds has the lowest likelihood of being enrolled in a private school, with 121 (100.0% in the age bracket) attending a public institution.
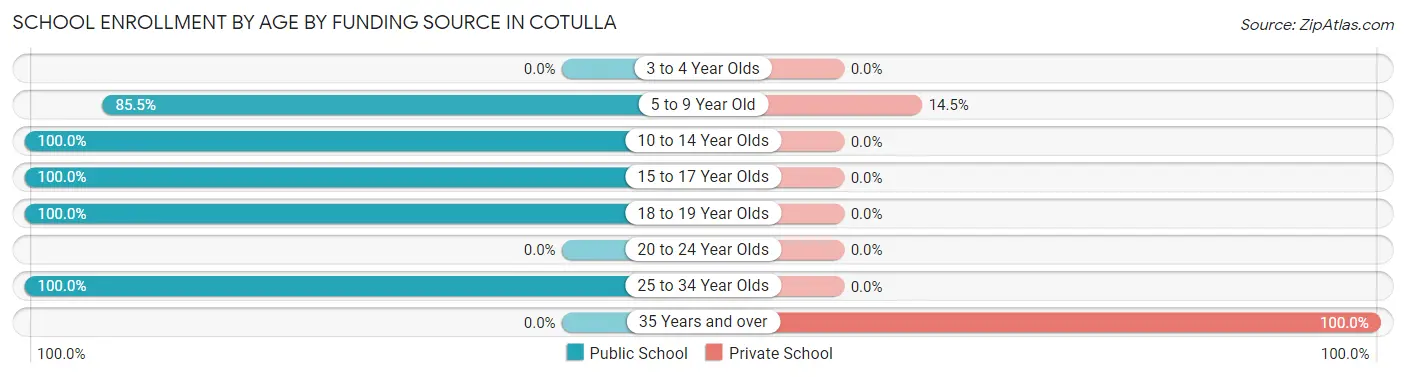
| Age Bracket | Public School | Private School |
| 3 to 4 Year Olds | 0 (0.0%) | 0 (0.0%) |
| 5 to 9 Year Old | 300 (85.5%) | 51 (14.5%) |
| 10 to 14 Year Olds | 121 (100.0%) | 0 (0.0%) |
| 15 to 17 Year Olds | 187 (100.0%) | 0 (0.0%) |
| 18 to 19 Year Olds | 317 (100.0%) | 0 (0.0%) |
| 20 to 24 Year Olds | 0 (0.0%) | 0 (0.0%) |
| 25 to 34 Year Olds | 82 (100.0%) | 0 (0.0%) |
| 35 Years and over | 0 (0.0%) | 10 (100.0%) |
| Total | 1,007 (94.3%) | 61 (5.7%) |
Educational Attainment by Field of Study in Cotulla
Business (54 | 47.8%), science & technology (42 | 37.2%), and education (17 | 15.0%) are the most common fields of study among 113 individuals in Cotulla who have obtained a bachelor's degree or higher.
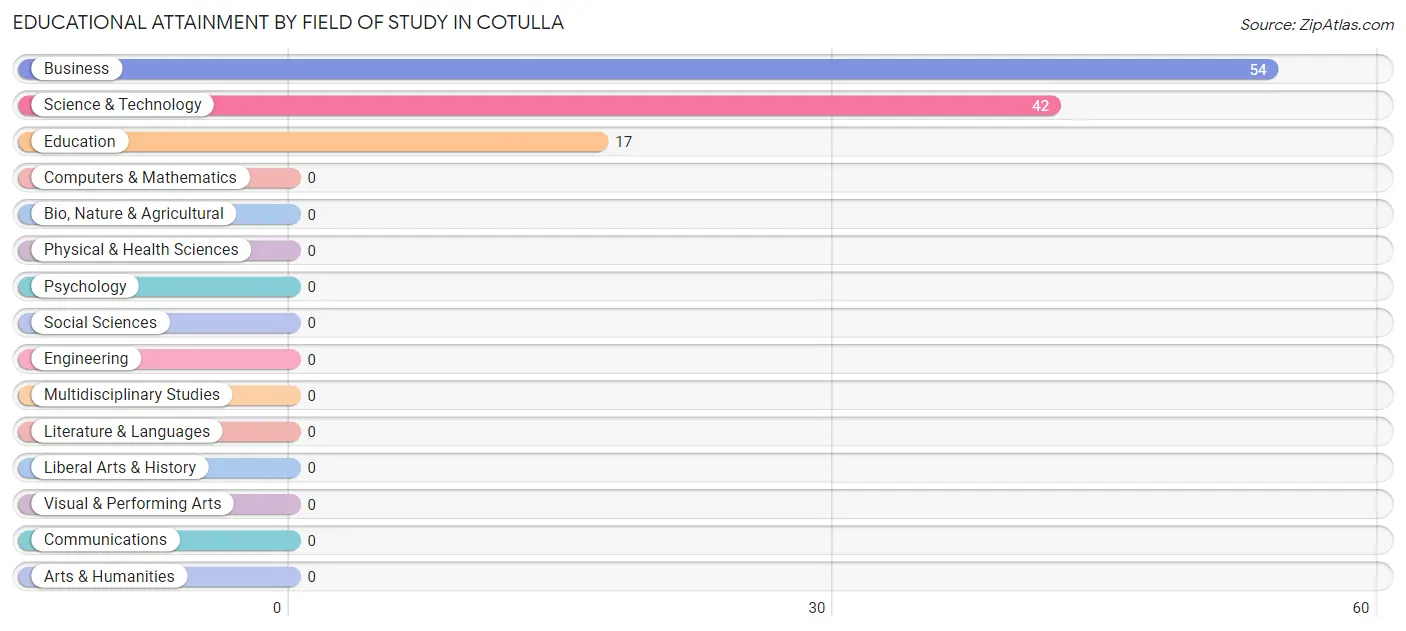
| Field of Study | # Graduates | % Graduates |
| Computers & Mathematics | 0 | 0.0% |
| Bio, Nature & Agricultural | 0 | 0.0% |
| Physical & Health Sciences | 0 | 0.0% |
| Psychology | 0 | 0.0% |
| Social Sciences | 0 | 0.0% |
| Engineering | 0 | 0.0% |
| Multidisciplinary Studies | 0 | 0.0% |
| Science & Technology | 42 | 37.2% |
| Business | 54 | 47.8% |
| Education | 17 | 15.0% |
| Literature & Languages | 0 | 0.0% |
| Liberal Arts & History | 0 | 0.0% |
| Visual & Performing Arts | 0 | 0.0% |
| Communications | 0 | 0.0% |
| Arts & Humanities | 0 | 0.0% |
| Total | 113 | 100.0% |
Transportation & Commute in Cotulla
Vehicle Availability by Sex in Cotulla
The most prevalent vehicle ownership categories in Cotulla are males with 2 vehicles (578, accounting for 58.4%) and females with 2 vehicles (277, making up 150.9%).
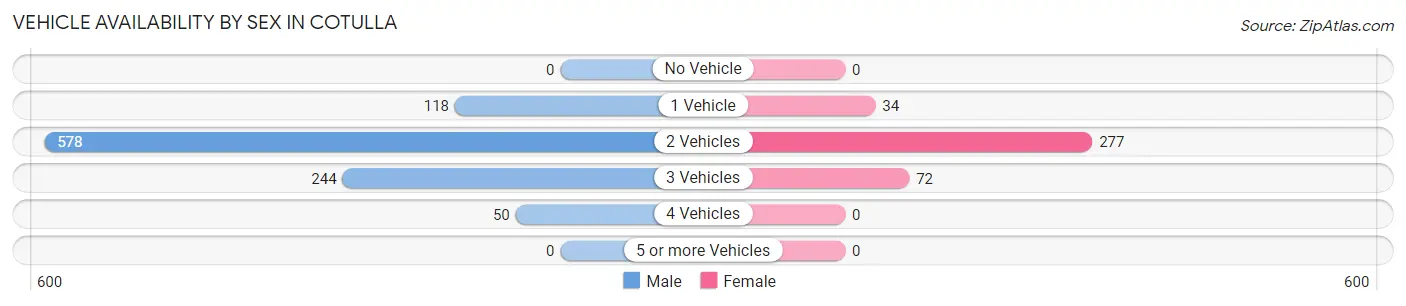
| Vehicles Available | Male | Female |
| No Vehicle | 0 (0.0%) | 0 (0.0%) |
| 1 Vehicle | 118 (11.9%) | 34 (8.9%) |
| 2 Vehicles | 578 (58.4%) | 277 (72.3%) |
| 3 Vehicles | 244 (24.6%) | 72 (18.8%) |
| 4 Vehicles | 50 (5.1%) | 0 (0.0%) |
| 5 or more Vehicles | 0 (0.0%) | 0 (0.0%) |
| Total | 990 (100.0%) | 383 (100.0%) |
Commute Time in Cotulla
The most frequently occuring commute durations in Cotulla are 5 to 9 minutes (485 commuters, 35.3%), 30 to 34 minutes (254 commuters, 18.5%), and 10 to 14 minutes (167 commuters, 12.2%).
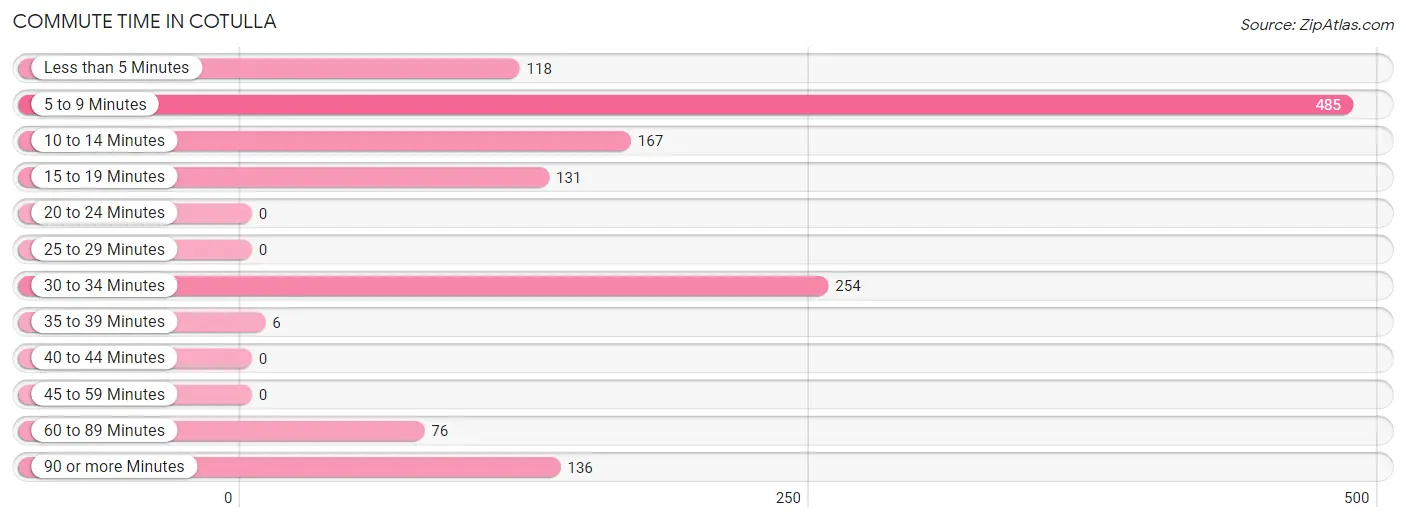
| Commute Time | # Commuters | % Commuters |
| Less than 5 Minutes | 118 | 8.6% |
| 5 to 9 Minutes | 485 | 35.3% |
| 10 to 14 Minutes | 167 | 12.2% |
| 15 to 19 Minutes | 131 | 9.5% |
| 20 to 24 Minutes | 0 | 0.0% |
| 25 to 29 Minutes | 0 | 0.0% |
| 30 to 34 Minutes | 254 | 18.5% |
| 35 to 39 Minutes | 6 | 0.4% |
| 40 to 44 Minutes | 0 | 0.0% |
| 45 to 59 Minutes | 0 | 0.0% |
| 60 to 89 Minutes | 76 | 5.5% |
| 90 or more Minutes | 136 | 9.9% |
Commute Time by Sex in Cotulla
The most common commute times in Cotulla are 5 to 9 minutes (304 commuters, 30.7%) for males and 5 to 9 minutes (181 commuters, 47.3%) for females.
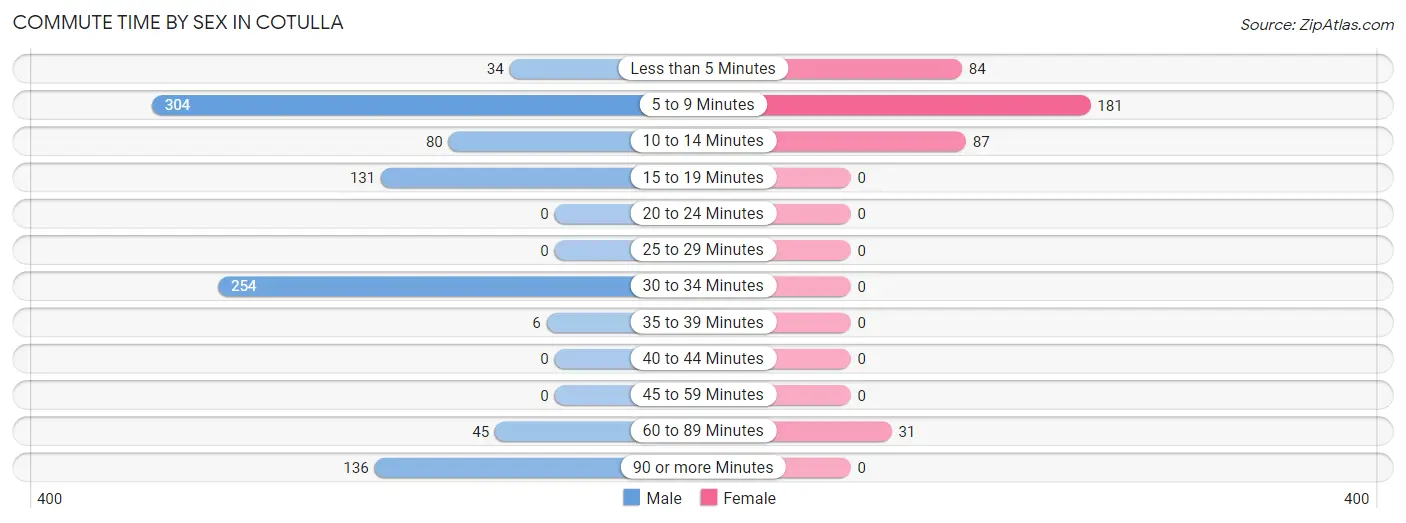
| Commute Time | Male | Female |
| Less than 5 Minutes | 34 (3.4%) | 84 (21.9%) |
| 5 to 9 Minutes | 304 (30.7%) | 181 (47.3%) |
| 10 to 14 Minutes | 80 (8.1%) | 87 (22.7%) |
| 15 to 19 Minutes | 131 (13.2%) | 0 (0.0%) |
| 20 to 24 Minutes | 0 (0.0%) | 0 (0.0%) |
| 25 to 29 Minutes | 0 (0.0%) | 0 (0.0%) |
| 30 to 34 Minutes | 254 (25.7%) | 0 (0.0%) |
| 35 to 39 Minutes | 6 (0.6%) | 0 (0.0%) |
| 40 to 44 Minutes | 0 (0.0%) | 0 (0.0%) |
| 45 to 59 Minutes | 0 (0.0%) | 0 (0.0%) |
| 60 to 89 Minutes | 45 (4.5%) | 31 (8.1%) |
| 90 or more Minutes | 136 (13.7%) | 0 (0.0%) |
Time of Departure to Work by Sex in Cotulla
The most frequent times of departure to work in Cotulla are 7:30 AM to 7:59 AM (215, 21.7%) for males and 8:00 AM to 8:29 AM (108, 28.2%) for females.
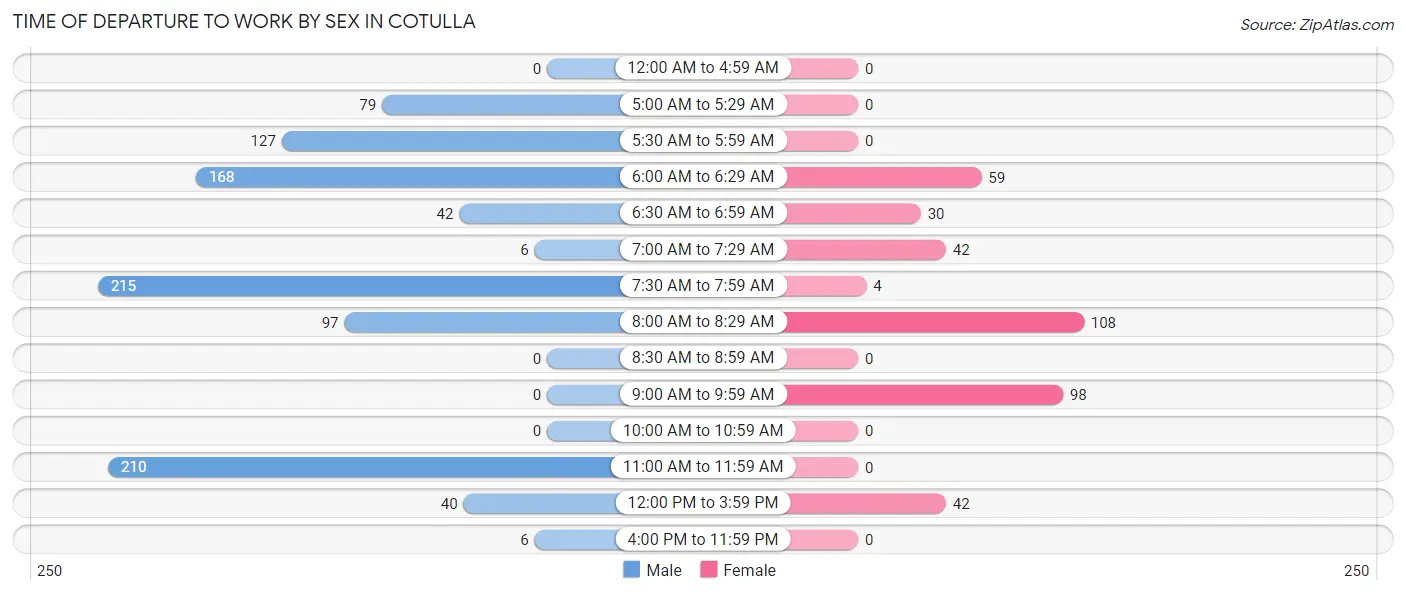
| Time of Departure | Male | Female |
| 12:00 AM to 4:59 AM | 0 (0.0%) | 0 (0.0%) |
| 5:00 AM to 5:29 AM | 79 (8.0%) | 0 (0.0%) |
| 5:30 AM to 5:59 AM | 127 (12.8%) | 0 (0.0%) |
| 6:00 AM to 6:29 AM | 168 (17.0%) | 59 (15.4%) |
| 6:30 AM to 6:59 AM | 42 (4.2%) | 30 (7.8%) |
| 7:00 AM to 7:29 AM | 6 (0.6%) | 42 (11.0%) |
| 7:30 AM to 7:59 AM | 215 (21.7%) | 4 (1.0%) |
| 8:00 AM to 8:29 AM | 97 (9.8%) | 108 (28.2%) |
| 8:30 AM to 8:59 AM | 0 (0.0%) | 0 (0.0%) |
| 9:00 AM to 9:59 AM | 0 (0.0%) | 98 (25.6%) |
| 10:00 AM to 10:59 AM | 0 (0.0%) | 0 (0.0%) |
| 11:00 AM to 11:59 AM | 210 (21.2%) | 0 (0.0%) |
| 12:00 PM to 3:59 PM | 40 (4.0%) | 42 (11.0%) |
| 4:00 PM to 11:59 PM | 6 (0.6%) | 0 (0.0%) |
| Total | 990 (100.0%) | 383 (100.0%) |
Housing Occupancy in Cotulla
Occupancy by Ownership in Cotulla
Of the total 1,060 dwellings in Cotulla, owner-occupied units account for 802 (75.7%), while renter-occupied units make up 258 (24.3%).
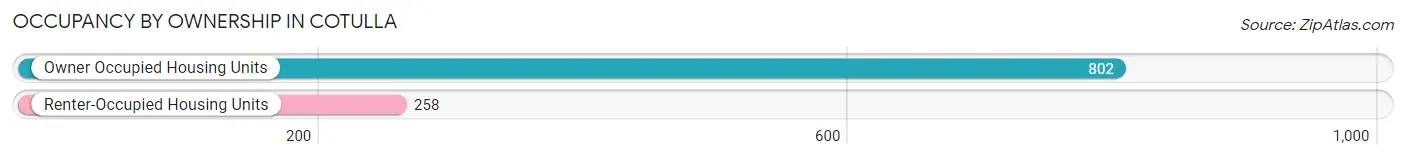
| Occupancy | # Housing Units | % Housing Units |
| Owner Occupied Housing Units | 802 | 75.7% |
| Renter-Occupied Housing Units | 258 | 24.3% |
| Total Occupied Housing Units | 1,060 | 100.0% |
Occupancy by Household Size in Cotulla
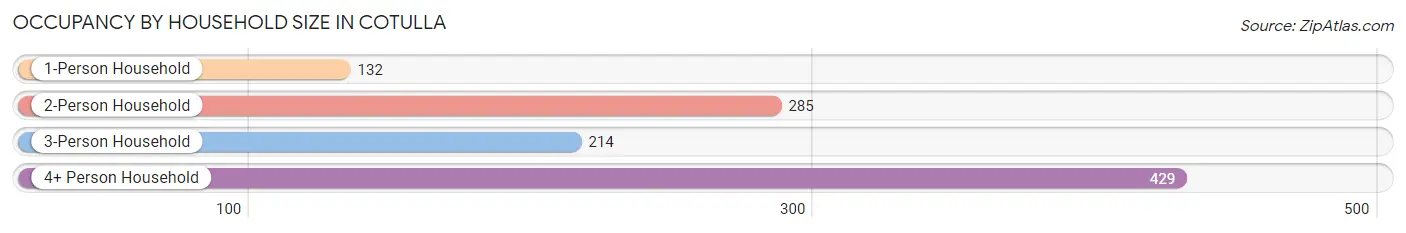
| Household Size | # Housing Units | % Housing Units |
| 1-Person Household | 132 | 12.4% |
| 2-Person Household | 285 | 26.9% |
| 3-Person Household | 214 | 20.2% |
| 4+ Person Household | 429 | 40.5% |
| Total Housing Units | 1,060 | 100.0% |
Occupancy by Ownership by Household Size in Cotulla
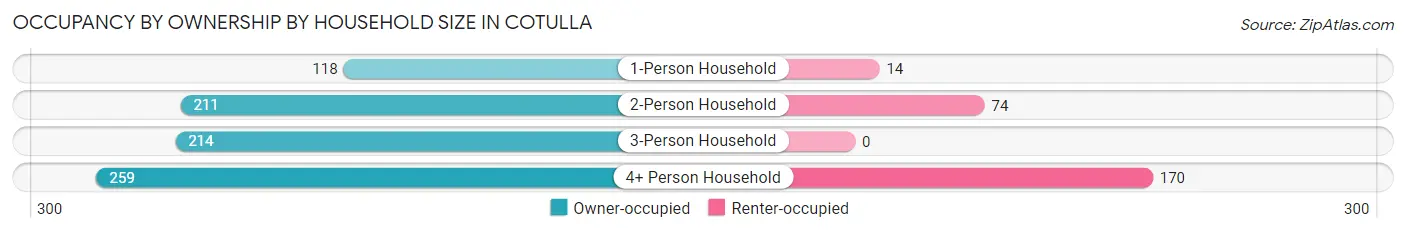
| Household Size | Owner-occupied | Renter-occupied |
| 1-Person Household | 118 (89.4%) | 14 (10.6%) |
| 2-Person Household | 211 (74.0%) | 74 (26.0%) |
| 3-Person Household | 214 (100.0%) | 0 (0.0%) |
| 4+ Person Household | 259 (60.4%) | 170 (39.6%) |
| Total Housing Units | 802 (75.7%) | 258 (24.3%) |
Occupancy by Educational Attainment in Cotulla
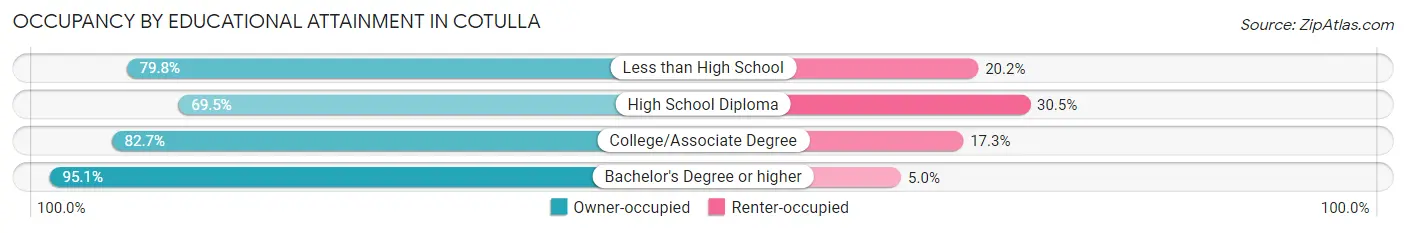
| Household Size | Owner-occupied | Renter-occupied |
| Less than High School | 134 (79.8%) | 34 (20.2%) |
| High School Diploma | 433 (69.5%) | 190 (30.5%) |
| College/Associate Degree | 139 (82.7%) | 29 (17.3%) |
| Bachelor's Degree or higher | 96 (95.1%) | 5 (5.0%) |
Occupancy by Age of Householder in Cotulla
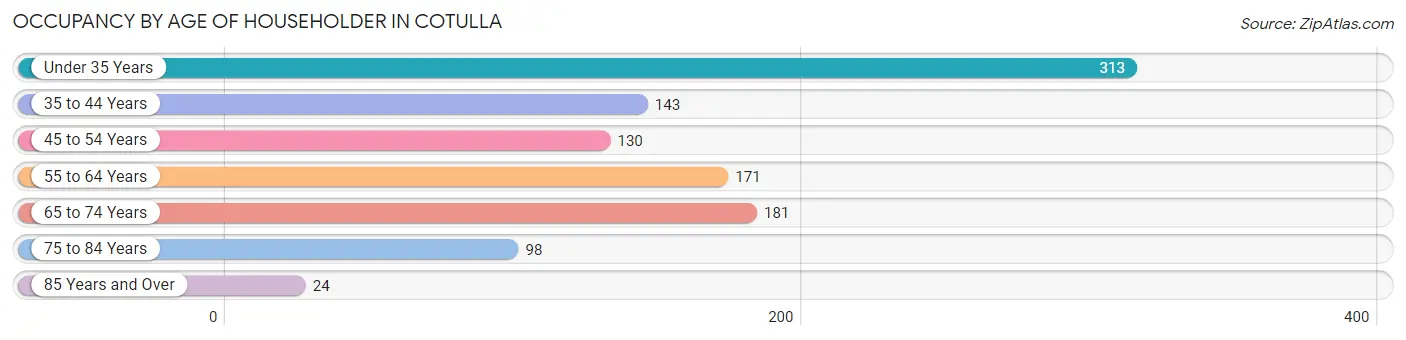
| Age Bracket | # Households | % Households |
| Under 35 Years | 313 | 29.5% |
| 35 to 44 Years | 143 | 13.5% |
| 45 to 54 Years | 130 | 12.3% |
| 55 to 64 Years | 171 | 16.1% |
| 65 to 74 Years | 181 | 17.1% |
| 75 to 84 Years | 98 | 9.2% |
| 85 Years and Over | 24 | 2.3% |
| Total | 1,060 | 100.0% |
Housing Finances in Cotulla
Median Income by Occupancy in Cotulla
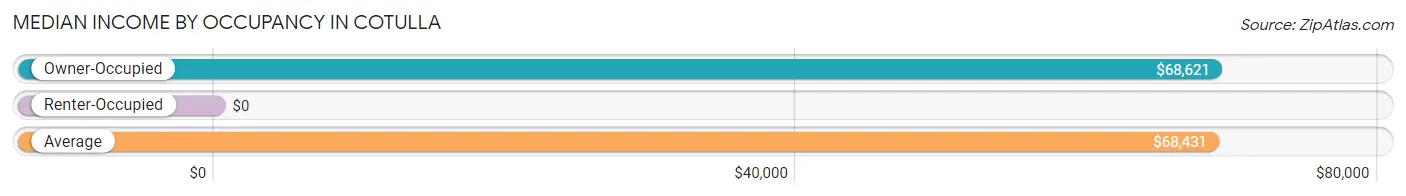
| Occupancy Type | # Households | Median Income |
| Owner-Occupied | 802 (75.7%) | $68,621 |
| Renter-Occupied | 258 (24.3%) | $0 |
| Average | 1,060 (100.0%) | $68,431 |
Occupancy by Householder Income Bracket in Cotulla
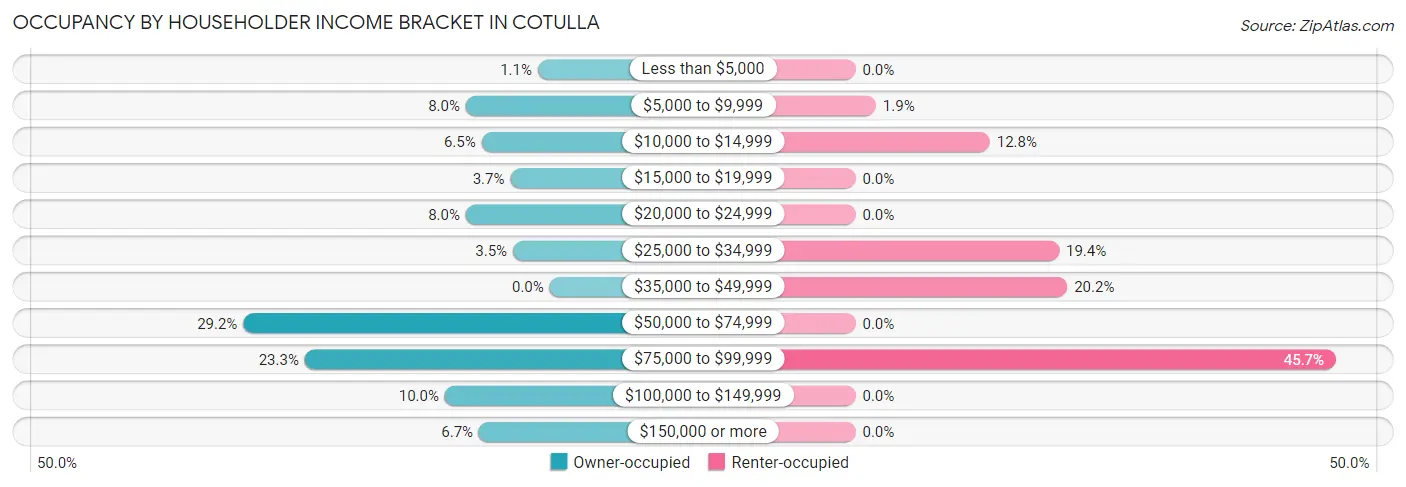
| Income Bracket | Owner-occupied | Renter-occupied |
| Less than $5,000 | 9 (1.1%) | 0 (0.0%) |
| $5,000 to $9,999 | 64 (8.0%) | 5 (1.9%) |
| $10,000 to $14,999 | 52 (6.5%) | 33 (12.8%) |
| $15,000 to $19,999 | 30 (3.7%) | 0 (0.0%) |
| $20,000 to $24,999 | 64 (8.0%) | 0 (0.0%) |
| $25,000 to $34,999 | 28 (3.5%) | 50 (19.4%) |
| $35,000 to $49,999 | 0 (0.0%) | 52 (20.2%) |
| $50,000 to $74,999 | 234 (29.2%) | 0 (0.0%) |
| $75,000 to $99,999 | 187 (23.3%) | 118 (45.7%) |
| $100,000 to $149,999 | 80 (10.0%) | 0 (0.0%) |
| $150,000 or more | 54 (6.7%) | 0 (0.0%) |
| Total | 802 (100.0%) | 258 (100.0%) |
Monthly Housing Cost Tiers in Cotulla
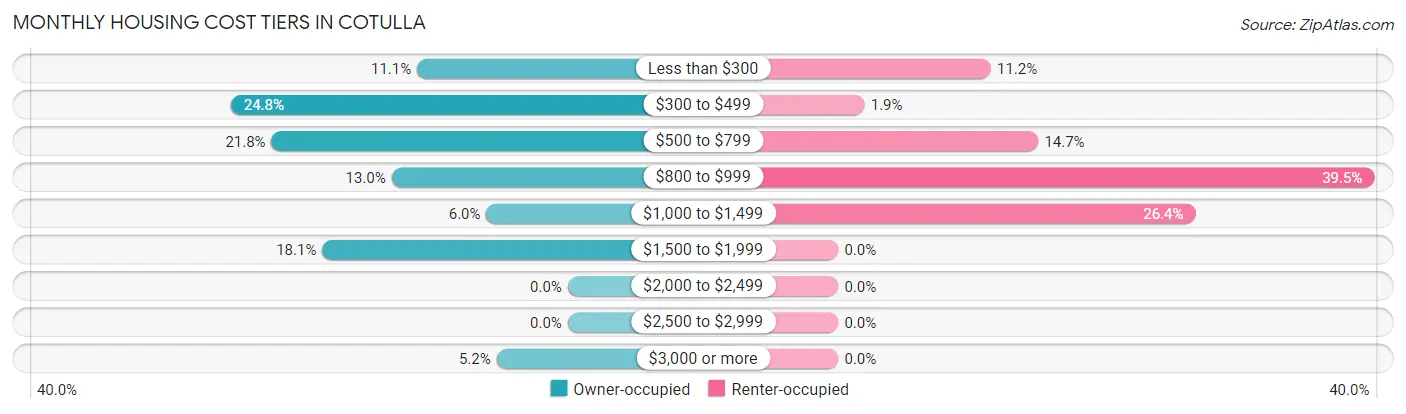
| Monthly Cost | Owner-occupied | Renter-occupied |
| Less than $300 | 89 (11.1%) | 29 (11.2%) |
| $300 to $499 | 199 (24.8%) | 5 (1.9%) |
| $500 to $799 | 175 (21.8%) | 38 (14.7%) |
| $800 to $999 | 104 (13.0%) | 102 (39.5%) |
| $1,000 to $1,499 | 48 (6.0%) | 68 (26.4%) |
| $1,500 to $1,999 | 145 (18.1%) | 0 (0.0%) |
| $2,000 to $2,499 | 0 (0.0%) | 0 (0.0%) |
| $2,500 to $2,999 | 0 (0.0%) | 0 (0.0%) |
| $3,000 or more | 42 (5.2%) | 0 (0.0%) |
| Total | 802 (100.0%) | 258 (100.0%) |
Physical Housing Characteristics in Cotulla
Housing Structures in Cotulla
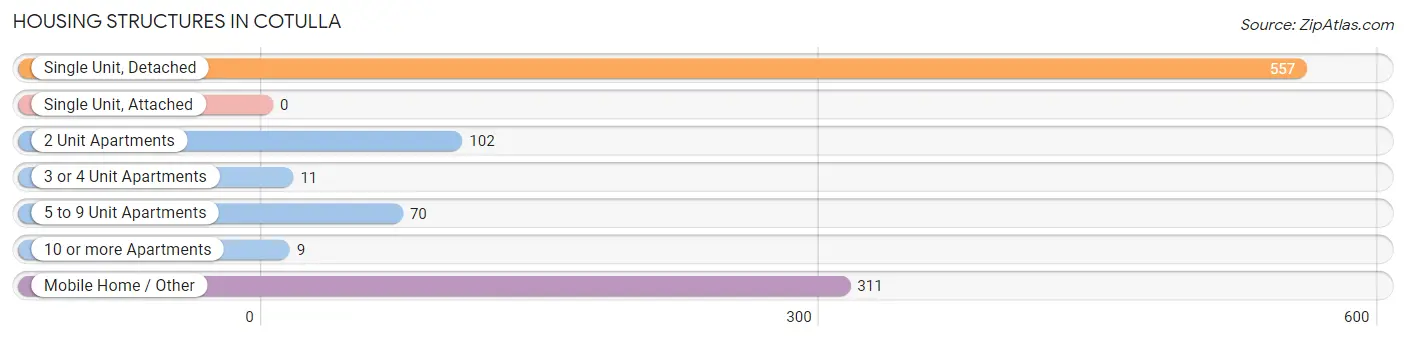
| Structure Type | # Housing Units | % Housing Units |
| Single Unit, Detached | 557 | 52.5% |
| Single Unit, Attached | 0 | 0.0% |
| 2 Unit Apartments | 102 | 9.6% |
| 3 or 4 Unit Apartments | 11 | 1.0% |
| 5 to 9 Unit Apartments | 70 | 6.6% |
| 10 or more Apartments | 9 | 0.9% |
| Mobile Home / Other | 311 | 29.3% |
| Total | 1,060 | 100.0% |
Housing Structures by Occupancy in Cotulla
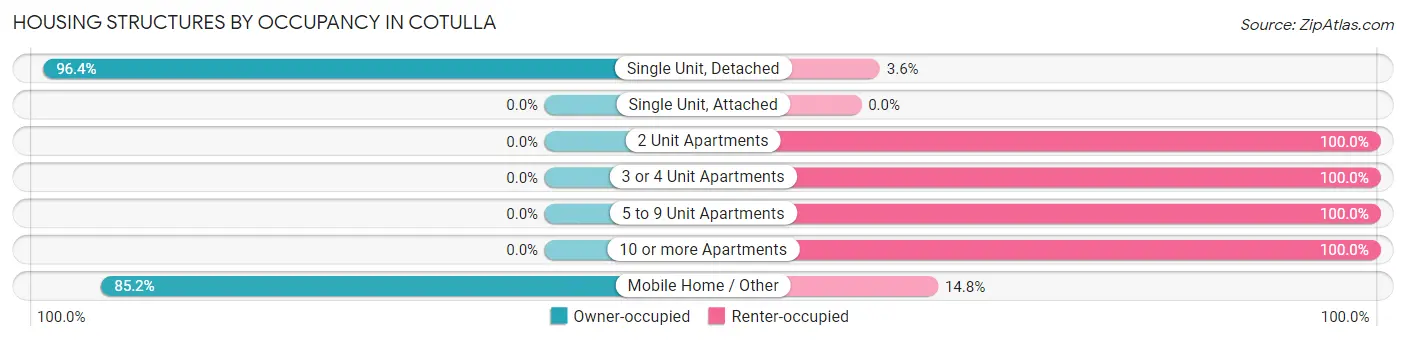
| Structure Type | Owner-occupied | Renter-occupied |
| Single Unit, Detached | 537 (96.4%) | 20 (3.6%) |
| Single Unit, Attached | 0 (0.0%) | 0 (0.0%) |
| 2 Unit Apartments | 0 (0.0%) | 102 (100.0%) |
| 3 or 4 Unit Apartments | 0 (0.0%) | 11 (100.0%) |
| 5 to 9 Unit Apartments | 0 (0.0%) | 70 (100.0%) |
| 10 or more Apartments | 0 (0.0%) | 9 (100.0%) |
| Mobile Home / Other | 265 (85.2%) | 46 (14.8%) |
| Total | 802 (75.7%) | 258 (24.3%) |
Housing Structures by Number of Rooms in Cotulla
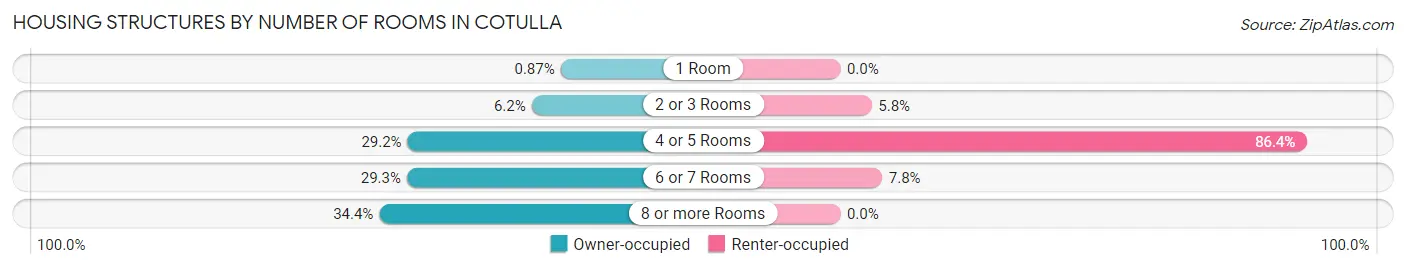
| Number of Rooms | Owner-occupied | Renter-occupied |
| 1 Room | 7 (0.9%) | 0 (0.0%) |
| 2 or 3 Rooms | 50 (6.2%) | 15 (5.8%) |
| 4 or 5 Rooms | 234 (29.2%) | 223 (86.4%) |
| 6 or 7 Rooms | 235 (29.3%) | 20 (7.7%) |
| 8 or more Rooms | 276 (34.4%) | 0 (0.0%) |
| Total | 802 (100.0%) | 258 (100.0%) |
Housing Structure by Heating Type in Cotulla
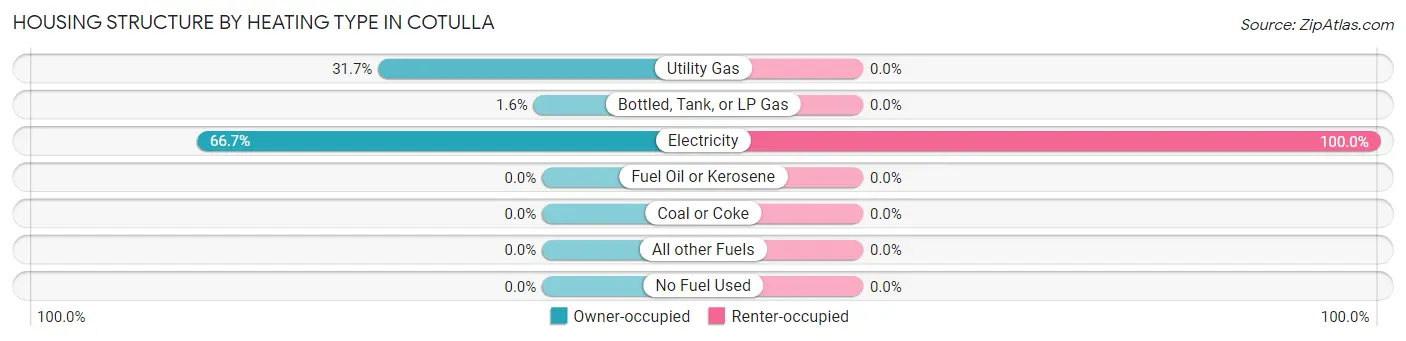
| Heating Type | Owner-occupied | Renter-occupied |
| Utility Gas | 254 (31.7%) | 0 (0.0%) |
| Bottled, Tank, or LP Gas | 13 (1.6%) | 0 (0.0%) |
| Electricity | 535 (66.7%) | 258 (100.0%) |
| Fuel Oil or Kerosene | 0 (0.0%) | 0 (0.0%) |
| Coal or Coke | 0 (0.0%) | 0 (0.0%) |
| All other Fuels | 0 (0.0%) | 0 (0.0%) |
| No Fuel Used | 0 (0.0%) | 0 (0.0%) |
| Total | 802 (100.0%) | 258 (100.0%) |
Household Vehicle Usage in Cotulla
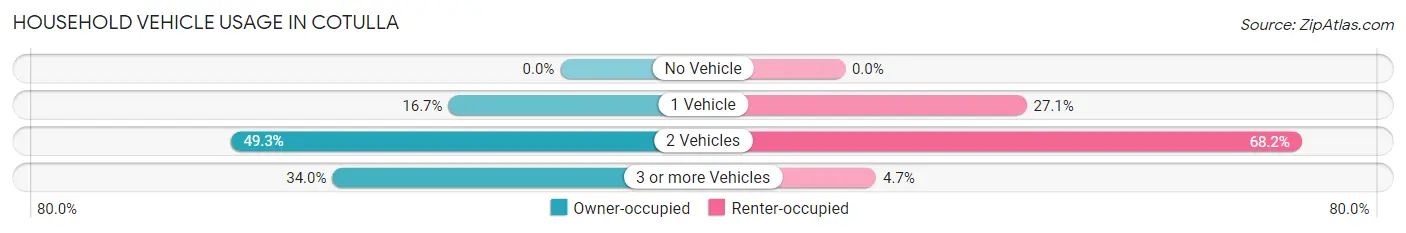
| Vehicles per Household | Owner-occupied | Renter-occupied |
| No Vehicle | 0 (0.0%) | 0 (0.0%) |
| 1 Vehicle | 134 (16.7%) | 70 (27.1%) |
| 2 Vehicles | 395 (49.2%) | 176 (68.2%) |
| 3 or more Vehicles | 273 (34.0%) | 12 (4.6%) |
| Total | 802 (100.0%) | 258 (100.0%) |
Real Estate & Mortgages in Cotulla
Real Estate and Mortgage Overview in Cotulla
| Characteristic | Without Mortgage | With Mortgage |
| Housing Units | 485 | 317 |
| Median Property Value | $89,100 | $180,100 |
| Median Household Income | $77,658 | $0 |
| Monthly Housing Costs | $456 | $42 |
| Real Estate Taxes | $577 | $0 |
Property Value by Mortgage Status in Cotulla
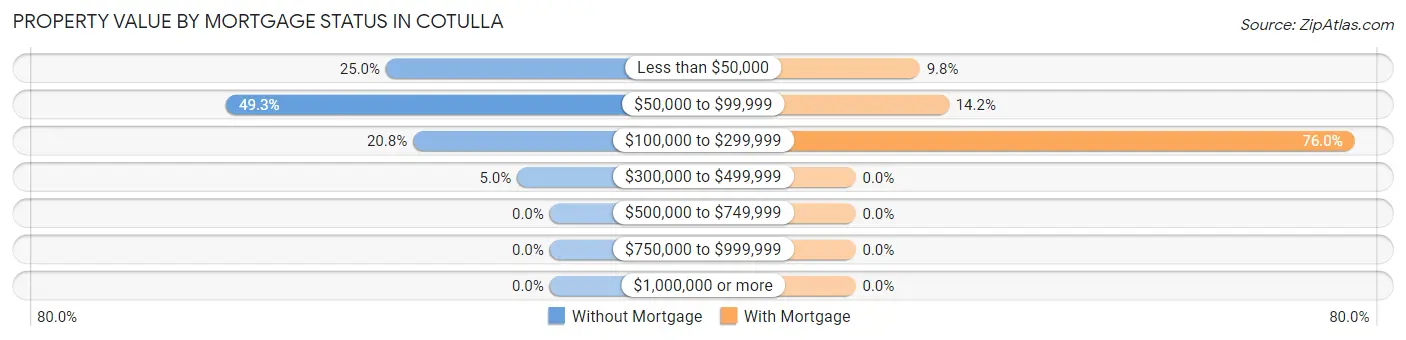
| Property Value | Without Mortgage | With Mortgage |
| Less than $50,000 | 121 (24.9%) | 31 (9.8%) |
| $50,000 to $99,999 | 239 (49.3%) | 45 (14.2%) |
| $100,000 to $299,999 | 101 (20.8%) | 241 (76.0%) |
| $300,000 to $499,999 | 24 (5.0%) | 0 (0.0%) |
| $500,000 to $749,999 | 0 (0.0%) | 0 (0.0%) |
| $750,000 to $999,999 | 0 (0.0%) | 0 (0.0%) |
| $1,000,000 or more | 0 (0.0%) | 0 (0.0%) |
| Total | 485 (100.0%) | 317 (100.0%) |
Household Income by Mortgage Status in Cotulla
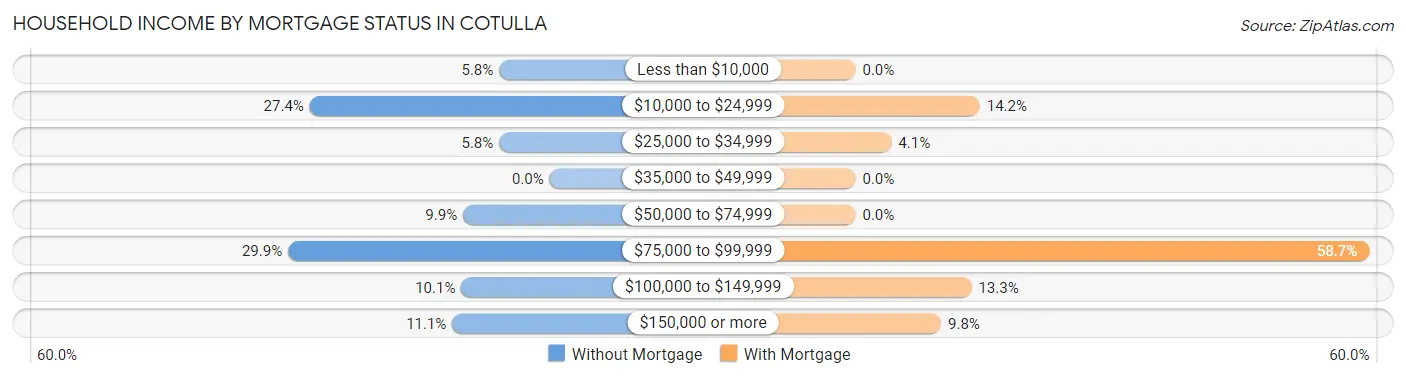
| Household Income | Without Mortgage | With Mortgage |
| Less than $10,000 | 28 (5.8%) | 0 (0.0%) |
| $10,000 to $24,999 | 133 (27.4%) | 45 (14.2%) |
| $25,000 to $34,999 | 28 (5.8%) | 13 (4.1%) |
| $35,000 to $49,999 | 0 (0.0%) | 0 (0.0%) |
| $50,000 to $74,999 | 48 (9.9%) | 0 (0.0%) |
| $75,000 to $99,999 | 145 (29.9%) | 186 (58.7%) |
| $100,000 to $149,999 | 49 (10.1%) | 42 (13.3%) |
| $150,000 or more | 54 (11.1%) | 31 (9.8%) |
| Total | 485 (100.0%) | 317 (100.0%) |
Property Value to Household Income Ratio in Cotulla
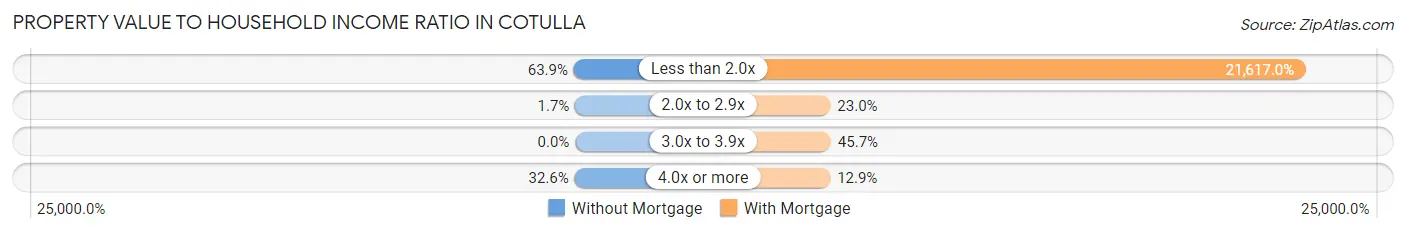
| Value-to-Income Ratio | Without Mortgage | With Mortgage |
| Less than 2.0x | 310 (63.9%) | 68,526 (21,617.0%) |
| 2.0x to 2.9x | 8 (1.7%) | 73 (23.0%) |
| 3.0x to 3.9x | 0 (0.0%) | 145 (45.7%) |
| 4.0x or more | 158 (32.6%) | 41 (12.9%) |
| Total | 485 (100.0%) | 317 (100.0%) |
Real Estate Taxes by Mortgage Status in Cotulla
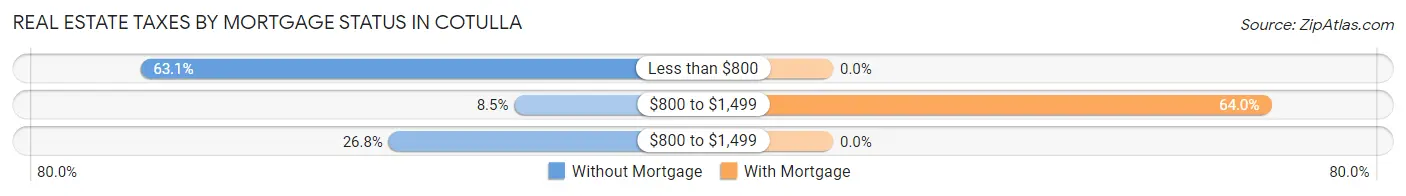
| Property Taxes | Without Mortgage | With Mortgage |
| Less than $800 | 306 (63.1%) | 0 (0.0%) |
| $800 to $1,499 | 41 (8.5%) | 203 (64.0%) |
| $800 to $1,499 | 130 (26.8%) | 0 (0.0%) |
| Total | 485 (100.0%) | 317 (100.0%) |
Health & Disability in Cotulla
Health Insurance Coverage by Age in Cotulla
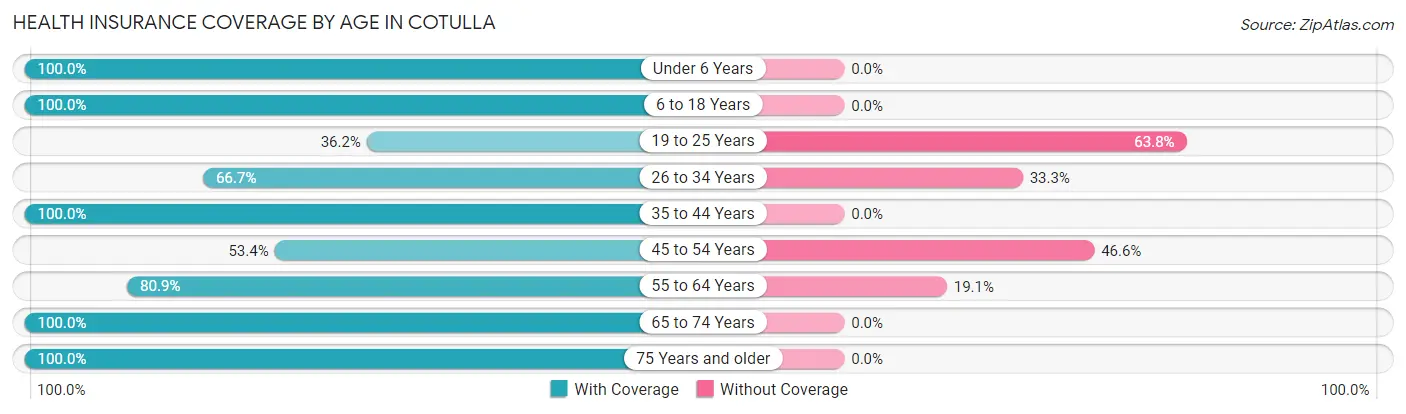
| Age Bracket | With Coverage | Without Coverage |
| Under 6 Years | 115 (100.0%) | 0 (0.0%) |
| 6 to 18 Years | 1,260 (100.0%) | 0 (0.0%) |
| 19 to 25 Years | 42 (36.2%) | 74 (63.8%) |
| 26 to 34 Years | 377 (66.7%) | 188 (33.3%) |
| 35 to 44 Years | 421 (100.0%) | 0 (0.0%) |
| 45 to 54 Years | 157 (53.4%) | 137 (46.6%) |
| 55 to 64 Years | 258 (80.9%) | 61 (19.1%) |
| 65 to 74 Years | 321 (100.0%) | 0 (0.0%) |
| 75 Years and older | 257 (100.0%) | 0 (0.0%) |
| Total | 3,208 (87.5%) | 460 (12.5%) |
Health Insurance Coverage by Citizenship Status in Cotulla
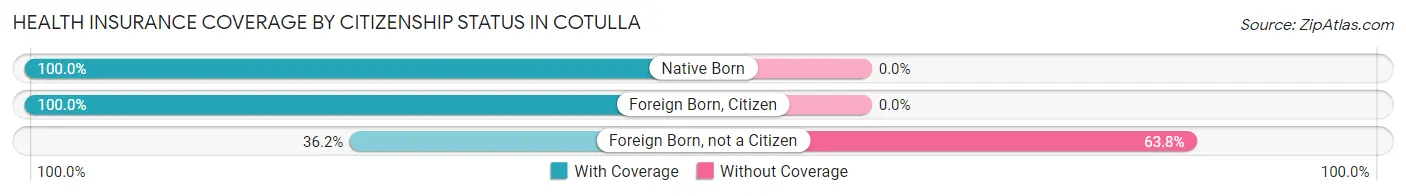
| Citizenship Status | With Coverage | Without Coverage |
| Native Born | 115 (100.0%) | 0 (0.0%) |
| Foreign Born, Citizen | 1,260 (100.0%) | 0 (0.0%) |
| Foreign Born, not a Citizen | 42 (36.2%) | 74 (63.8%) |
Health Insurance Coverage by Household Income in Cotulla
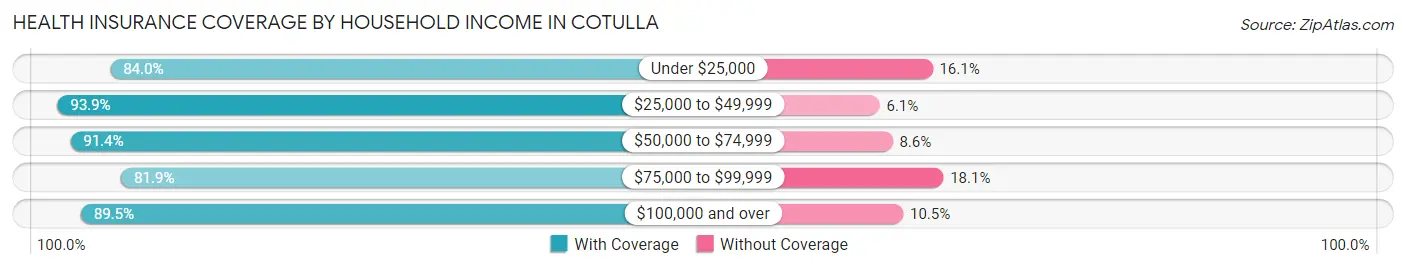
| Household Income | With Coverage | Without Coverage |
| Under $25,000 | 659 (84.0%) | 126 (16.1%) |
| $25,000 to $49,999 | 705 (93.9%) | 46 (6.1%) |
| $50,000 to $74,999 | 598 (91.4%) | 56 (8.6%) |
| $75,000 to $99,999 | 830 (81.9%) | 183 (18.1%) |
| $100,000 and over | 416 (89.5%) | 49 (10.5%) |
Public vs Private Health Insurance Coverage by Age in Cotulla
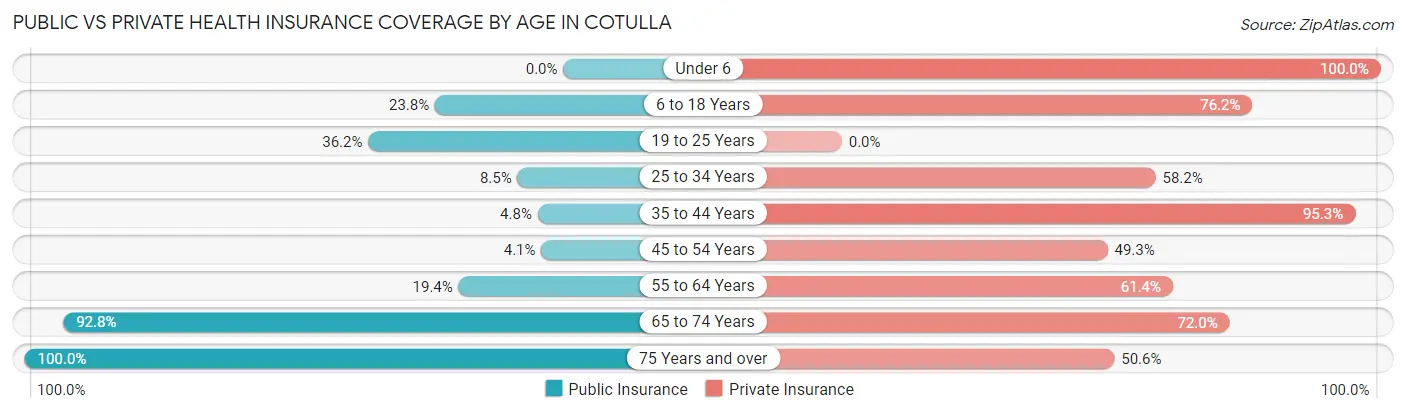
| Age Bracket | Public Insurance | Private Insurance |
| Under 6 | 0 (0.0%) | 115 (100.0%) |
| 6 to 18 Years | 300 (23.8%) | 960 (76.2%) |
| 19 to 25 Years | 42 (36.2%) | 0 (0.0%) |
| 25 to 34 Years | 48 (8.5%) | 329 (58.2%) |
| 35 to 44 Years | 20 (4.8%) | 401 (95.3%) |
| 45 to 54 Years | 12 (4.1%) | 145 (49.3%) |
| 55 to 64 Years | 62 (19.4%) | 196 (61.4%) |
| 65 to 74 Years | 298 (92.8%) | 231 (72.0%) |
| 75 Years and over | 257 (100.0%) | 130 (50.6%) |
| Total | 1,039 (28.3%) | 2,507 (68.3%) |
Disability Status by Sex by Age in Cotulla
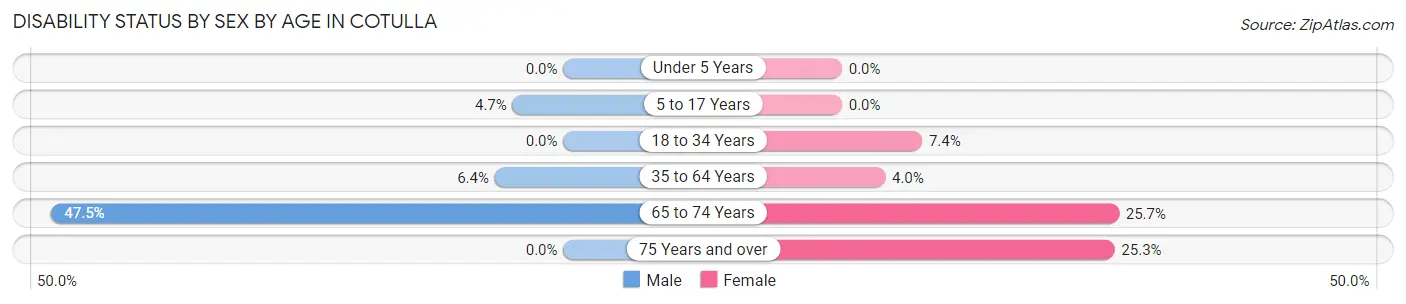
| Age Bracket | Male | Female |
| Under 5 Years | 0 (0.0%) | 0 (0.0%) |
| 5 to 17 Years | 24 (4.7%) | 0 (0.0%) |
| 18 to 34 Years | 0 (0.0%) | 18 (7.4%) |
| 35 to 64 Years | 34 (6.4%) | 20 (4.0%) |
| 65 to 74 Years | 86 (47.5%) | 36 (25.7%) |
| 75 Years and over | 0 (0.0%) | 42 (25.3%) |
Disability Class by Sex by Age in Cotulla
Disability Class: Hearing Difficulty
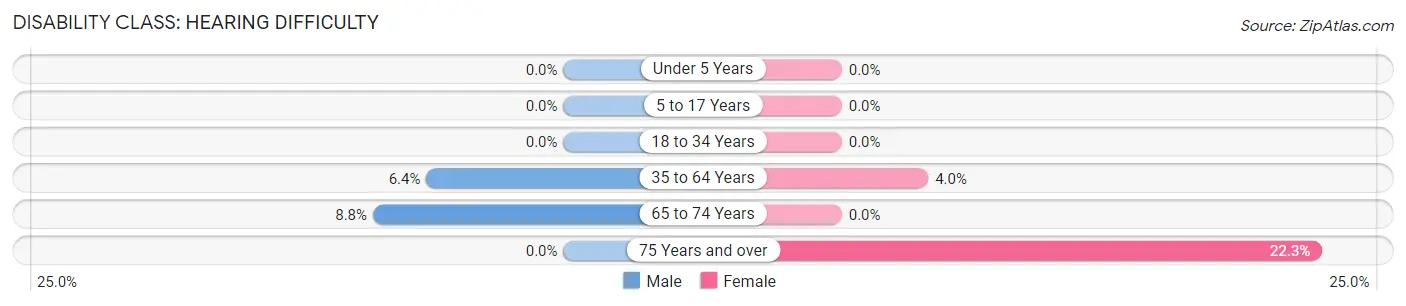
| Age Bracket | Male | Female |
| Under 5 Years | 0 (0.0%) | 0 (0.0%) |
| 5 to 17 Years | 0 (0.0%) | 0 (0.0%) |
| 18 to 34 Years | 0 (0.0%) | 0 (0.0%) |
| 35 to 64 Years | 34 (6.4%) | 20 (4.0%) |
| 65 to 74 Years | 16 (8.8%) | 0 (0.0%) |
| 75 Years and over | 0 (0.0%) | 37 (22.3%) |
Disability Class: Vision Difficulty
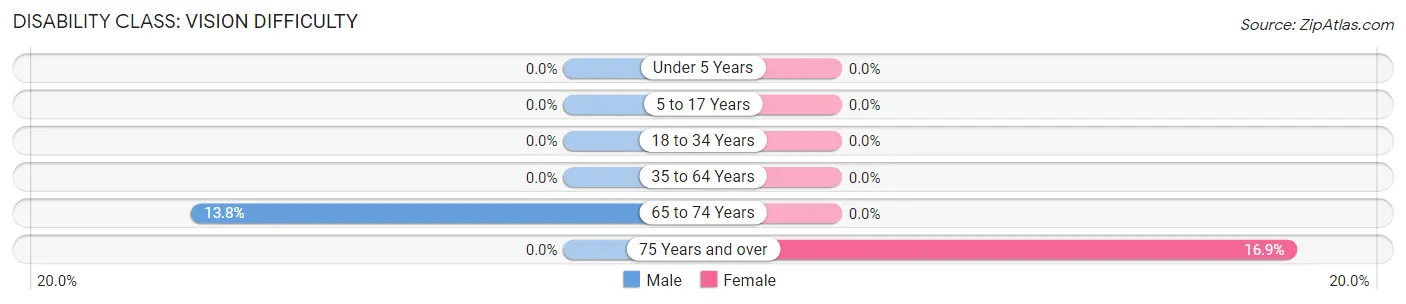
| Age Bracket | Male | Female |
| Under 5 Years | 0 (0.0%) | 0 (0.0%) |
| 5 to 17 Years | 0 (0.0%) | 0 (0.0%) |
| 18 to 34 Years | 0 (0.0%) | 0 (0.0%) |
| 35 to 64 Years | 0 (0.0%) | 0 (0.0%) |
| 65 to 74 Years | 25 (13.8%) | 0 (0.0%) |
| 75 Years and over | 0 (0.0%) | 28 (16.9%) |
Disability Class: Cognitive Difficulty
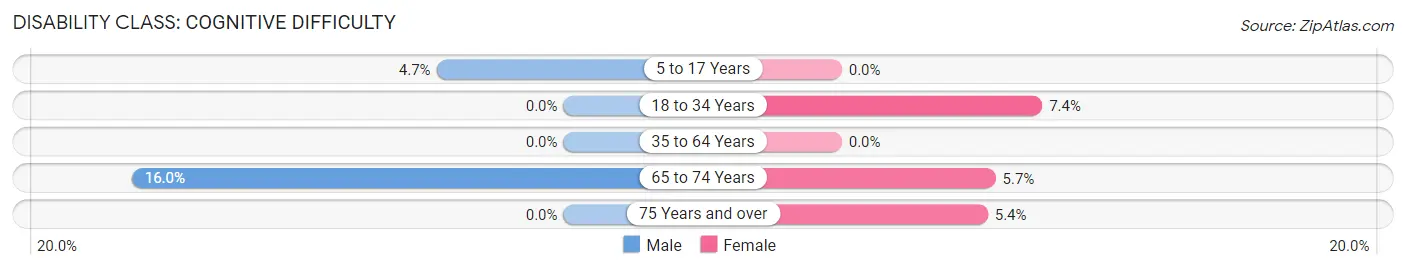
| Age Bracket | Male | Female |
| 5 to 17 Years | 24 (4.7%) | 0 (0.0%) |
| 18 to 34 Years | 0 (0.0%) | 18 (7.4%) |
| 35 to 64 Years | 0 (0.0%) | 0 (0.0%) |
| 65 to 74 Years | 29 (16.0%) | 8 (5.7%) |
| 75 Years and over | 0 (0.0%) | 9 (5.4%) |
Disability Class: Ambulatory Difficulty
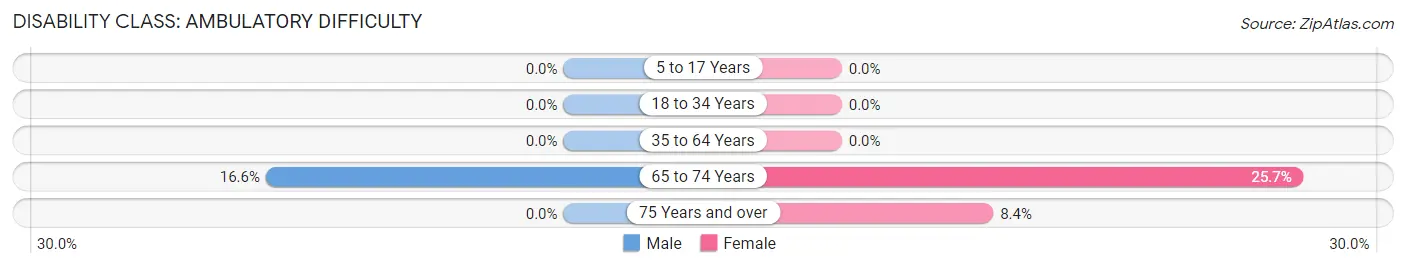
| Age Bracket | Male | Female |
| 5 to 17 Years | 0 (0.0%) | 0 (0.0%) |
| 18 to 34 Years | 0 (0.0%) | 0 (0.0%) |
| 35 to 64 Years | 0 (0.0%) | 0 (0.0%) |
| 65 to 74 Years | 30 (16.6%) | 36 (25.7%) |
| 75 Years and over | 0 (0.0%) | 14 (8.4%) |
Disability Class: Self-Care Difficulty
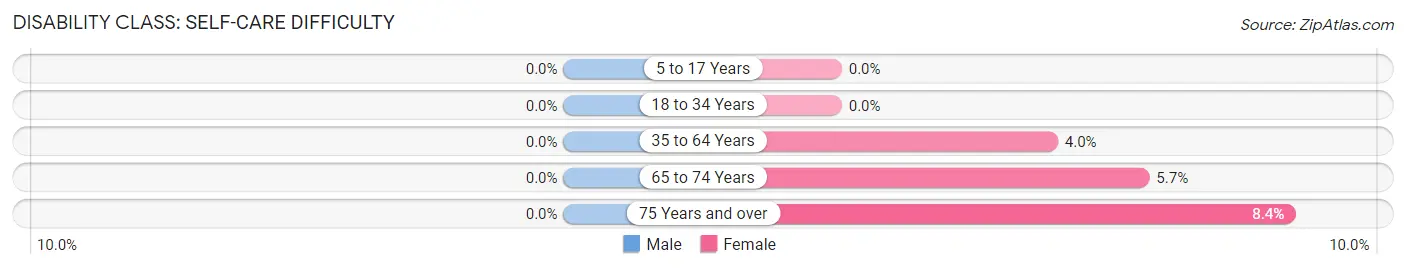
| Age Bracket | Male | Female |
| 5 to 17 Years | 0 (0.0%) | 0 (0.0%) |
| 18 to 34 Years | 0 (0.0%) | 0 (0.0%) |
| 35 to 64 Years | 0 (0.0%) | 20 (4.0%) |
| 65 to 74 Years | 0 (0.0%) | 8 (5.7%) |
| 75 Years and over | 0 (0.0%) | 14 (8.4%) |
Technology Access in Cotulla
Computing Device Access in Cotulla
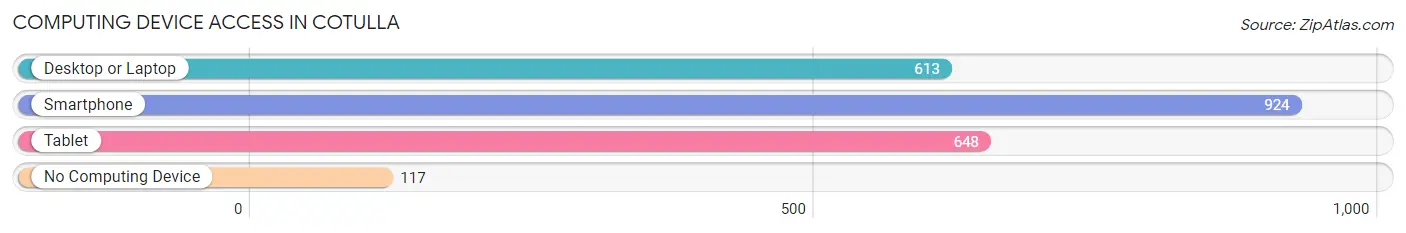
| Device Type | # Households | % Households |
| Desktop or Laptop | 613 | 57.8% |
| Smartphone | 924 | 87.2% |
| Tablet | 648 | 61.1% |
| No Computing Device | 117 | 11.0% |
| Total | 1,060 | 100.0% |
Internet Access in Cotulla
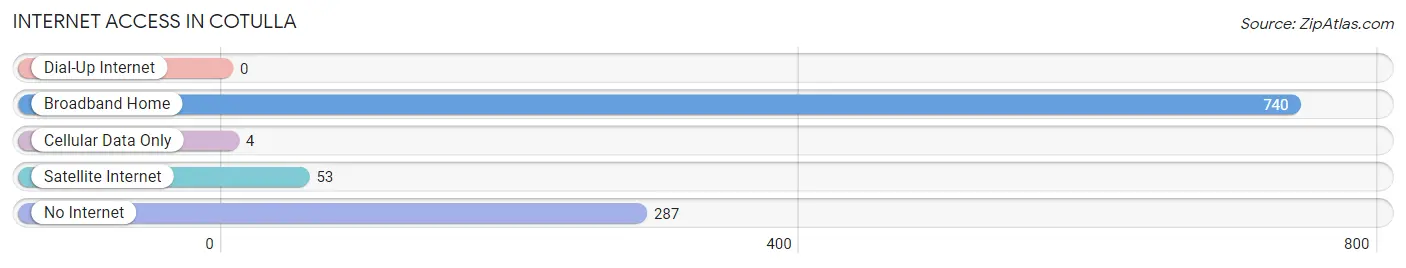
| Internet Type | # Households | % Households |
| Dial-Up Internet | 0 | 0.0% |
| Broadband Home | 740 | 69.8% |
| Cellular Data Only | 4 | 0.4% |
| Satellite Internet | 53 | 5.0% |
| No Internet | 287 | 27.1% |
| Total | 1,060 | 100.0% |
Cotulla Summary
Cotulla is a city located in La Salle County, Texas, United States. It is the county seat of La Salle County and is located on the Nueces River, about 90 miles southwest of San Antonio. The population was 3,614 at the 2010 census.
History
Cotulla was founded in 1881 by Joseph Cotulla, a Polish immigrant who had come to Texas in 1868. He purchased land in the area and established a trading post, which eventually grew into a small town. The town was named after him and incorporated in 1883.
In the early 1900s, Cotulla was a bustling center of commerce and industry, with several stores, a hotel, a bank, and a cotton gin. The town was also home to a large number of Mexican immigrants, who worked in the local ranches and farms.
In the 1920s, Cotulla experienced a period of rapid growth, as oil was discovered in the area. The discovery of oil brought an influx of people and money to the town, and the population grew to over 5,000 by 1930.
The oil boom ended in the 1930s, and the population of Cotulla began to decline. The town was hit hard by the Great Depression, and many of the businesses closed. The population continued to decline until the 1950s, when the economy began to improve.
Geography
Cotulla is located in La Salle County, Texas, at the intersection of U.S. Route 83 and State Highway 97. It is about 90 miles southwest of San Antonio and about 150 miles northwest of Corpus Christi.
The city has a total area of 4.2 square miles, all of which is land. The terrain is mostly flat, with some rolling hills. The climate is semi-arid, with hot summers and mild winters.
Economy
Cotulla’s economy is largely based on agriculture and oil production. The city is home to several large ranches and farms, which produce a variety of crops, including cotton, corn, wheat, and sorghum.
The city is also home to several oil and gas companies, which produce oil and natural gas from the area’s many oil fields. The oil and gas industry is a major employer in the city, and provides a significant portion of the city’s revenue.
In addition to agriculture and oil production, Cotulla is home to several manufacturing companies, which produce a variety of products, including furniture, clothing, and electronics. The city is also home to several retail stores, restaurants, and other businesses.
Demographics
As of the 2010 census, the population of Cotulla was 3,614. The racial makeup of the city was 73.3% White, 0.7% African American, 0.3% Native American, 0.2% Asian, 0.1% Pacific Islander, 23.7% from other races, and 1.9% from two or more races. Hispanic or Latino of any race were 81.2% of the population.
The median household income in Cotulla was $25,938, and the median family income was $30,938. About 24.3% of the population was below the poverty line.
Conclusion
Cotulla is a small city located in La Salle County, Texas. It was founded in 1881 by Joseph Cotulla, a Polish immigrant, and has a population of 3,614 as of the 2010 census. The city’s economy is largely based on agriculture and oil production, and it is home to several large ranches and farms, as well as several oil and gas companies. The racial makeup of the city is mostly Hispanic or Latino, and the median household income is $25,938.
Common Questions
What is Per Capita Income in Cotulla?
Per Capita income in Cotulla is $17,867.
What is the Median Family Income in Cotulla?
Median Family Income in Cotulla is $55,671.
What is the Median Household income in Cotulla?
Median Household Income in Cotulla is $68,431.
What is Family Income Deficit in Cotulla?
Family Income Deficit in Cotulla is $8,105.
Families that are below poverty line in Cotulla earn $8,105 less on average than the poverty threshold level.
What is Inequality or Gini Index in Cotulla?
Inequality or Gini Index in Cotulla is 0.35.
What is the Total Population of Cotulla?
Total Population of Cotulla is 3,714.
What is the Total Male Population of Cotulla?
Total Male Population of Cotulla is 2,136.
What is the Total Female Population of Cotulla?
Total Female Population of Cotulla is 1,578.
What is the Ratio of Males per 100 Females in Cotulla?
There are 135.36 Males per 100 Females in Cotulla.
What is the Ratio of Females per 100 Males in Cotulla?
There are 73.88 Females per 100 Males in Cotulla.
What is the Median Population Age in Cotulla?
Median Population Age in Cotulla is 33.1 Years.
What is the Average Family Size in Cotulla
Average Family Size in Cotulla is 3.6 People.
What is the Average Household Size in Cotulla
Average Household Size in Cotulla is 3.5 People.
How Large is the Labor Force in Cotulla?
There are 1,460 People in the Labor Forcein in Cotulla.
What is the Percentage of People in the Labor Force in Cotulla?
52.6% of People are in the Labor Force in Cotulla.
What is the Unemployment Rate in Cotulla?
Unemployment Rate in Cotulla is 5.9%.