Aspermont, TX Map & Demographics
Aspermont Map
Aspermont Overview
$23,238
PER CAPITA INCOME
$81,806
AVG FAMILY INCOME
$78,750
AVG HOUSEHOLD INCOME
55.3%
WAGE / INCOME GAP [ % ]
44.7¢/ $1
WAGE / INCOME GAP [ $ ]
0.33
INEQUALITY / GINI INDEX
1,057
TOTAL POPULATION
526
MALE POPULATION
531
FEMALE POPULATION
99.06
MALES / 100 FEMALES
100.95
FEMALES / 100 MALES
30.0
MEDIAN AGE
3.9
AVG FAMILY SIZE
3.3
AVG HOUSEHOLD SIZE
533
LABOR FORCE [ PEOPLE ]
68.5%
PERCENT IN LABOR FORCE
2.3%
UNEMPLOYMENT RATE
Aspermont Zip Codes
Income in Aspermont
Income Overview in Aspermont
Per Capita Income in Aspermont is $23,238, while median incomes of families and households are $81,806 and $78,750 respectively.
| Characteristic | Number | Measure |
| Per Capita Income | 1,057 | $23,238 |
| Median Family Income | 235 | $81,806 |
| Mean Family Income | 235 | $83,938 |
| Median Household Income | 308 | $78,750 |
| Mean Household Income | 308 | $74,498 |
| Income Deficit | 235 | $0 |
| Wage / Income Gap (%) | 1,057 | 55.27% |
| Wage / Income Gap ($) | 1,057 | 44.73¢ per $1 |
| Gini / Inequality Index | 1,057 | 0.33 |
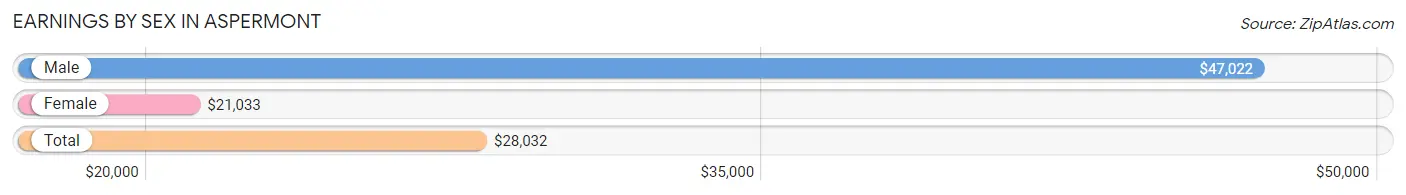
Earnings by Sex in Aspermont
Average Earnings in Aspermont are $28,032, $47,022 for men and $21,033 for women, a difference of 55.3%.
| Sex | Number | Average Earnings |
| Male | 289 (49.7%) | $47,022 |
| Female | 293 (50.3%) | $21,033 |
| Total | 582 (100.0%) | $28,032 |
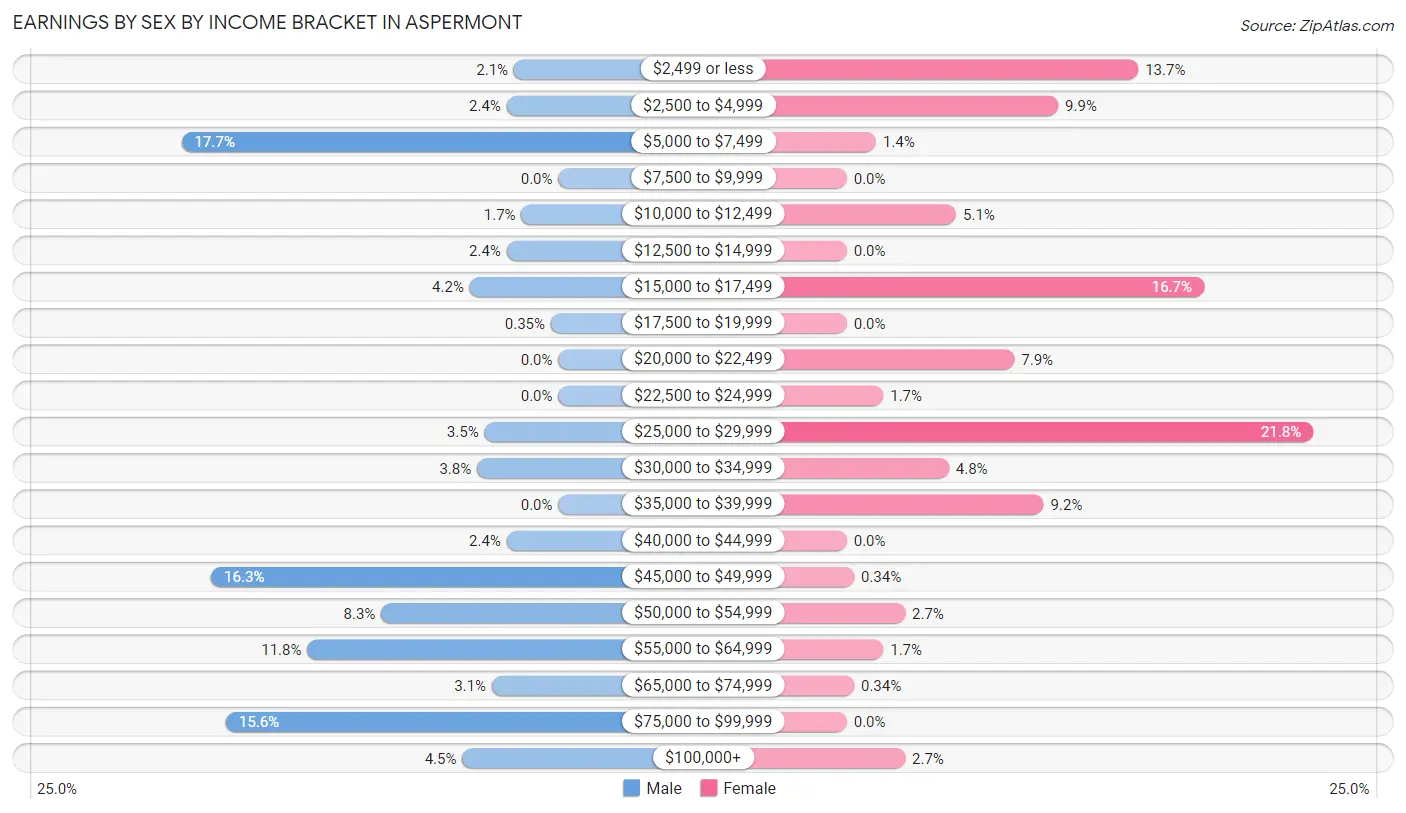
Earnings by Sex by Income Bracket in Aspermont
The most common earnings brackets in Aspermont are $5,000 to $7,499 for men (51 | 17.6%) and $25,000 to $29,999 for women (64 | 21.8%).
| Income | Male | Female |
| $2,499 or less | 6 (2.1%) | 40 (13.7%) |
| $2,500 to $4,999 | 7 (2.4%) | 29 (9.9%) |
| $5,000 to $7,499 | 51 (17.6%) | 4 (1.4%) |
| $7,500 to $9,999 | 0 (0.0%) | 0 (0.0%) |
| $10,000 to $12,499 | 5 (1.7%) | 15 (5.1%) |
| $12,500 to $14,999 | 7 (2.4%) | 0 (0.0%) |
| $15,000 to $17,499 | 12 (4.2%) | 49 (16.7%) |
| $17,500 to $19,999 | 1 (0.4%) | 0 (0.0%) |
| $20,000 to $22,499 | 0 (0.0%) | 23 (7.9%) |
| $22,500 to $24,999 | 0 (0.0%) | 5 (1.7%) |
| $25,000 to $29,999 | 10 (3.5%) | 64 (21.8%) |
| $30,000 to $34,999 | 11 (3.8%) | 14 (4.8%) |
| $35,000 to $39,999 | 0 (0.0%) | 27 (9.2%) |
| $40,000 to $44,999 | 7 (2.4%) | 0 (0.0%) |
| $45,000 to $49,999 | 47 (16.3%) | 1 (0.3%) |
| $50,000 to $54,999 | 24 (8.3%) | 8 (2.7%) |
| $55,000 to $64,999 | 34 (11.8%) | 5 (1.7%) |
| $65,000 to $74,999 | 9 (3.1%) | 1 (0.3%) |
| $75,000 to $99,999 | 45 (15.6%) | 0 (0.0%) |
| $100,000+ | 13 (4.5%) | 8 (2.7%) |
| Total | 289 (100.0%) | 293 (100.0%) |
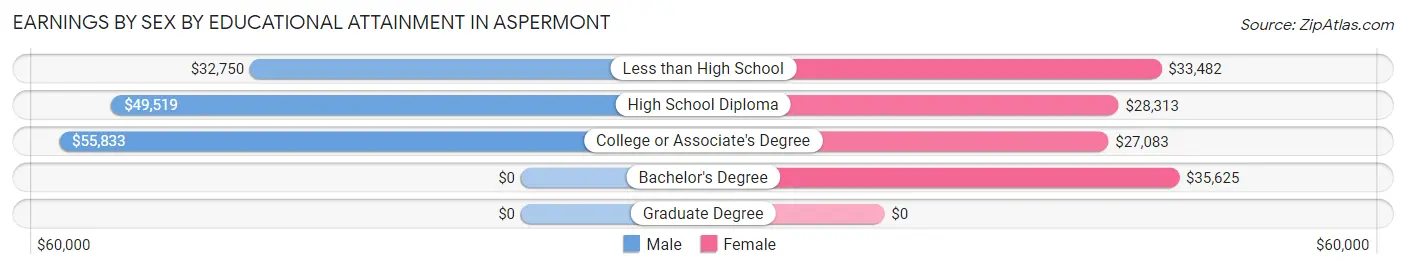
Earnings by Sex by Educational Attainment in Aspermont
Average earnings in Aspermont are $47,885 for men and $28,598 for women, a difference of 40.3%. Men with an educational attainment of college or associate's degree enjoy the highest average annual earnings of $55,833, while those with less than high school education earn the least with $32,750. Women with an educational attainment of bachelor's degree earn the most with the average annual earnings of $35,625, while those with college or associate's degree education have the smallest earnings of $27,083.
| Educational Attainment | Male Income | Female Income |
| Less than High School | $32,750 | $33,482 |
| High School Diploma | $49,519 | $28,313 |
| College or Associate's Degree | $55,833 | $27,083 |
| Bachelor's Degree | - | - |
| Graduate Degree | - | - |
| Total | $47,885 | $28,598 |
Family Income in Aspermont
Family Income Brackets in Aspermont
According to the Aspermont family income data, there are 65 families falling into the $100,000 to $149,999 income range, which is the most common income bracket and makes up 27.7% of all families.
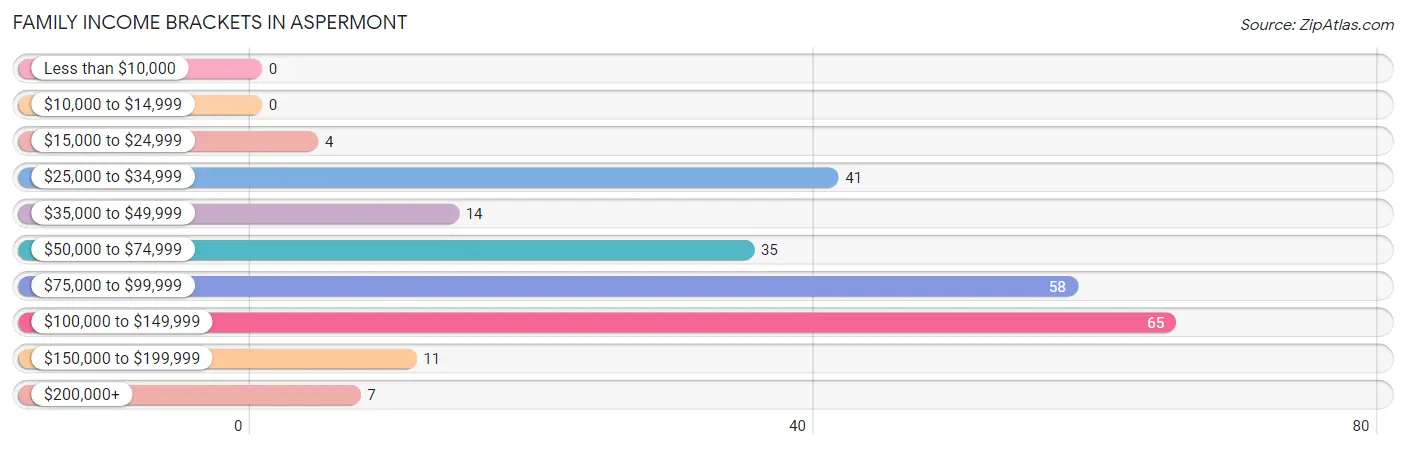
| Income Bracket | # Families | % Families |
| Less than $10,000 | 0 | 0.0% |
| $10,000 to $14,999 | 0 | 0.0% |
| $15,000 to $24,999 | 4 | 1.7% |
| $25,000 to $34,999 | 41 | 17.4% |
| $35,000 to $49,999 | 14 | 6.0% |
| $50,000 to $74,999 | 35 | 14.9% |
| $75,000 to $99,999 | 58 | 24.7% |
| $100,000 to $149,999 | 65 | 27.7% |
| $150,000 to $199,999 | 11 | 4.7% |
| $200,000+ | 7 | 3.0% |
Family Income by Famaliy Size in Aspermont
2-person families (76 | 32.3%) account for the highest median family income in Aspermont with $103,750 per family, while 2-person families (76 | 32.3%) have the highest median income of $51,875 per family member.
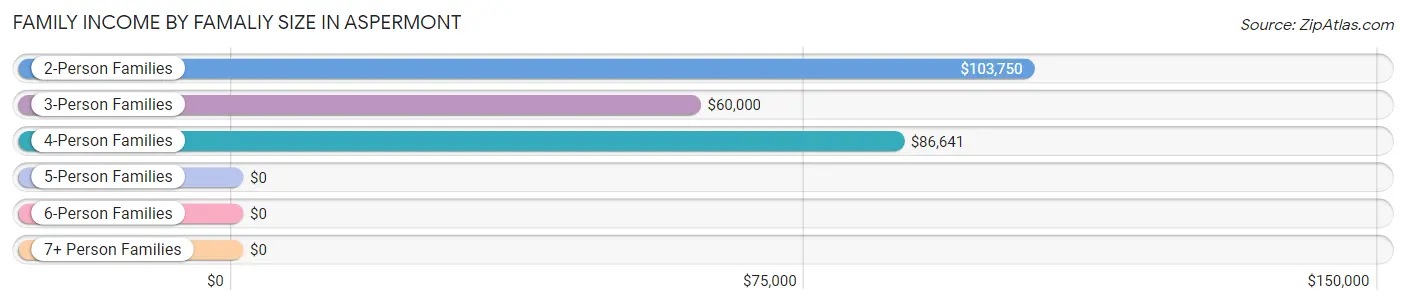
| Income Bracket | # Families | Median Income |
| 2-Person Families | 76 (32.3%) | $103,750 |
| 3-Person Families | 54 (23.0%) | $60,000 |
| 4-Person Families | 61 (26.0%) | $86,641 |
| 5-Person Families | 34 (14.5%) | $0 |
| 6-Person Families | 0 (0.0%) | $0 |
| 7+ Person Families | 10 (4.3%) | $0 |
| Total | 235 (100.0%) | $81,806 |
Family Income by Number of Earners in Aspermont
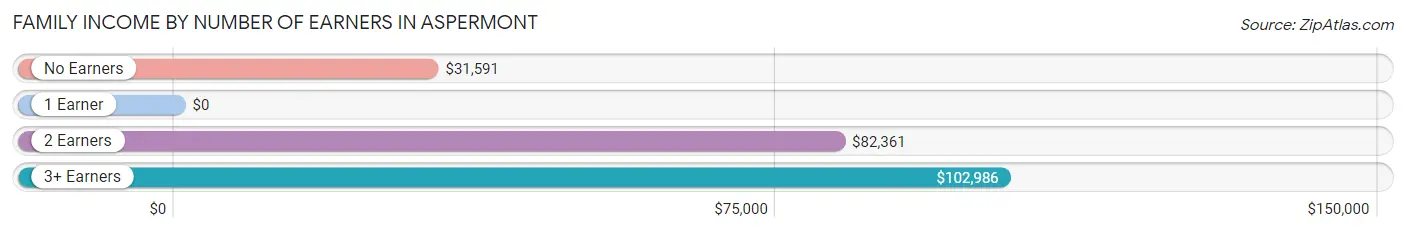
| Number of Earners | # Families | Median Income |
| No Earners | 14 (6.0%) | $31,591 |
| 1 Earner | 43 (18.3%) | $0 |
| 2 Earners | 139 (59.2%) | $82,361 |
| 3+ Earners | 39 (16.6%) | $102,986 |
| Total | 235 (100.0%) | $81,806 |
Household Income in Aspermont
Household Income Brackets in Aspermont
With 70 households falling in the category, the $75,000 to $99,999 income range is the most frequent in Aspermont, accounting for 22.7% of all households. In contrast, only 7 households (2.3%) fall into the $10,000 to $14,999 income bracket, making it the least populous group.
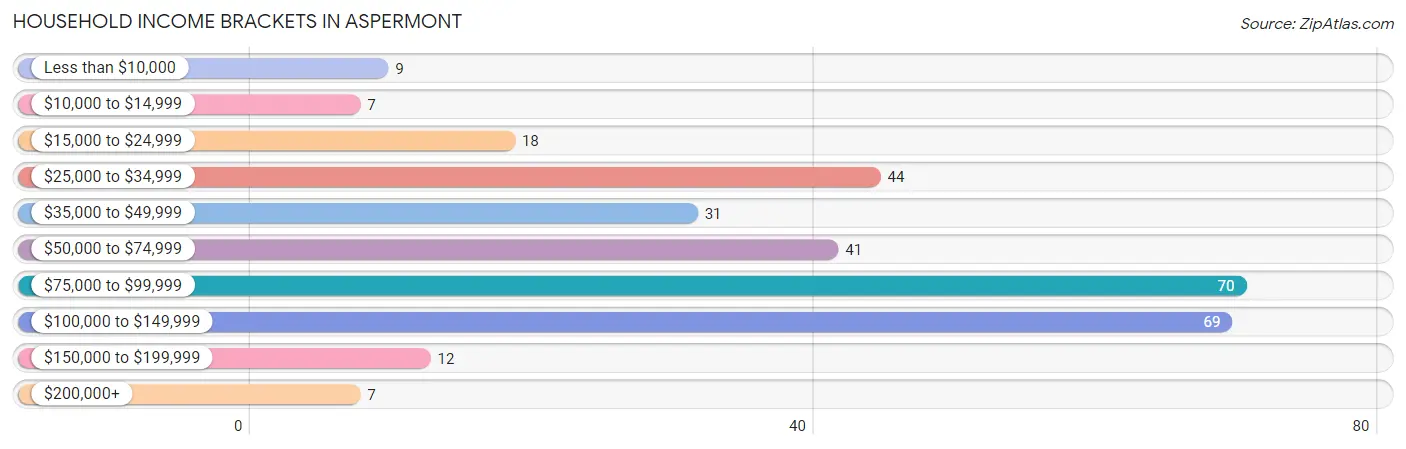
| Income Bracket | # Households | % Households |
| Less than $10,000 | 9 | 2.9% |
| $10,000 to $14,999 | 7 | 2.3% |
| $15,000 to $24,999 | 18 | 5.8% |
| $25,000 to $34,999 | 44 | 14.3% |
| $35,000 to $49,999 | 31 | 10.1% |
| $50,000 to $74,999 | 41 | 13.3% |
| $75,000 to $99,999 | 70 | 22.7% |
| $100,000 to $149,999 | 69 | 22.4% |
| $150,000 to $199,999 | 12 | 3.9% |
| $200,000+ | 7 | 2.3% |
Household Income by Householder Age in Aspermont
The median household income in Aspermont is $78,750, with the highest median household income of $97,500 found in the 45 to 64 years age bracket for the primary householder. A total of 132 households (42.9%) fall into this category. Meanwhile, the 15 to 24 years age bracket for the primary householder has the lowest median household income of $0, with 26 households (8.4%) in this group.
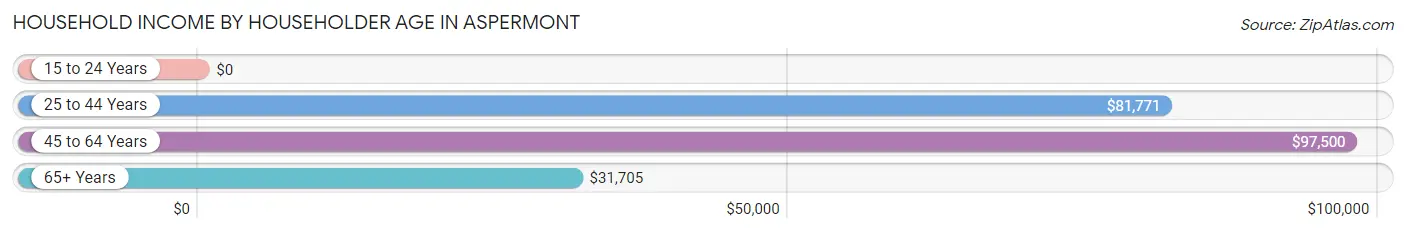
| Income Bracket | # Households | Median Income |
| 15 to 24 Years | 26 (8.4%) | $0 |
| 25 to 44 Years | 65 (21.1%) | $81,771 |
| 45 to 64 Years | 132 (42.9%) | $97,500 |
| 65+ Years | 85 (27.6%) | $31,705 |
| Total | 308 (100.0%) | $78,750 |
Poverty in Aspermont
Income Below Poverty by Sex and Age in Aspermont
With 6.1% poverty level for males and 5.5% for females among the residents of Aspermont, 12 to 14 year old males and 5 year old females are the most vulnerable to poverty, with 6 males (18.2%) and 6 females (66.7%) in their respective age groups living below the poverty level.
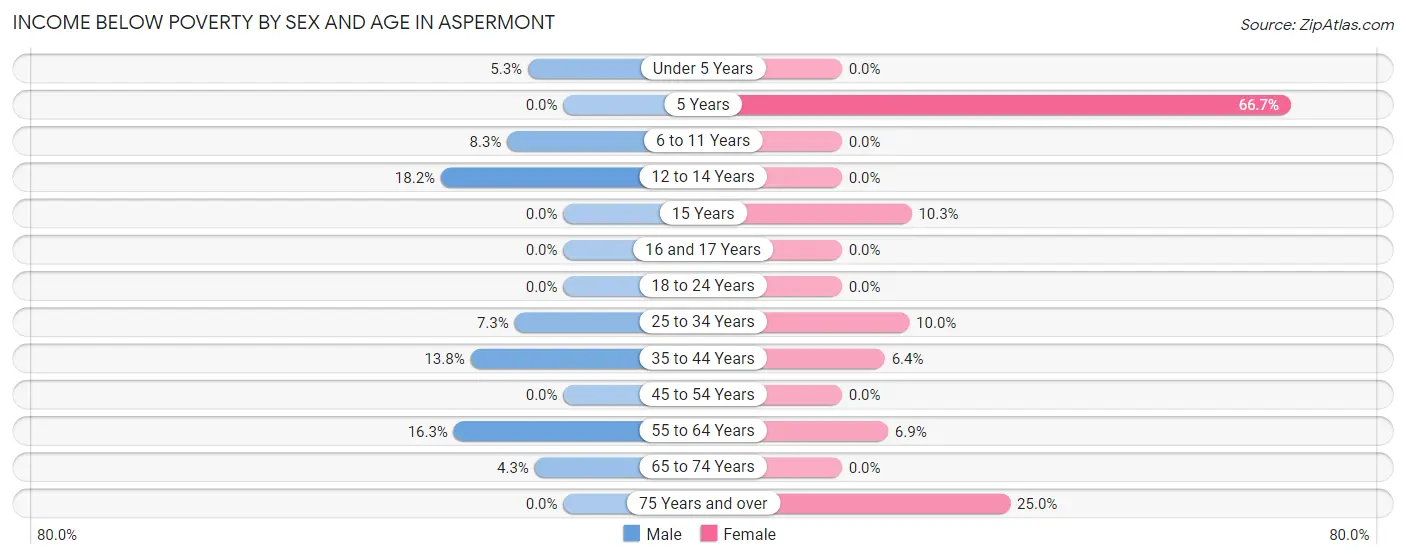
| Age Bracket | Male | Female |
| Under 5 Years | 4 (5.3%) | 0 (0.0%) |
| 5 Years | 0 (0.0%) | 6 (66.7%) |
| 6 to 11 Years | 3 (8.3%) | 0 (0.0%) |
| 12 to 14 Years | 6 (18.2%) | 0 (0.0%) |
| 15 Years | 0 (0.0%) | 3 (10.3%) |
| 16 and 17 Years | 0 (0.0%) | 0 (0.0%) |
| 18 to 24 Years | 0 (0.0%) | 0 (0.0%) |
| 25 to 34 Years | 5 (7.2%) | 4 (10.0%) |
| 35 to 44 Years | 4 (13.8%) | 3 (6.4%) |
| 45 to 54 Years | 0 (0.0%) | 0 (0.0%) |
| 55 to 64 Years | 7 (16.3%) | 5 (6.9%) |
| 65 to 74 Years | 2 (4.3%) | 0 (0.0%) |
| 75 Years and over | 0 (0.0%) | 7 (25.0%) |
| Total | 31 (6.1%) | 28 (5.5%) |
Income Above Poverty by Sex and Age in Aspermont
According to the poverty statistics in Aspermont, males aged 5 years and females aged under 5 years are the age groups that are most secure financially, with 100.0% of males and 100.0% of females in these age groups living above the poverty line.
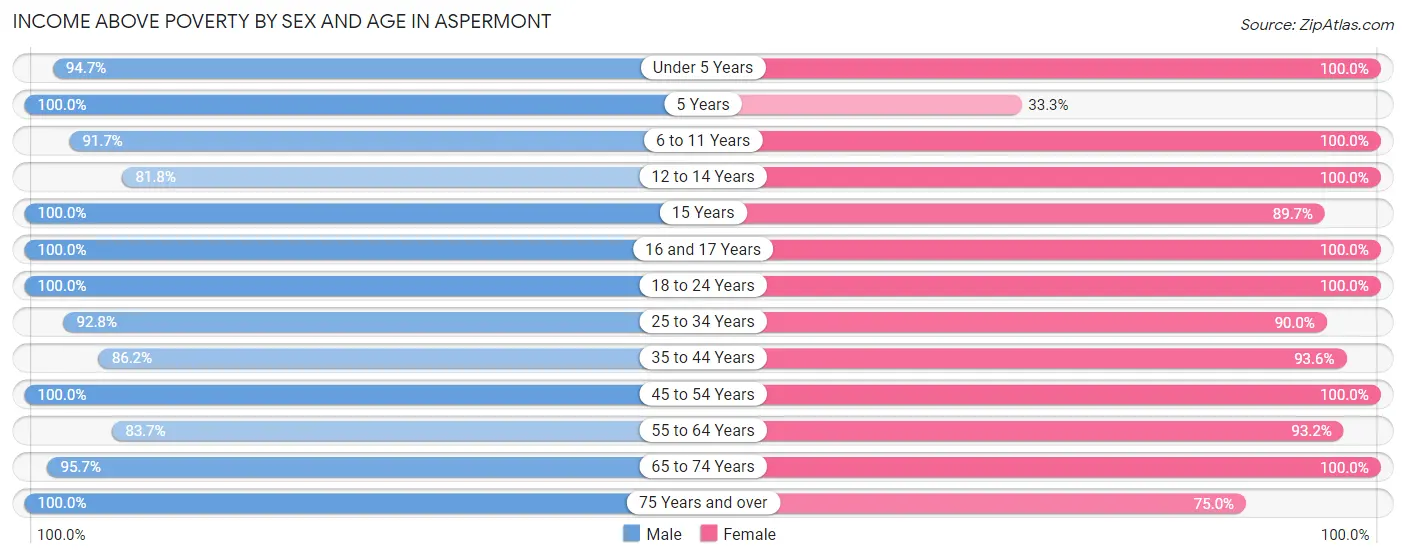
| Age Bracket | Male | Female |
| Under 5 Years | 72 (94.7%) | 49 (100.0%) |
| 5 Years | 13 (100.0%) | 3 (33.3%) |
| 6 to 11 Years | 33 (91.7%) | 7 (100.0%) |
| 12 to 14 Years | 27 (81.8%) | 21 (100.0%) |
| 15 Years | 6 (100.0%) | 26 (89.7%) |
| 16 and 17 Years | 21 (100.0%) | 36 (100.0%) |
| 18 to 24 Years | 74 (100.0%) | 94 (100.0%) |
| 25 to 34 Years | 64 (92.7%) | 36 (90.0%) |
| 35 to 44 Years | 25 (86.2%) | 44 (93.6%) |
| 45 to 54 Years | 45 (100.0%) | 34 (100.0%) |
| 55 to 64 Years | 36 (83.7%) | 68 (93.1%) |
| 65 to 74 Years | 45 (95.7%) | 43 (100.0%) |
| 75 Years and over | 13 (100.0%) | 21 (75.0%) |
| Total | 474 (93.9%) | 482 (94.5%) |
Income Below Poverty Among Married-Couple Families in Aspermont
The poverty statistics for married-couple families in Aspermont show that 4.3% or 8 of the total 186 families live below the poverty line. Families with 3 or 4 children have the highest poverty rate of 20.0%, comprising of 4 families. On the other hand, families with no children have the lowest poverty rate of 0.0%, which includes 0 families.
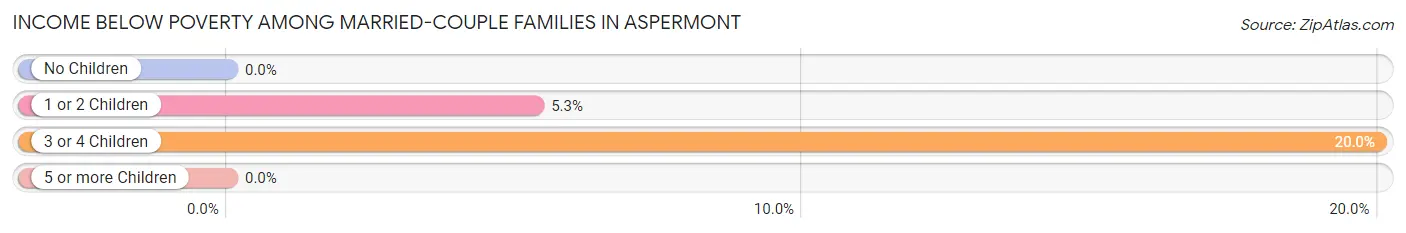
| Children | Above Poverty | Below Poverty |
| No Children | 81 (100.0%) | 0 (0.0%) |
| 1 or 2 Children | 71 (94.7%) | 4 (5.3%) |
| 3 or 4 Children | 16 (80.0%) | 4 (20.0%) |
| 5 or more Children | 10 (100.0%) | 0 (0.0%) |
| Total | 178 (95.7%) | 8 (4.3%) |
Income Below Poverty Among Single-Parent Households in Aspermont
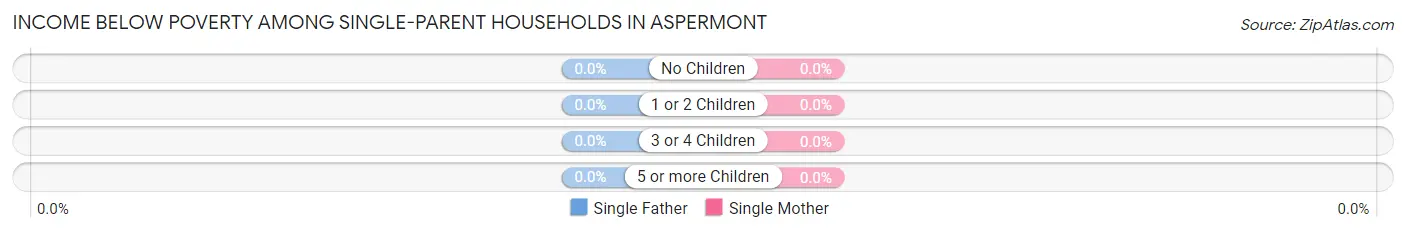
| Children | Single Father | Single Mother |
| No Children | 0 (0.0%) | 0 (0.0%) |
| 1 or 2 Children | 0 (0.0%) | 0 (0.0%) |
| 3 or 4 Children | 0 (0.0%) | 0 (0.0%) |
| 5 or more Children | 0 (0.0%) | 0 (0.0%) |
| Total | 0 (0.0%) | 0 (0.0%) |
Income Below Poverty Among Married-Couple vs Single-Parent Households in Aspermont
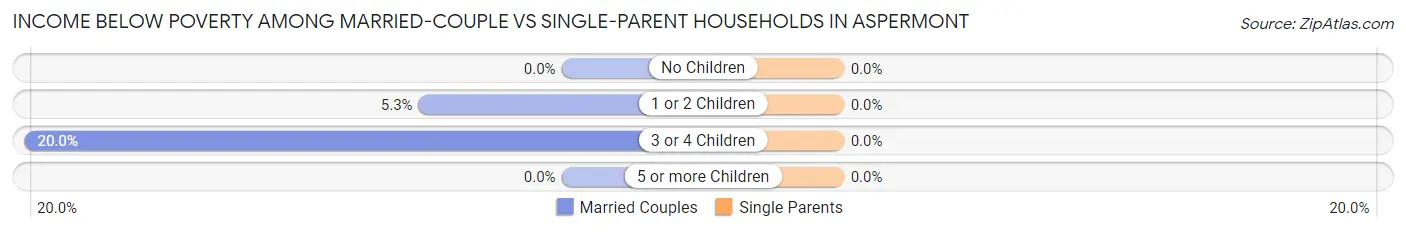
| Children | Married-Couple Families | Single-Parent Households |
| No Children | 0 (0.0%) | 0 (0.0%) |
| 1 or 2 Children | 4 (5.3%) | 0 (0.0%) |
| 3 or 4 Children | 4 (20.0%) | 0 (0.0%) |
| 5 or more Children | 0 (0.0%) | 0 (0.0%) |
| Total | 8 (4.3%) | 0 (0.0%) |
Race in Aspermont
The most populous races in Aspermont are White / Caucasian (931 | 88.1%), Hispanic or Latino (301 | 28.5%), and Some other Race (68 | 6.4%).
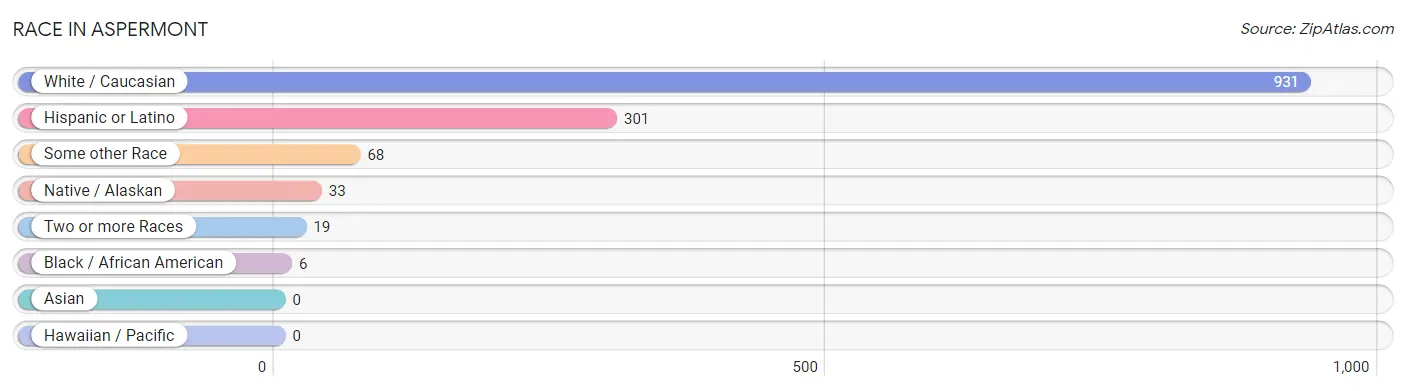
| Race | # Population | % Population |
| Asian | 0 | 0.0% |
| Black / African American | 6 | 0.6% |
| Hawaiian / Pacific | 0 | 0.0% |
| Hispanic or Latino | 301 | 28.5% |
| Native / Alaskan | 33 | 3.1% |
| White / Caucasian | 931 | 88.1% |
| Two or more Races | 19 | 1.8% |
| Some other Race | 68 | 6.4% |
| Total | 1,057 | 100.0% |
Ancestry in Aspermont
The most populous ancestries reported in Aspermont are Mexican (301 | 28.5%), Irish (122 | 11.5%), French (67 | 6.3%), English (64 | 6.0%), and American (56 | 5.3%), together accounting for 57.7% of all Aspermont residents.
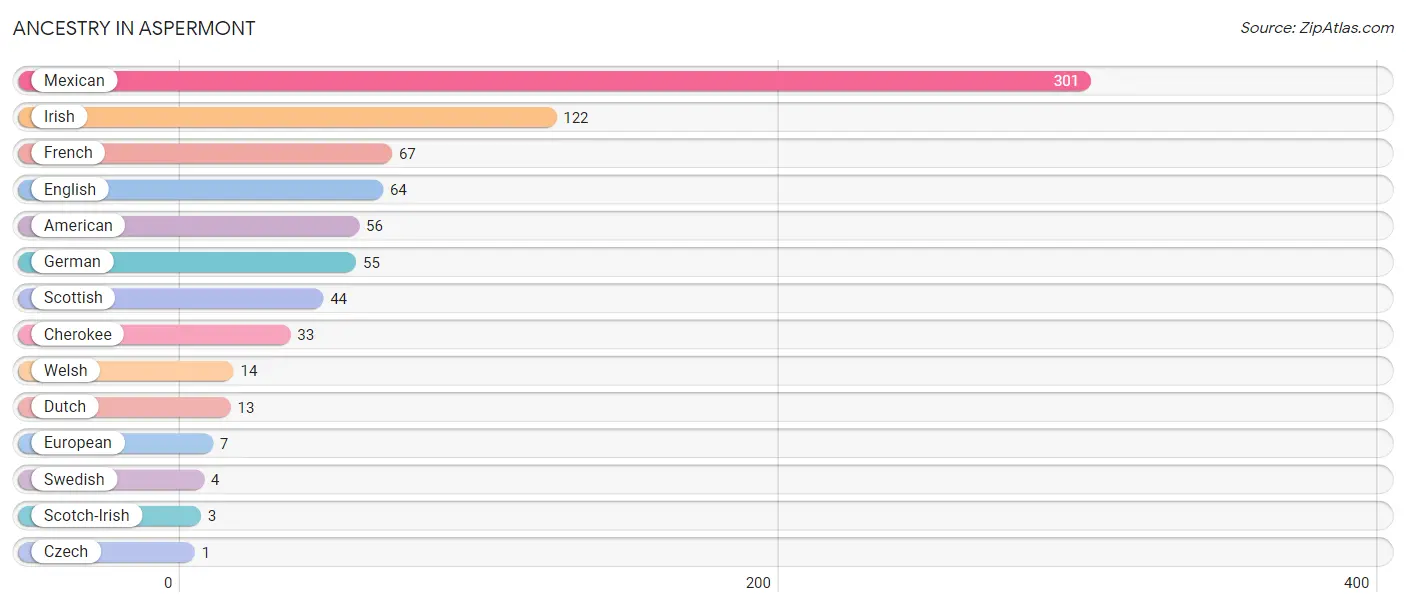
| Ancestry | # Population | % Population |
| American | 56 | 5.3% |
| Cherokee | 33 | 3.1% |
| Czech | 1 | 0.1% |
| Dutch | 13 | 1.2% |
| English | 64 | 6.0% |
| European | 7 | 0.7% |
| French | 67 | 6.3% |
| German | 55 | 5.2% |
| Irish | 122 | 11.5% |
| Mexican | 301 | 28.5% |
| Scotch-Irish | 3 | 0.3% |
| Scottish | 44 | 4.2% |
| Swedish | 4 | 0.4% |
| Welsh | 14 | 1.3% | View All 14 Rows |
Immigrants in Aspermont
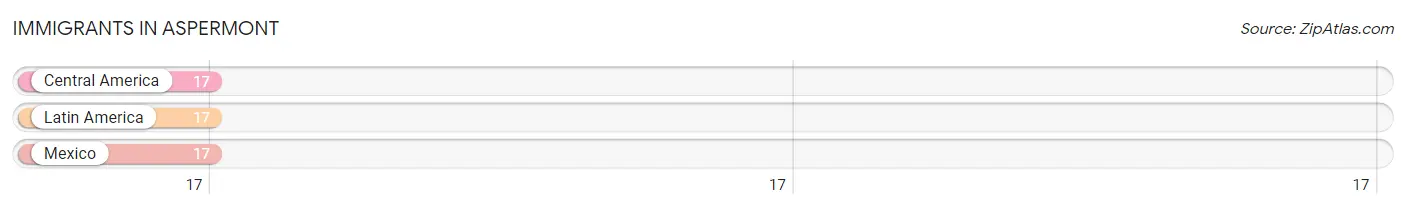
The most numerous immigrant groups reported in Aspermont came from Central America (17 | 1.6%), Latin America (17 | 1.6%), and Mexico (17 | 1.6%), together accounting for 4.8% of all Aspermont residents.
| Immigration Origin | # Population | % Population |
| Central America | 17 | 1.6% |
| Latin America | 17 | 1.6% |
| Mexico | 17 | 1.6% | View All 3 Rows |
Sex and Age in Aspermont
Sex and Age in Aspermont
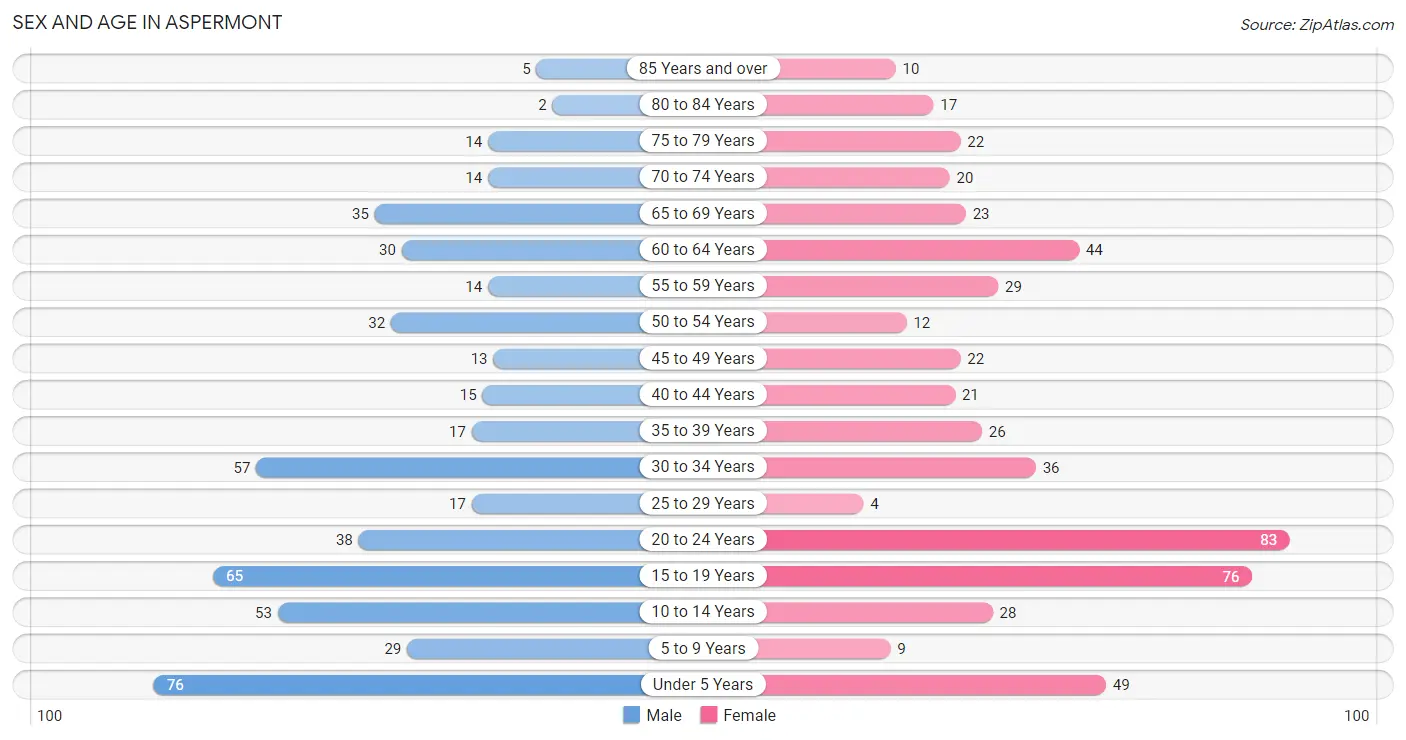
The most populous age groups in Aspermont are Under 5 Years (76 | 14.4%) for men and 20 to 24 Years (83 | 15.6%) for women.
| Age Bracket | Male | Female |
| Under 5 Years | 76 (14.4%) | 49 (9.2%) |
| 5 to 9 Years | 29 (5.5%) | 9 (1.7%) |
| 10 to 14 Years | 53 (10.1%) | 28 (5.3%) |
| 15 to 19 Years | 65 (12.4%) | 76 (14.3%) |
| 20 to 24 Years | 38 (7.2%) | 83 (15.6%) |
| 25 to 29 Years | 17 (3.2%) | 4 (0.7%) |
| 30 to 34 Years | 57 (10.8%) | 36 (6.8%) |
| 35 to 39 Years | 17 (3.2%) | 26 (4.9%) |
| 40 to 44 Years | 15 (2.9%) | 21 (4.0%) |
| 45 to 49 Years | 13 (2.5%) | 22 (4.1%) |
| 50 to 54 Years | 32 (6.1%) | 12 (2.3%) |
| 55 to 59 Years | 14 (2.7%) | 29 (5.5%) |
| 60 to 64 Years | 30 (5.7%) | 44 (8.3%) |
| 65 to 69 Years | 35 (6.7%) | 23 (4.3%) |
| 70 to 74 Years | 14 (2.7%) | 20 (3.8%) |
| 75 to 79 Years | 14 (2.7%) | 22 (4.1%) |
| 80 to 84 Years | 2 (0.4%) | 17 (3.2%) |
| 85 Years and over | 5 (0.9%) | 10 (1.9%) |
| Total | 526 (100.0%) | 531 (100.0%) |
Families and Households in Aspermont
Median Family Size in Aspermont
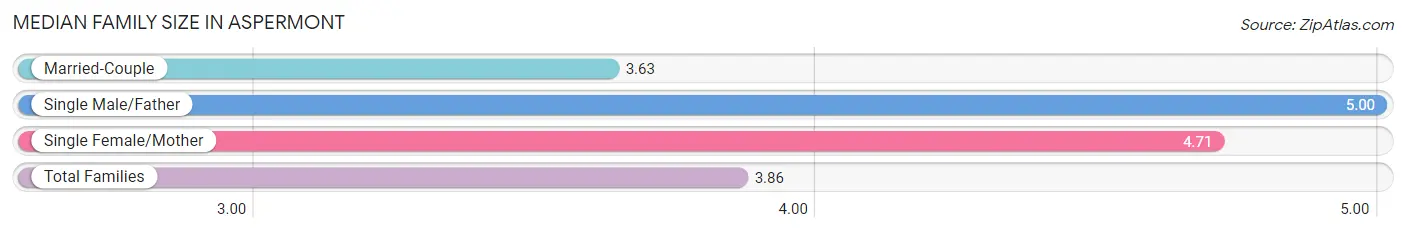
The median family size in Aspermont is 3.86 persons per family, with single male/father families (1 | 0.4%) accounting for the largest median family size of 5 persons per family. On the other hand, married-couple families (186 | 79.1%) represent the smallest median family size with 3.63 persons per family.
| Family Type | # Families | Family Size |
| Married-Couple | 186 (79.1%) | 3.63 |
| Single Male/Father | 1 (0.4%) | 5.00 |
| Single Female/Mother | 48 (20.4%) | 4.71 |
| Total Families | 235 (100.0%) | 3.86 |
Median Household Size in Aspermont
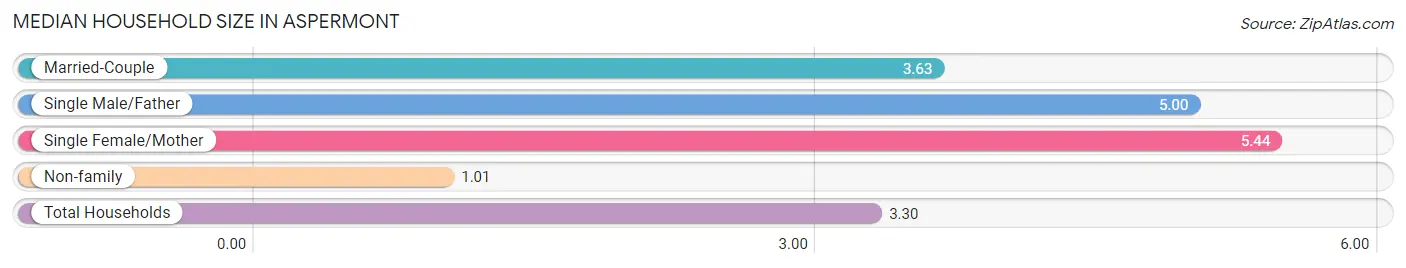
The median household size in Aspermont is 3.30 persons per household, with single female/mother households (48 | 15.6%) accounting for the largest median household size of 5.44 persons per household. non-family households (73 | 23.7%) represent the smallest median household size with 1.01 persons per household.
| Household Type | # Households | Household Size |
| Married-Couple | 186 (60.4%) | 3.63 |
| Single Male/Father | 1 (0.3%) | 5.00 |
| Single Female/Mother | 48 (15.6%) | 5.44 |
| Non-family | 73 (23.7%) | 1.01 |
| Total Households | 308 (100.0%) | 3.30 |
Household Size by Marriage Status in Aspermont
Out of a total of 308 households in Aspermont, 235 (76.3%) are family households, while 73 (23.7%) are nonfamily households. The most numerous type of family households are 4-person households, comprising 78, and the most common type of nonfamily households are 1-person households, comprising 72.
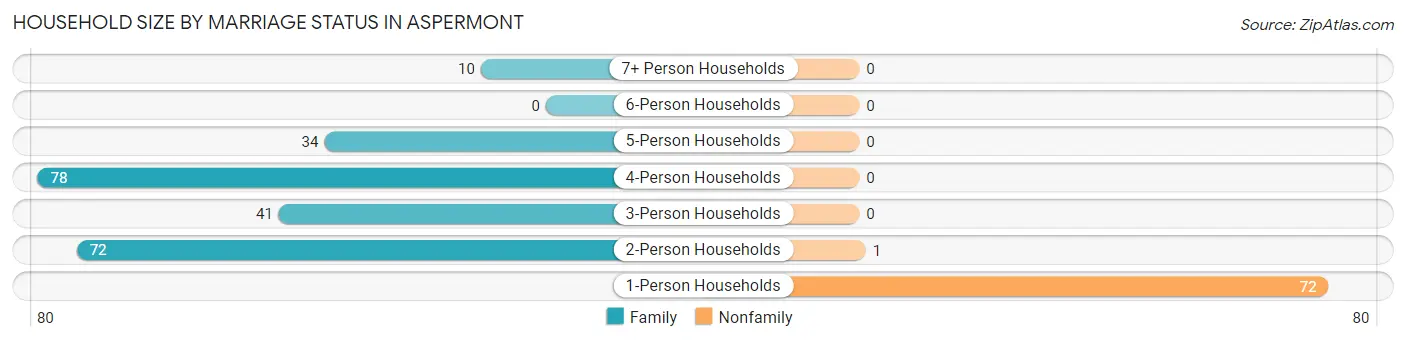
| Household Size | Family Households | Nonfamily Households |
| 1-Person Households | - | 72 (23.4%) |
| 2-Person Households | 72 (23.4%) | 1 (0.3%) |
| 3-Person Households | 41 (13.3%) | 0 (0.0%) |
| 4-Person Households | 78 (25.3%) | 0 (0.0%) |
| 5-Person Households | 34 (11.0%) | 0 (0.0%) |
| 6-Person Households | 0 (0.0%) | 0 (0.0%) |
| 7+ Person Households | 10 (3.3%) | 0 (0.0%) |
| Total | 235 (76.3%) | 73 (23.7%) |
Female Fertility in Aspermont
Fertility by Age in Aspermont
Average fertility rate in Aspermont is 41.0 births per 1,000 women. Women in the age bracket of 15 to 19 years have the highest fertility rate with 145.0 births per 1,000 women. Women in the age bracket of 15 to 19 years acount for 100.0% of all women with births.
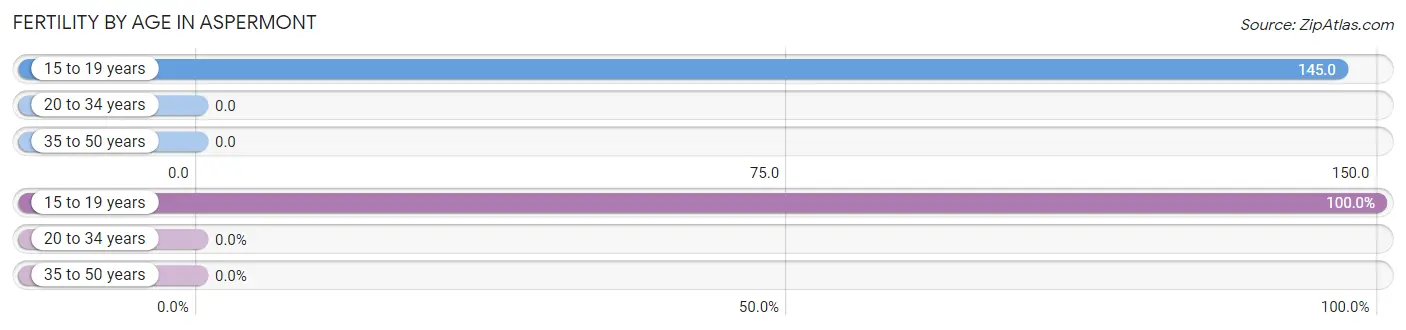
| Age Bracket | Women with Births | Births / 1,000 Women |
| 15 to 19 years | 11 (100.0%) | 145.0 |
| 20 to 34 years | 0 (0.0%) | 0.0 |
| 35 to 50 years | 0 (0.0%) | 0.0 |
| Total | 11 (100.0%) | 41.0 |
Fertility by Age by Marriage Status in Aspermont
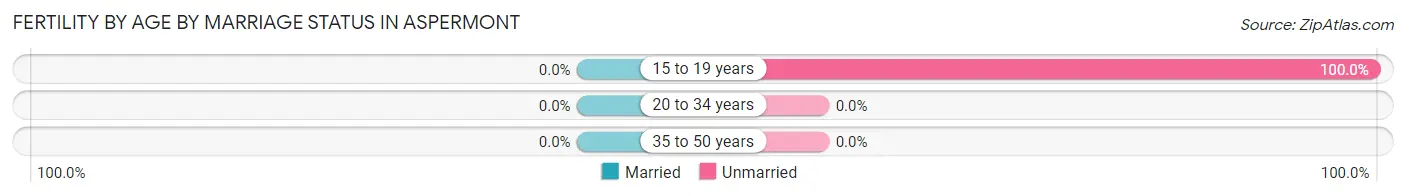
| Age Bracket | Married | Unmarried |
| 15 to 19 years | 0 (0.0%) | 11 (100.0%) |
| 20 to 34 years | 0 (0.0%) | 0 (0.0%) |
| 35 to 50 years | 0 (0.0%) | 0 (0.0%) |
| Total | 0 (0.0%) | 11 (100.0%) |
Fertility by Education in Aspermont
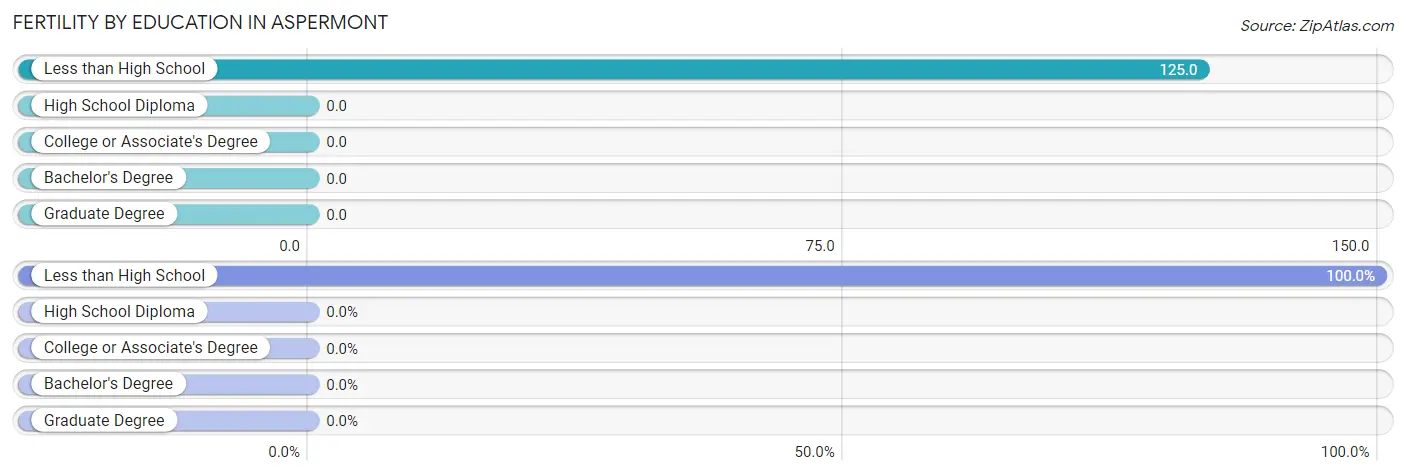
| Educational Attainment | Women with Births | Births / 1,000 Women |
| Less than High School | 11 (100.0%) | 125.0 |
| High School Diploma | 0 (0.0%) | 0.0 |
| College or Associate's Degree | 0 (0.0%) | 0.0 |
| Bachelor's Degree | 0 (0.0%) | 0.0 |
| Graduate Degree | 0 (0.0%) | 0.0 |
| Total | 11 (100.0%) | 41.0 |
Fertility by Education by Marriage Status in Aspermont
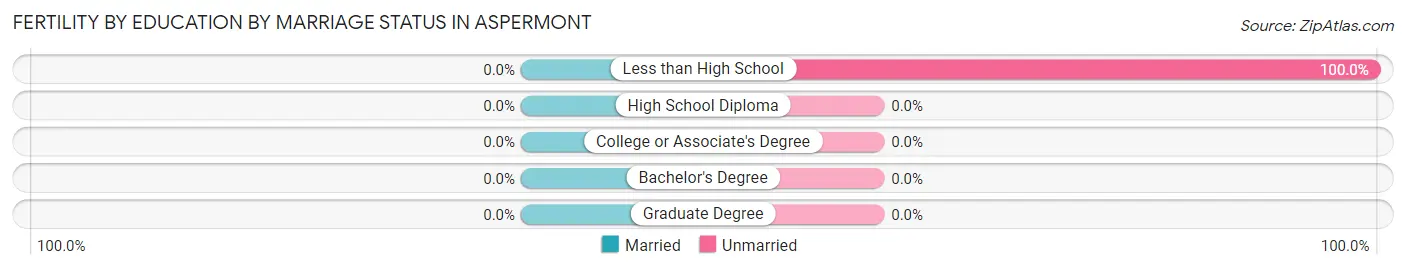
| Educational Attainment | Married | Unmarried |
| Less than High School | 0 (0.0%) | 11 (100.0%) |
| High School Diploma | 0 (0.0%) | 0 (0.0%) |
| College or Associate's Degree | 0 (0.0%) | 0 (0.0%) |
| Bachelor's Degree | 0 (0.0%) | 0 (0.0%) |
| Graduate Degree | 0 (0.0%) | 0 (0.0%) |
| Total | 0 (0.0%) | 11 (100.0%) |
Employment Characteristics in Aspermont
Employment by Class of Employer in Aspermont
Among the 521 employed individuals in Aspermont, private company employees (371 | 71.2%), not-for-profit organizations (65 | 12.5%), and self-employed (incorporated) (45 | 8.6%) make up the most common classes of employment.
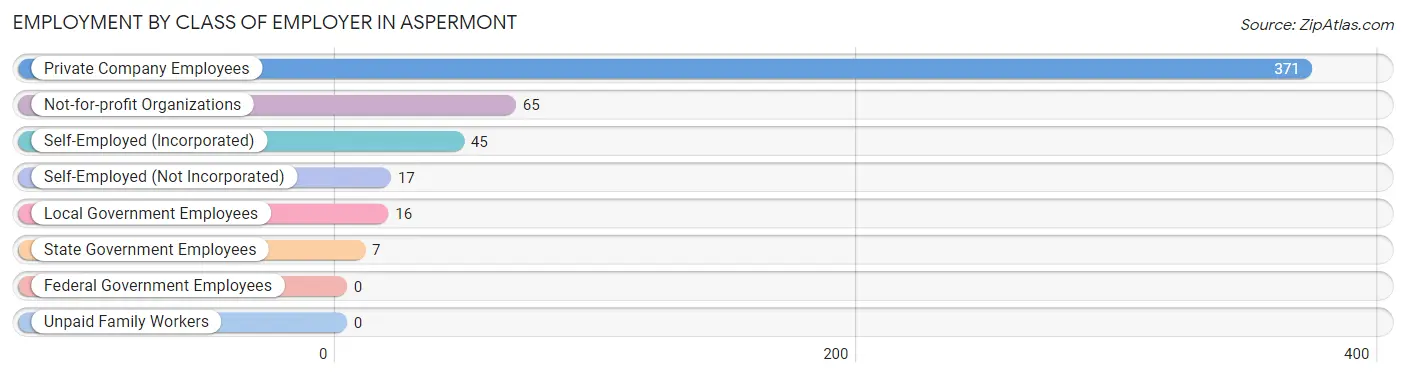
| Employer Class | # Employees | % Employees |
| Private Company Employees | 371 | 71.2% |
| Self-Employed (Incorporated) | 45 | 8.6% |
| Self-Employed (Not Incorporated) | 17 | 3.3% |
| Not-for-profit Organizations | 65 | 12.5% |
| Local Government Employees | 16 | 3.1% |
| State Government Employees | 7 | 1.3% |
| Federal Government Employees | 0 | 0.0% |
| Unpaid Family Workers | 0 | 0.0% |
| Total | 521 | 100.0% |
Employment Status by Age in Aspermont
According to the labor force statistics for Aspermont, out of the total population over 16 years of age (778), 68.5% or 533 individuals are in the labor force, with 2.3% or 12 of them unemployed. The age group with the highest labor force participation rate is 45 to 54 years, with 89.9% or 71 individuals in the labor force. Within the labor force, the 45 to 54 years age range has the highest percentage of unemployed individuals, with 15.5% or 11 of them being unemployed.
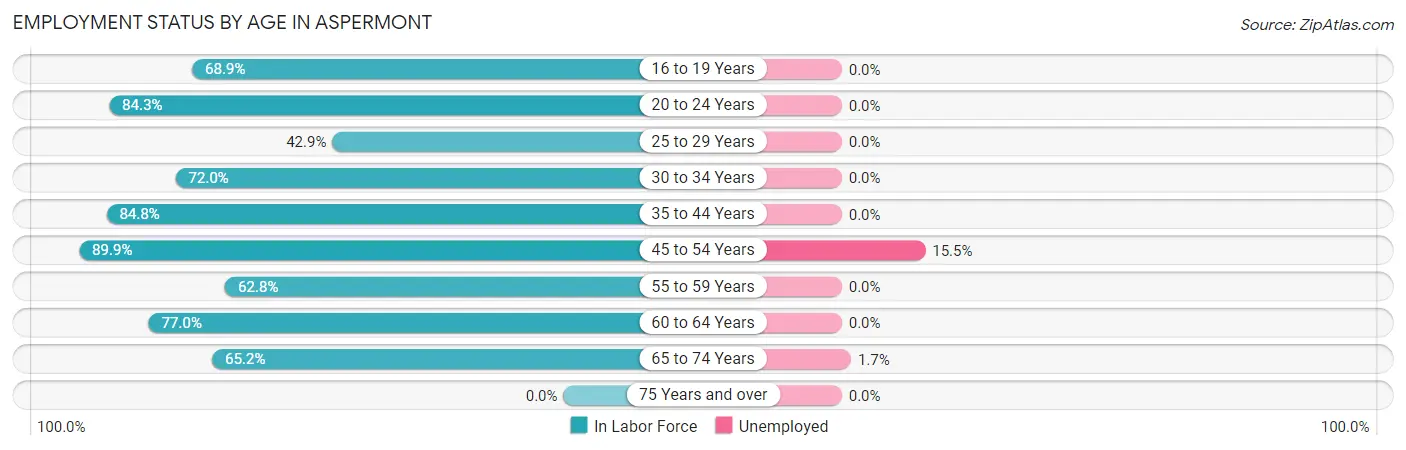
| Age Bracket | In Labor Force | Unemployed |
| 16 to 19 Years | 73 (68.9%) | 0 (0.0%) |
| 20 to 24 Years | 102 (84.3%) | 0 (0.0%) |
| 25 to 29 Years | 9 (42.9%) | 0 (0.0%) |
| 30 to 34 Years | 67 (72.0%) | 0 (0.0%) |
| 35 to 44 Years | 67 (84.8%) | 0 (0.0%) |
| 45 to 54 Years | 71 (89.9%) | 11 (15.5%) |
| 55 to 59 Years | 27 (62.8%) | 0 (0.0%) |
| 60 to 64 Years | 57 (77.0%) | 0 (0.0%) |
| 65 to 74 Years | 60 (65.2%) | 1 (1.7%) |
| 75 Years and over | 0 (0.0%) | 0 (0.0%) |
| Total | 533 (68.5%) | 12 (2.3%) |
Employment Status by Educational Attainment in Aspermont
According to labor force statistics for Aspermont, 76.6% of individuals (298) out of the total population between 25 and 64 years of age (389) are in the labor force, with 3.7% or 11 of them being unemployed. The group with the highest labor force participation rate are those with the educational attainment of bachelor's degree or higher, with 100.0% or 45 individuals in the labor force. Within the labor force, individuals with college / associate degree education have the highest percentage of unemployment, with 23.9% or 11 of them being unemployed.
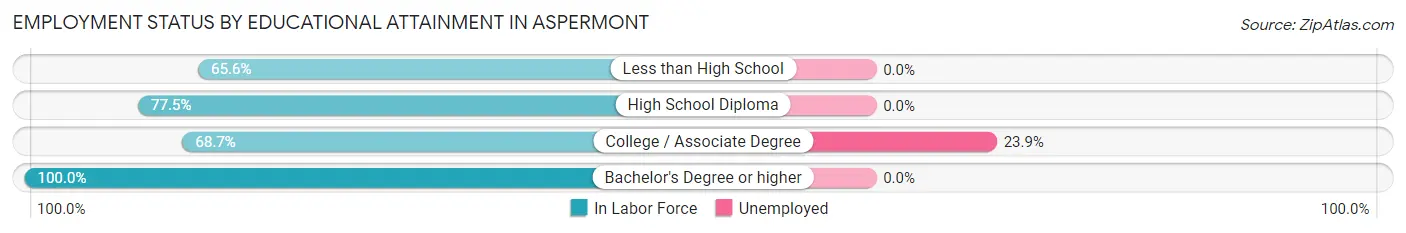
| Educational Attainment | In Labor Force | Unemployed |
| Less than High School | 42 (65.6%) | 0 (0.0%) |
| High School Diploma | 165 (77.5%) | 0 (0.0%) |
| College / Associate Degree | 46 (68.7%) | 16 (23.9%) |
| Bachelor's Degree or higher | 45 (100.0%) | 0 (0.0%) |
| Total | 298 (76.6%) | 14 (3.7%) |
Employment Occupations by Sex in Aspermont
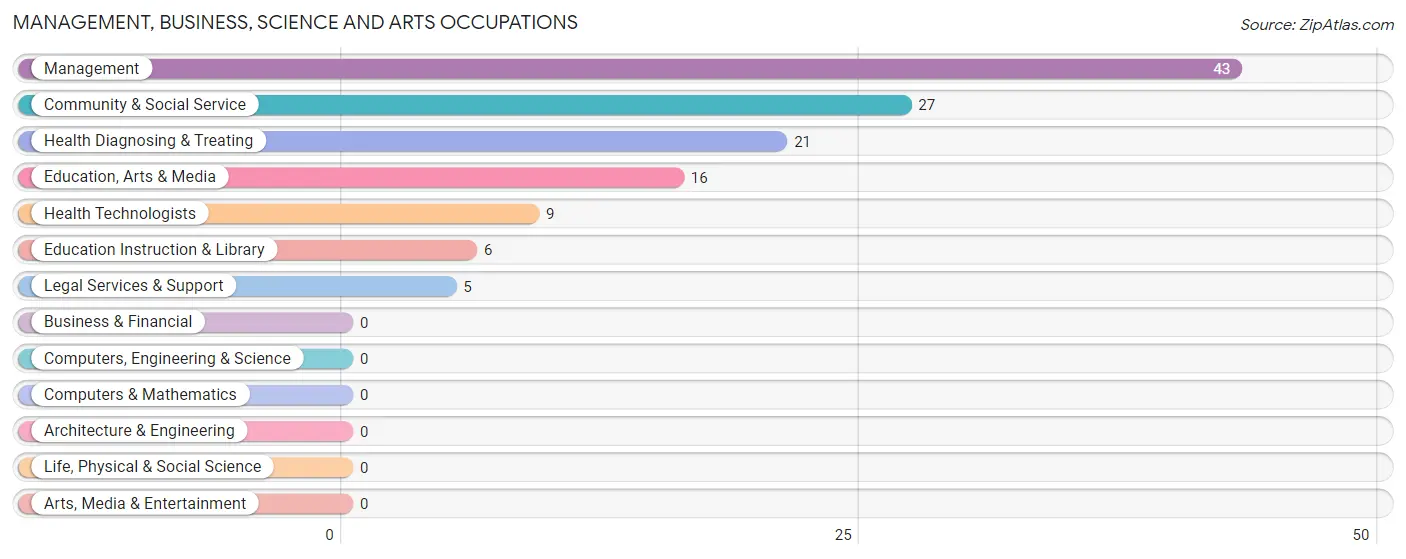
Management, Business, Science and Arts Occupations
The most common Management, Business, Science and Arts occupations in Aspermont are Management (43 | 8.3%), Community & Social Service (27 | 5.2%), Health Diagnosing & Treating (21 | 4.0%), Education, Arts & Media (16 | 3.1%), and Health Technologists (9 | 1.7%).
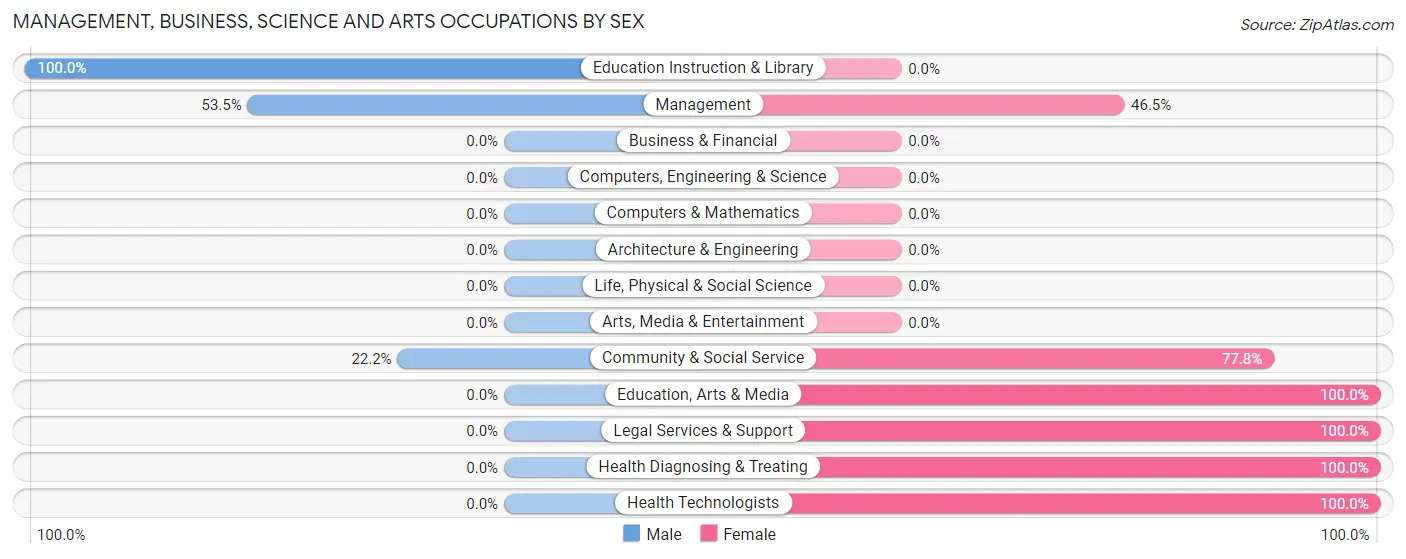
Management, Business, Science and Arts Occupations by Sex
Within the Management, Business, Science and Arts occupations in Aspermont, the most male-oriented occupations are Education Instruction & Library (100.0%), Management (53.5%), and Community & Social Service (22.2%), while the most female-oriented occupations are Education, Arts & Media (100.0%), Legal Services & Support (100.0%), and Health Diagnosing & Treating (100.0%).
| Occupation | Male | Female |
| Management | 23 (53.5%) | 20 (46.5%) |
| Business & Financial | 0 (0.0%) | 0 (0.0%) |
| Computers, Engineering & Science | 0 (0.0%) | 0 (0.0%) |
| Computers & Mathematics | 0 (0.0%) | 0 (0.0%) |
| Architecture & Engineering | 0 (0.0%) | 0 (0.0%) |
| Life, Physical & Social Science | 0 (0.0%) | 0 (0.0%) |
| Community & Social Service | 6 (22.2%) | 21 (77.8%) |
| Education, Arts & Media | 0 (0.0%) | 16 (100.0%) |
| Legal Services & Support | 0 (0.0%) | 5 (100.0%) |
| Education Instruction & Library | 6 (100.0%) | 0 (0.0%) |
| Arts, Media & Entertainment | 0 (0.0%) | 0 (0.0%) |
| Health Diagnosing & Treating | 0 (0.0%) | 21 (100.0%) |
| Health Technologists | 0 (0.0%) | 9 (100.0%) |
| Total (Category) | 29 (31.9%) | 62 (68.1%) |
| Total (Overall) | 283 (54.3%) | 238 (45.7%) |
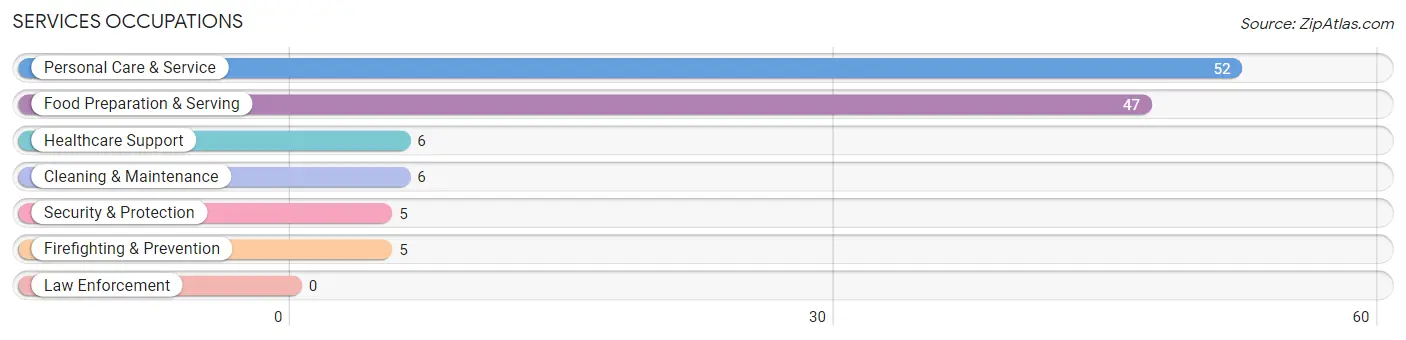
Services Occupations
The most common Services occupations in Aspermont are Personal Care & Service (52 | 10.0%), Food Preparation & Serving (47 | 9.0%), Healthcare Support (6 | 1.1%), Cleaning & Maintenance (6 | 1.1%), and Security & Protection (5 | 1.0%).
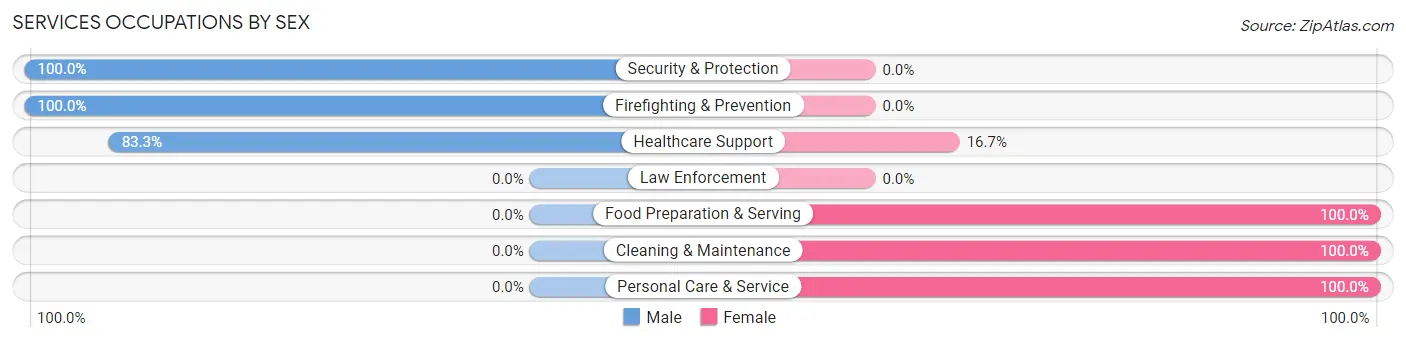
Services Occupations by Sex
Within the Services occupations in Aspermont, the most male-oriented occupations are Security & Protection (100.0%), Firefighting & Prevention (100.0%), and Healthcare Support (83.3%), while the most female-oriented occupations are Food Preparation & Serving (100.0%), Cleaning & Maintenance (100.0%), and Personal Care & Service (100.0%).
| Occupation | Male | Female |
| Healthcare Support | 5 (83.3%) | 1 (16.7%) |
| Security & Protection | 5 (100.0%) | 0 (0.0%) |
| Firefighting & Prevention | 5 (100.0%) | 0 (0.0%) |
| Law Enforcement | 0 (0.0%) | 0 (0.0%) |
| Food Preparation & Serving | 0 (0.0%) | 47 (100.0%) |
| Cleaning & Maintenance | 0 (0.0%) | 6 (100.0%) |
| Personal Care & Service | 0 (0.0%) | 52 (100.0%) |
| Total (Category) | 10 (8.6%) | 106 (91.4%) |
| Total (Overall) | 283 (54.3%) | 238 (45.7%) |
Sales and Office Occupations
The most common Sales and Office occupations in Aspermont are Sales & Related (80 | 15.4%), and Office & Administration (32 | 6.1%).
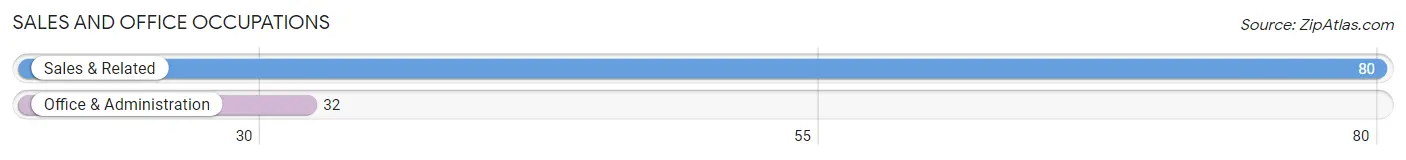
Sales and Office Occupations by Sex

| Occupation | Male | Female |
| Sales & Related | 72 (90.0%) | 8 (10.0%) |
| Office & Administration | 0 (0.0%) | 32 (100.0%) |
| Total (Category) | 72 (64.3%) | 40 (35.7%) |
| Total (Overall) | 283 (54.3%) | 238 (45.7%) |
Natural Resources, Construction and Maintenance Occupations
The most common Natural Resources, Construction and Maintenance occupations in Aspermont are Construction & Extraction (33 | 6.3%), Installation, Maintenance & Repair (25 | 4.8%), and Farming, Fishing & Forestry (6 | 1.1%).
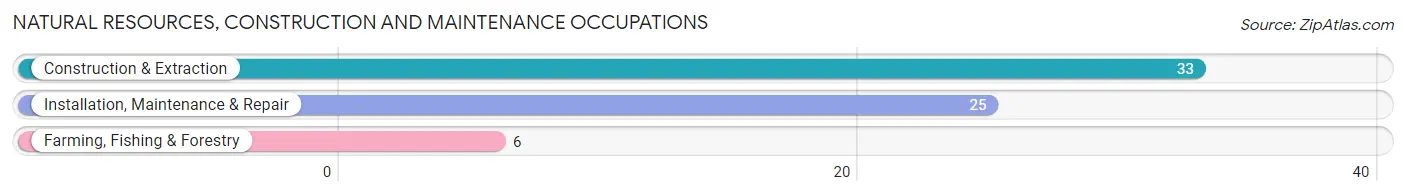
Natural Resources, Construction and Maintenance Occupations by Sex
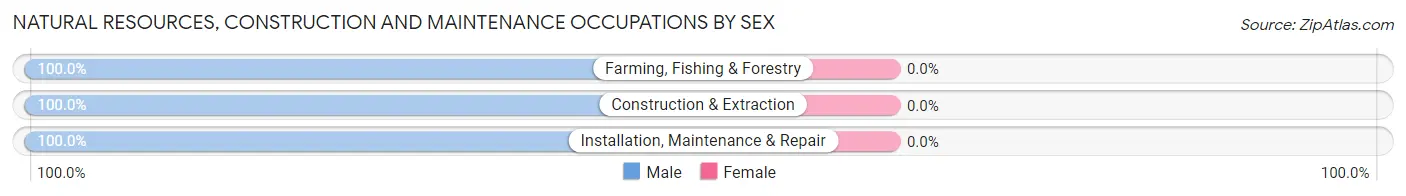
| Occupation | Male | Female |
| Farming, Fishing & Forestry | 6 (100.0%) | 0 (0.0%) |
| Construction & Extraction | 33 (100.0%) | 0 (0.0%) |
| Installation, Maintenance & Repair | 25 (100.0%) | 0 (0.0%) |
| Total (Category) | 64 (100.0%) | 0 (0.0%) |
| Total (Overall) | 283 (54.3%) | 238 (45.7%) |
Production, Transportation and Moving Occupations
The most common Production, Transportation and Moving occupations in Aspermont are Material Moving (59 | 11.3%), Transportation (43 | 8.3%), and Production (36 | 6.9%).
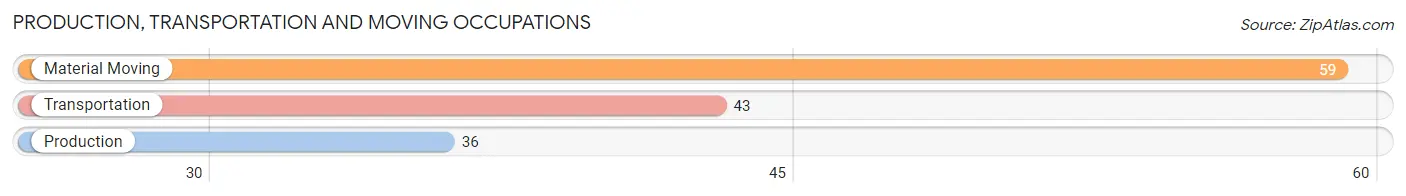
Production, Transportation and Moving Occupations by Sex
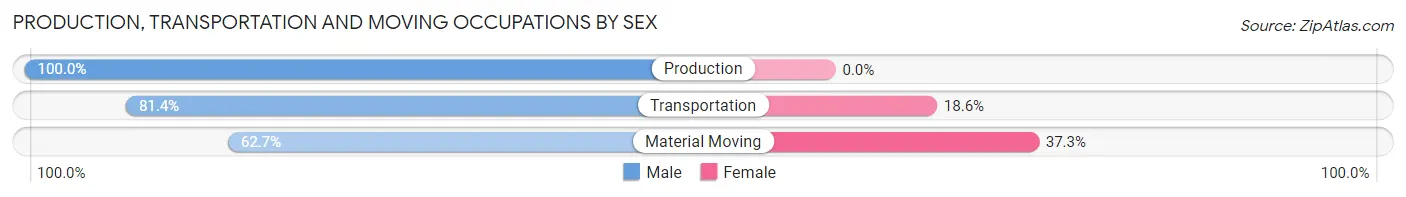
| Occupation | Male | Female |
| Production | 36 (100.0%) | 0 (0.0%) |
| Transportation | 35 (81.4%) | 8 (18.6%) |
| Material Moving | 37 (62.7%) | 22 (37.3%) |
| Total (Category) | 108 (78.3%) | 30 (21.7%) |
| Total (Overall) | 283 (54.3%) | 238 (45.7%) |
Employment Industries by Sex in Aspermont
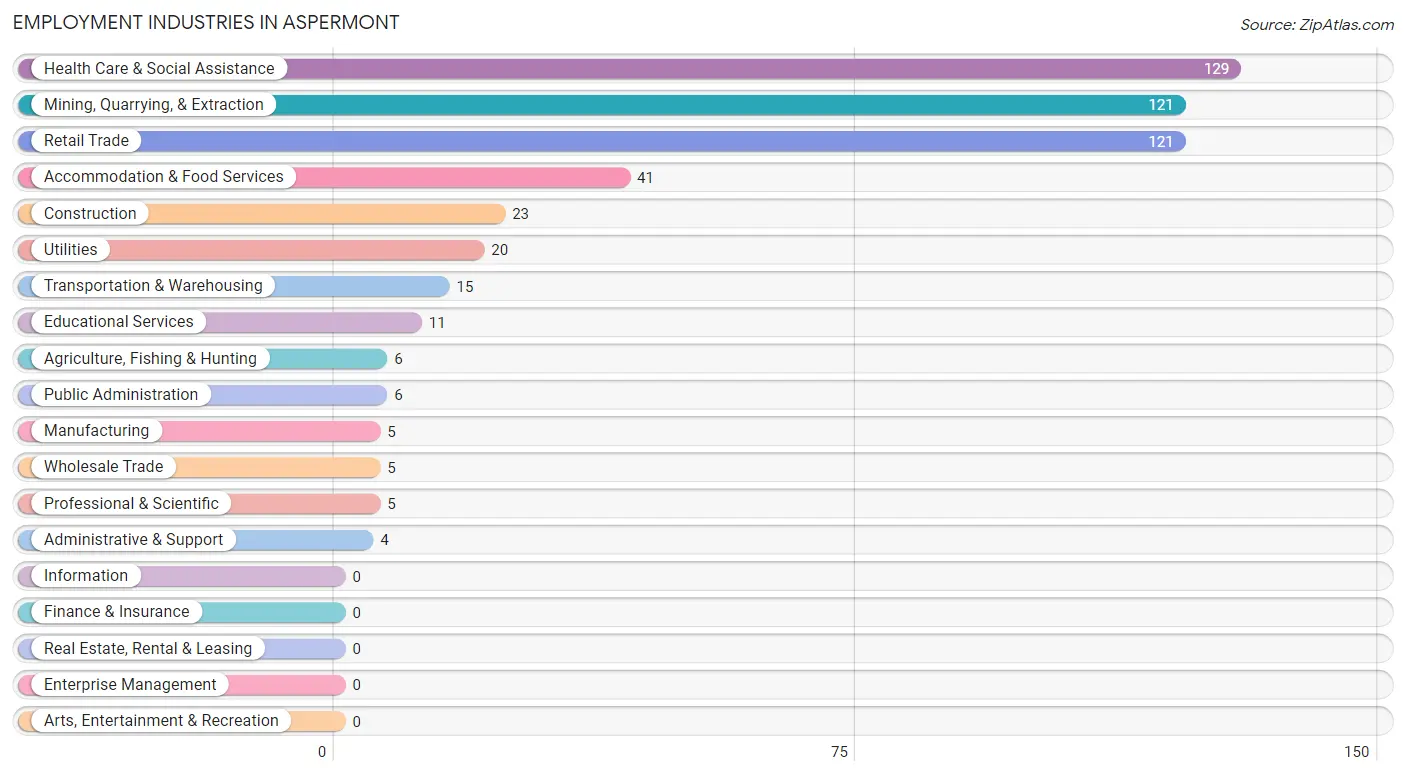
Employment Industries in Aspermont
The major employment industries in Aspermont include Health Care & Social Assistance (129 | 24.8%), Mining, Quarrying, & Extraction (121 | 23.2%), Retail Trade (121 | 23.2%), Accommodation & Food Services (41 | 7.9%), and Construction (23 | 4.4%).
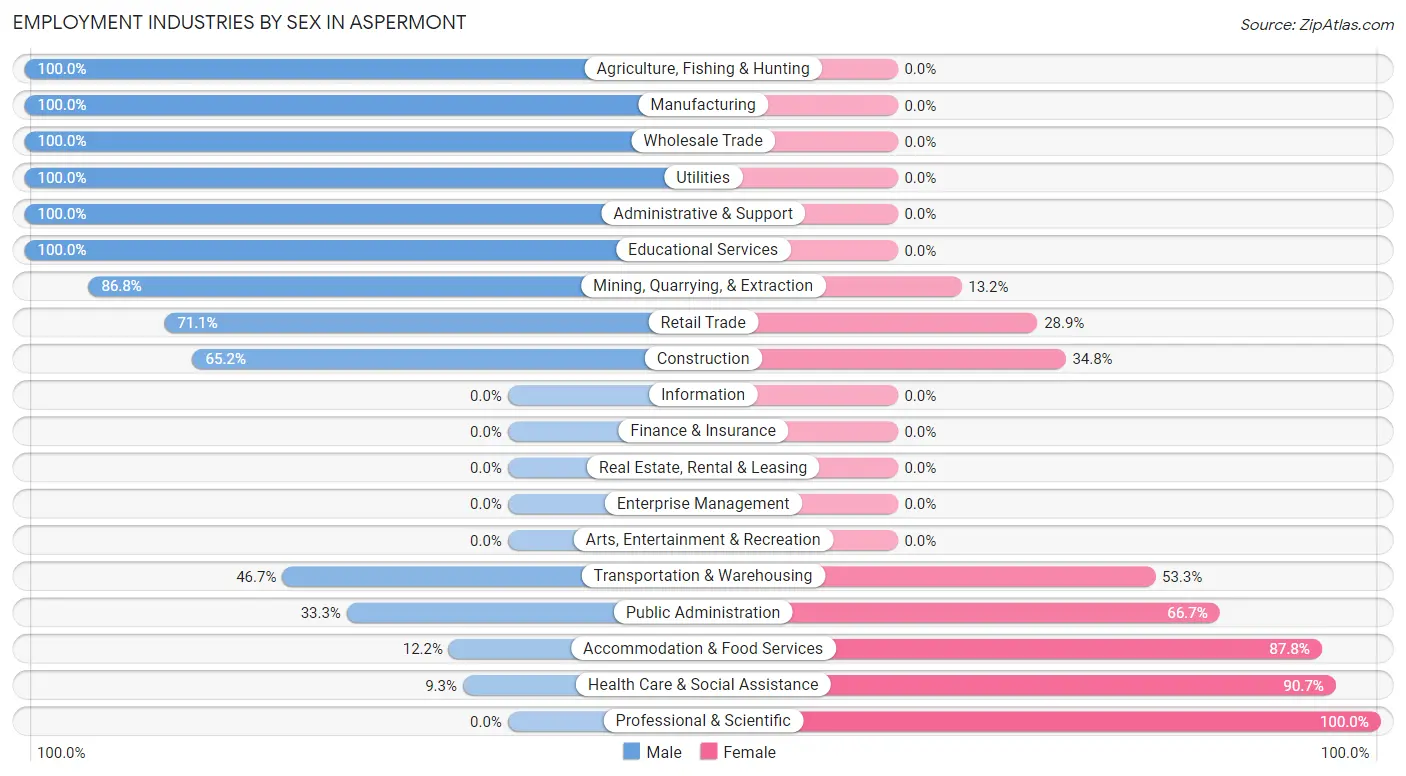
Employment Industries by Sex in Aspermont
The Aspermont industries that see more men than women are Agriculture, Fishing & Hunting (100.0%), Manufacturing (100.0%), and Wholesale Trade (100.0%), whereas the industries that tend to have a higher number of women are Professional & Scientific (100.0%), Health Care & Social Assistance (90.7%), and Accommodation & Food Services (87.8%).
| Industry | Male | Female |
| Agriculture, Fishing & Hunting | 6 (100.0%) | 0 (0.0%) |
| Mining, Quarrying, & Extraction | 105 (86.8%) | 16 (13.2%) |
| Construction | 15 (65.2%) | 8 (34.8%) |
| Manufacturing | 5 (100.0%) | 0 (0.0%) |
| Wholesale Trade | 5 (100.0%) | 0 (0.0%) |
| Retail Trade | 86 (71.1%) | 35 (28.9%) |
| Transportation & Warehousing | 7 (46.7%) | 8 (53.3%) |
| Utilities | 20 (100.0%) | 0 (0.0%) |
| Information | 0 (0.0%) | 0 (0.0%) |
| Finance & Insurance | 0 (0.0%) | 0 (0.0%) |
| Real Estate, Rental & Leasing | 0 (0.0%) | 0 (0.0%) |
| Professional & Scientific | 0 (0.0%) | 5 (100.0%) |
| Enterprise Management | 0 (0.0%) | 0 (0.0%) |
| Administrative & Support | 4 (100.0%) | 0 (0.0%) |
| Educational Services | 11 (100.0%) | 0 (0.0%) |
| Health Care & Social Assistance | 12 (9.3%) | 117 (90.7%) |
| Arts, Entertainment & Recreation | 0 (0.0%) | 0 (0.0%) |
| Accommodation & Food Services | 5 (12.2%) | 36 (87.8%) |
| Public Administration | 2 (33.3%) | 4 (66.7%) |
| Total | 283 (54.3%) | 238 (45.7%) |
Education in Aspermont
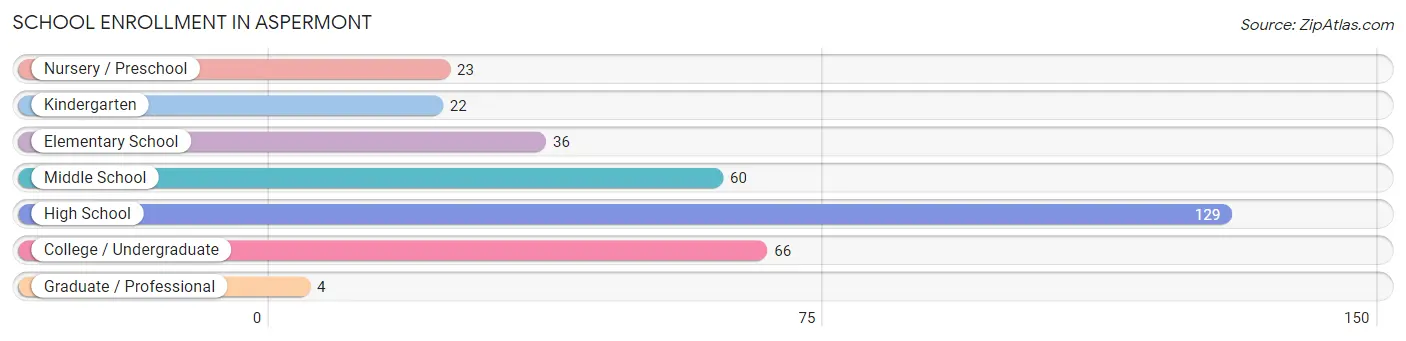
School Enrollment in Aspermont
The most common levels of schooling among the 340 students in Aspermont are high school (129 | 37.9%), college / undergraduate (66 | 19.4%), and middle school (60 | 17.6%).
| School Level | # Students | % Students |
| Nursery / Preschool | 23 | 6.8% |
| Kindergarten | 22 | 6.5% |
| Elementary School | 36 | 10.6% |
| Middle School | 60 | 17.6% |
| High School | 129 | 37.9% |
| College / Undergraduate | 66 | 19.4% |
| Graduate / Professional | 4 | 1.2% |
| Total | 340 | 100.0% |
School Enrollment by Age by Funding Source in Aspermont
Out of a total of 340 students who are enrolled in schools in Aspermont, 12 (3.5%) attend a private institution, while the remaining 328 (96.5%) are enrolled in public schools. The age group of 35 years and over has the highest likelihood of being enrolled in private schools, with 12 (75.0% in the age bracket) enrolled. Conversely, the age group of 3 to 4 year olds has the lowest likelihood of being enrolled in a private school, with 23 (100.0% in the age bracket) attending a public institution.
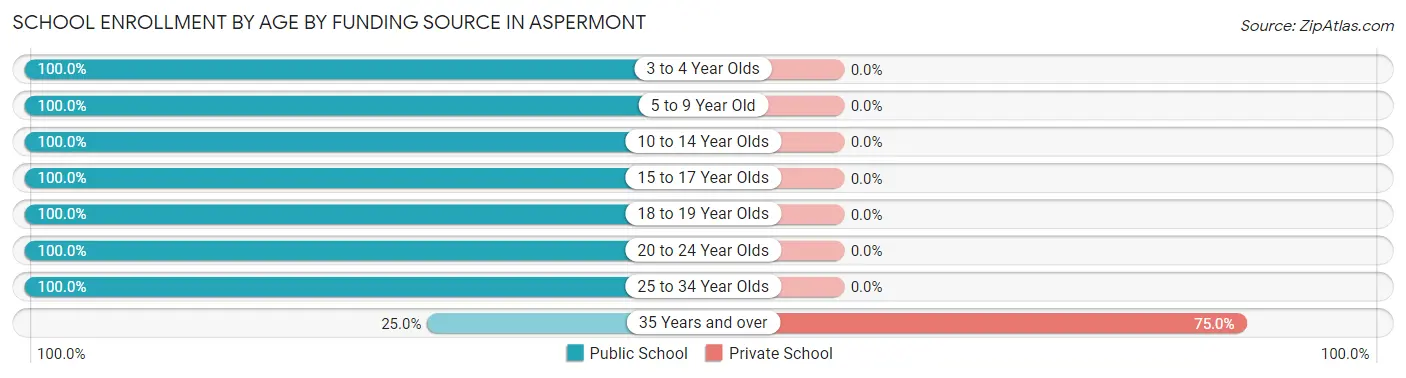
| Age Bracket | Public School | Private School |
| 3 to 4 Year Olds | 23 (100.0%) | 0 (0.0%) |
| 5 to 9 Year Old | 38 (100.0%) | 0 (0.0%) |
| 10 to 14 Year Olds | 81 (100.0%) | 0 (0.0%) |
| 15 to 17 Year Olds | 90 (100.0%) | 0 (0.0%) |
| 18 to 19 Year Olds | 38 (100.0%) | 0 (0.0%) |
| 20 to 24 Year Olds | 39 (100.0%) | 0 (0.0%) |
| 25 to 34 Year Olds | 15 (100.0%) | 0 (0.0%) |
| 35 Years and over | 4 (25.0%) | 12 (75.0%) |
| Total | 328 (96.5%) | 12 (3.5%) |
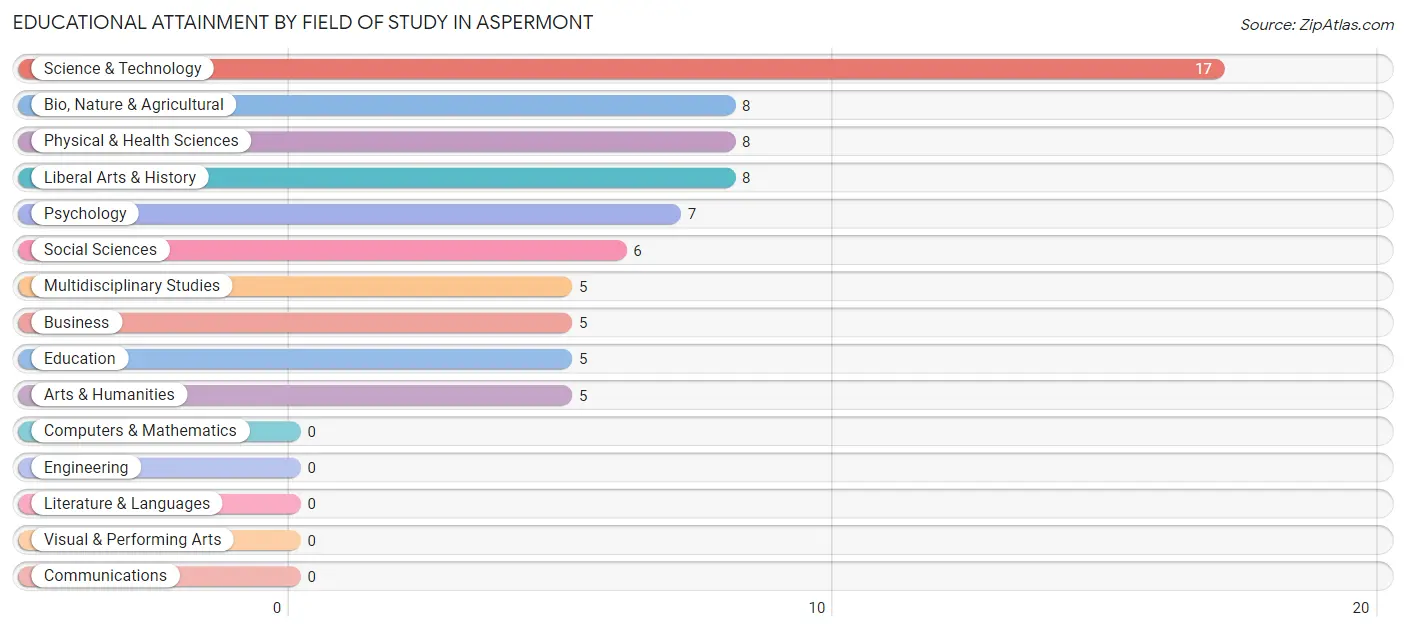
Educational Attainment by Field of Study in Aspermont
Science & technology (17 | 23.0%), bio, nature & agricultural (8 | 10.8%), physical & health sciences (8 | 10.8%), liberal arts & history (8 | 10.8%), and psychology (7 | 9.5%) are the most common fields of study among 74 individuals in Aspermont who have obtained a bachelor's degree or higher.
| Field of Study | # Graduates | % Graduates |
| Computers & Mathematics | 0 | 0.0% |
| Bio, Nature & Agricultural | 8 | 10.8% |
| Physical & Health Sciences | 8 | 10.8% |
| Psychology | 7 | 9.5% |
| Social Sciences | 6 | 8.1% |
| Engineering | 0 | 0.0% |
| Multidisciplinary Studies | 5 | 6.8% |
| Science & Technology | 17 | 23.0% |
| Business | 5 | 6.8% |
| Education | 5 | 6.8% |
| Literature & Languages | 0 | 0.0% |
| Liberal Arts & History | 8 | 10.8% |
| Visual & Performing Arts | 0 | 0.0% |
| Communications | 0 | 0.0% |
| Arts & Humanities | 5 | 6.8% |
| Total | 74 | 100.0% |
Transportation & Commute in Aspermont
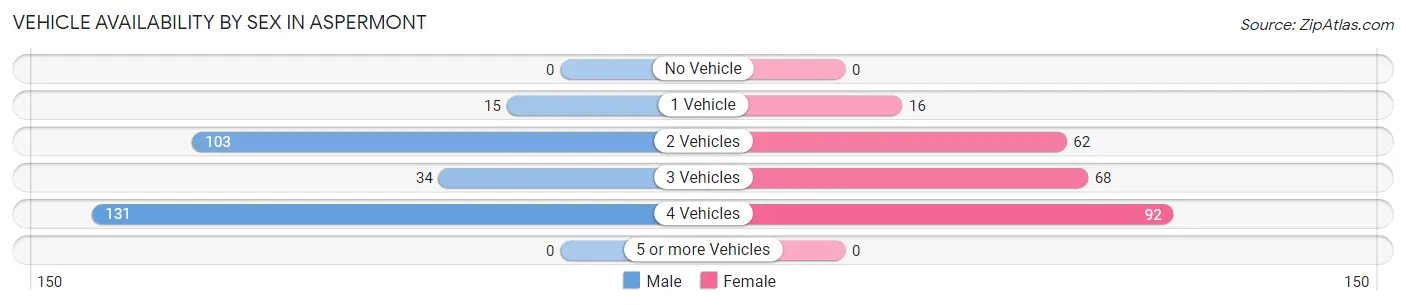
Vehicle Availability by Sex in Aspermont
The most prevalent vehicle ownership categories in Aspermont are males with 4 vehicles (131, accounting for 46.3%) and females with 4 vehicles (92, making up 55.0%).
| Vehicles Available | Male | Female |
| No Vehicle | 0 (0.0%) | 0 (0.0%) |
| 1 Vehicle | 15 (5.3%) | 16 (6.7%) |
| 2 Vehicles | 103 (36.4%) | 62 (26.1%) |
| 3 Vehicles | 34 (12.0%) | 68 (28.6%) |
| 4 Vehicles | 131 (46.3%) | 92 (38.7%) |
| 5 or more Vehicles | 0 (0.0%) | 0 (0.0%) |
| Total | 283 (100.0%) | 238 (100.0%) |
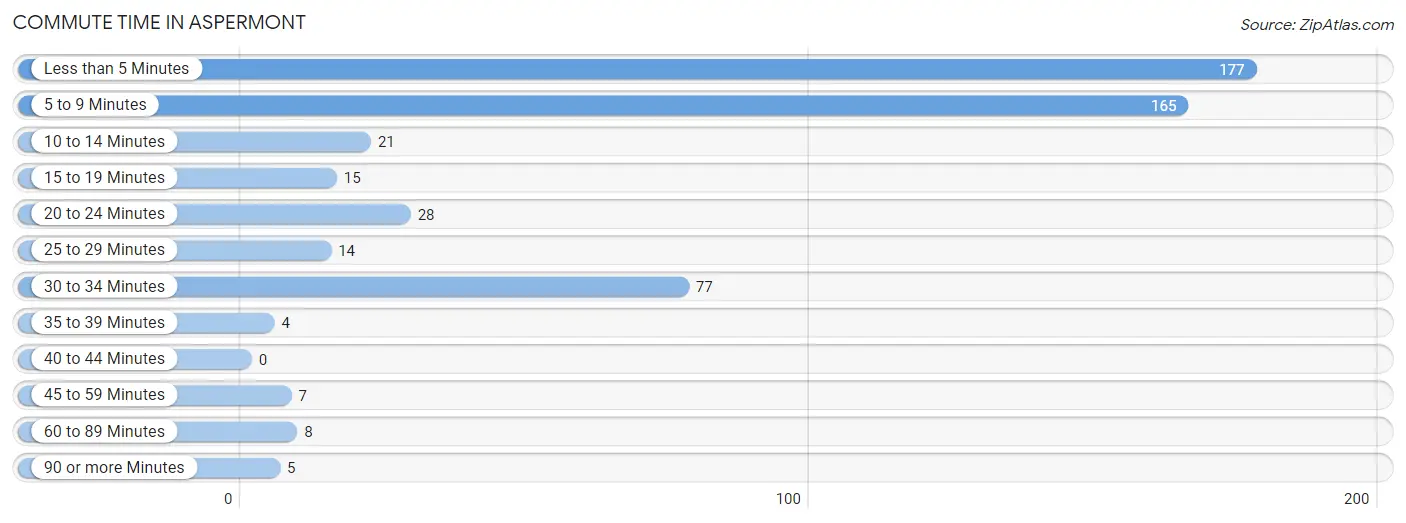
Commute Time in Aspermont
The most frequently occuring commute durations in Aspermont are less than 5 minutes (177 commuters, 34.0%), 5 to 9 minutes (165 commuters, 31.7%), and 30 to 34 minutes (77 commuters, 14.8%).
| Commute Time | # Commuters | % Commuters |
| Less than 5 Minutes | 177 | 34.0% |
| 5 to 9 Minutes | 165 | 31.7% |
| 10 to 14 Minutes | 21 | 4.0% |
| 15 to 19 Minutes | 15 | 2.9% |
| 20 to 24 Minutes | 28 | 5.4% |
| 25 to 29 Minutes | 14 | 2.7% |
| 30 to 34 Minutes | 77 | 14.8% |
| 35 to 39 Minutes | 4 | 0.8% |
| 40 to 44 Minutes | 0 | 0.0% |
| 45 to 59 Minutes | 7 | 1.3% |
| 60 to 89 Minutes | 8 | 1.5% |
| 90 or more Minutes | 5 | 1.0% |
Commute Time by Sex in Aspermont
The most common commute times in Aspermont are 5 to 9 minutes (111 commuters, 39.2%) for males and less than 5 minutes (156 commuters, 65.5%) for females.
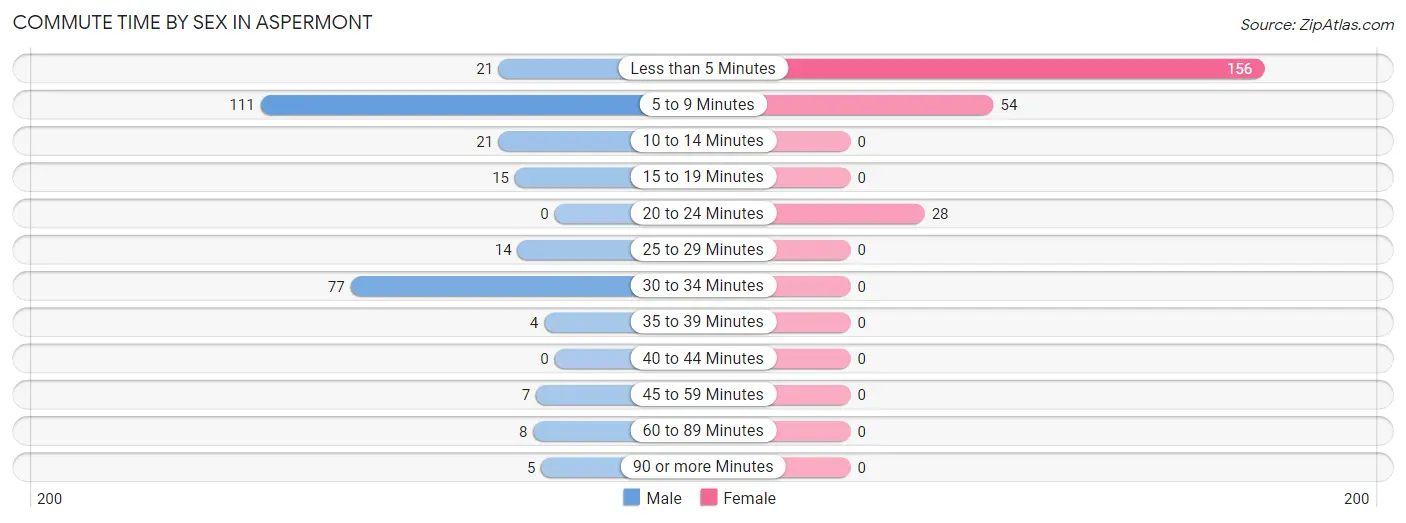
| Commute Time | Male | Female |
| Less than 5 Minutes | 21 (7.4%) | 156 (65.5%) |
| 5 to 9 Minutes | 111 (39.2%) | 54 (22.7%) |
| 10 to 14 Minutes | 21 (7.4%) | 0 (0.0%) |
| 15 to 19 Minutes | 15 (5.3%) | 0 (0.0%) |
| 20 to 24 Minutes | 0 (0.0%) | 28 (11.8%) |
| 25 to 29 Minutes | 14 (5.0%) | 0 (0.0%) |
| 30 to 34 Minutes | 77 (27.2%) | 0 (0.0%) |
| 35 to 39 Minutes | 4 (1.4%) | 0 (0.0%) |
| 40 to 44 Minutes | 0 (0.0%) | 0 (0.0%) |
| 45 to 59 Minutes | 7 (2.5%) | 0 (0.0%) |
| 60 to 89 Minutes | 8 (2.8%) | 0 (0.0%) |
| 90 or more Minutes | 5 (1.8%) | 0 (0.0%) |
Time of Departure to Work by Sex in Aspermont
The most frequent times of departure to work in Aspermont are 7:30 AM to 7:59 AM (66, 23.3%) for males and 7:30 AM to 7:59 AM (126, 52.9%) for females.
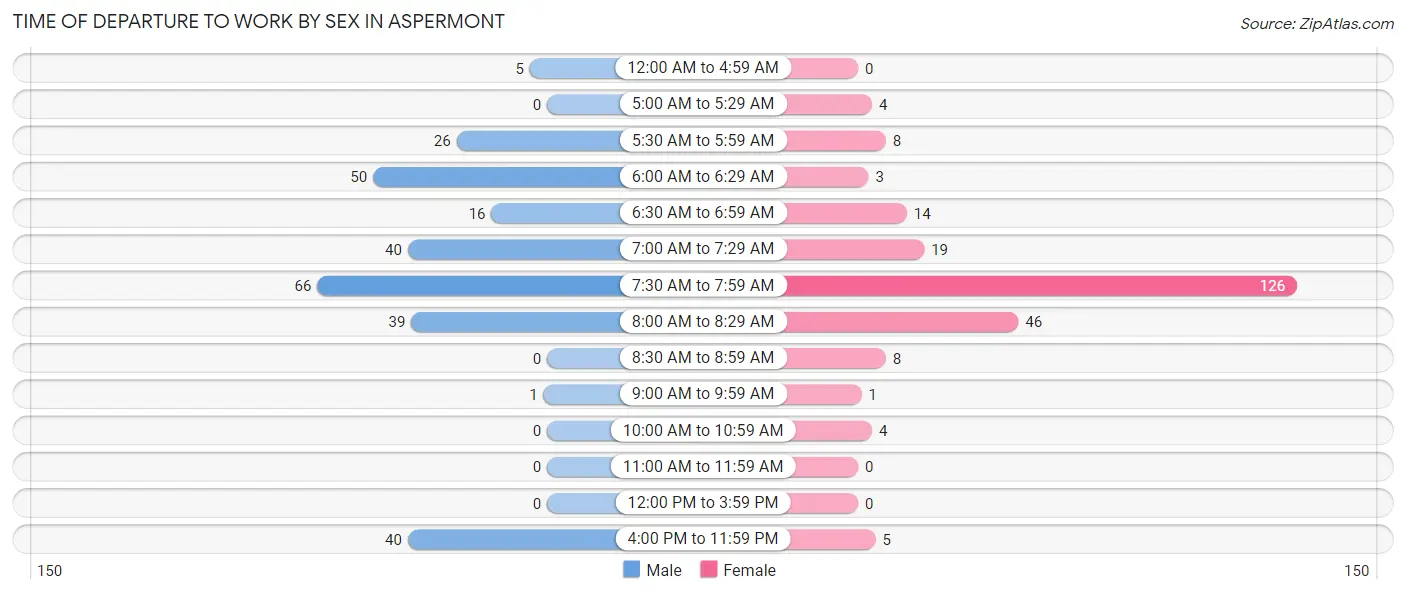
| Time of Departure | Male | Female |
| 12:00 AM to 4:59 AM | 5 (1.8%) | 0 (0.0%) |
| 5:00 AM to 5:29 AM | 0 (0.0%) | 4 (1.7%) |
| 5:30 AM to 5:59 AM | 26 (9.2%) | 8 (3.4%) |
| 6:00 AM to 6:29 AM | 50 (17.7%) | 3 (1.3%) |
| 6:30 AM to 6:59 AM | 16 (5.7%) | 14 (5.9%) |
| 7:00 AM to 7:29 AM | 40 (14.1%) | 19 (8.0%) |
| 7:30 AM to 7:59 AM | 66 (23.3%) | 126 (52.9%) |
| 8:00 AM to 8:29 AM | 39 (13.8%) | 46 (19.3%) |
| 8:30 AM to 8:59 AM | 0 (0.0%) | 8 (3.4%) |
| 9:00 AM to 9:59 AM | 1 (0.4%) | 1 (0.4%) |
| 10:00 AM to 10:59 AM | 0 (0.0%) | 4 (1.7%) |
| 11:00 AM to 11:59 AM | 0 (0.0%) | 0 (0.0%) |
| 12:00 PM to 3:59 PM | 0 (0.0%) | 0 (0.0%) |
| 4:00 PM to 11:59 PM | 40 (14.1%) | 5 (2.1%) |
| Total | 283 (100.0%) | 238 (100.0%) |
Housing Occupancy in Aspermont
Occupancy by Ownership in Aspermont
Of the total 308 dwellings in Aspermont, owner-occupied units account for 244 (79.2%), while renter-occupied units make up 64 (20.8%).
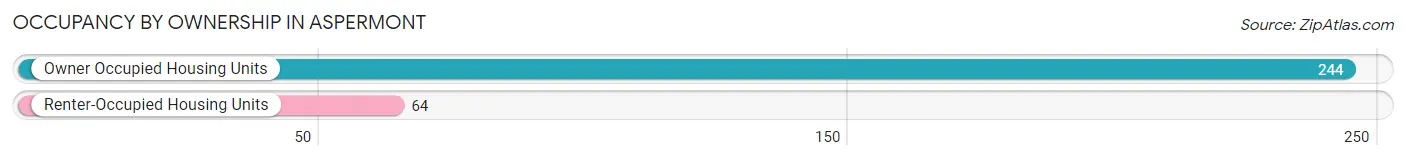
| Occupancy | # Housing Units | % Housing Units |
| Owner Occupied Housing Units | 244 | 79.2% |
| Renter-Occupied Housing Units | 64 | 20.8% |
| Total Occupied Housing Units | 308 | 100.0% |
Occupancy by Household Size in Aspermont
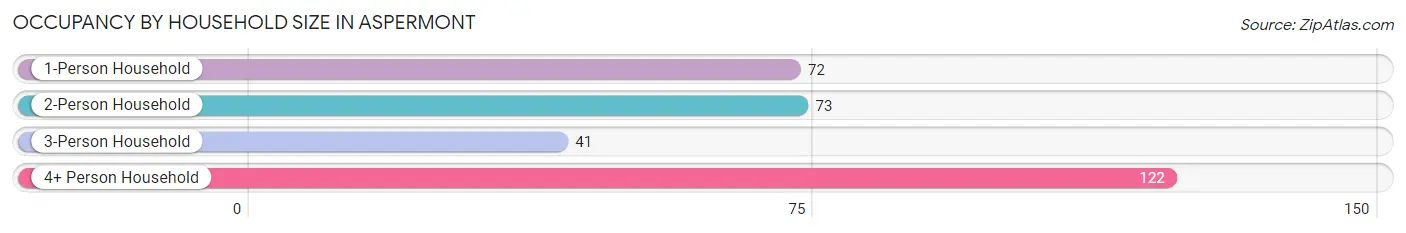
| Household Size | # Housing Units | % Housing Units |
| 1-Person Household | 72 | 23.4% |
| 2-Person Household | 73 | 23.7% |
| 3-Person Household | 41 | 13.3% |
| 4+ Person Household | 122 | 39.6% |
| Total Housing Units | 308 | 100.0% |
Occupancy by Ownership by Household Size in Aspermont
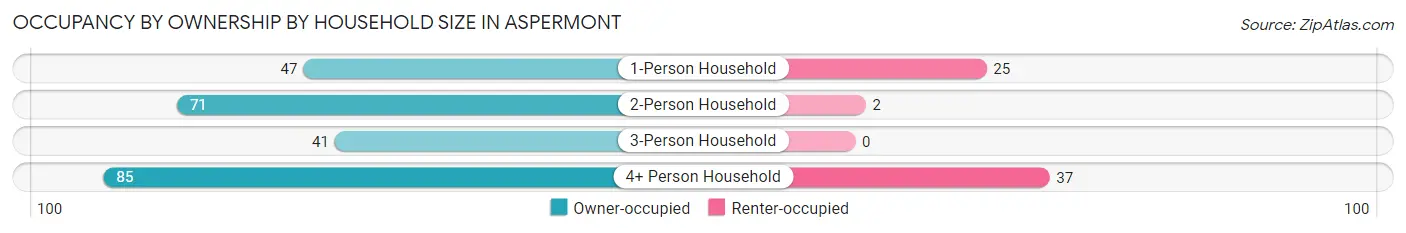
| Household Size | Owner-occupied | Renter-occupied |
| 1-Person Household | 47 (65.3%) | 25 (34.7%) |
| 2-Person Household | 71 (97.3%) | 2 (2.7%) |
| 3-Person Household | 41 (100.0%) | 0 (0.0%) |
| 4+ Person Household | 85 (69.7%) | 37 (30.3%) |
| Total Housing Units | 244 (79.2%) | 64 (20.8%) |
Occupancy by Educational Attainment in Aspermont
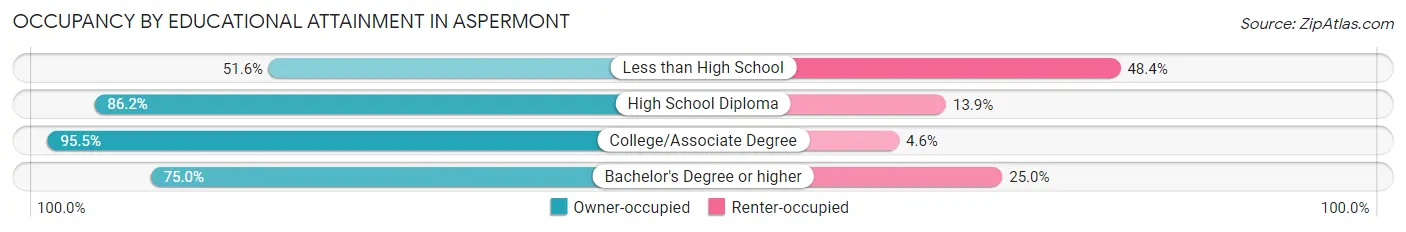
| Household Size | Owner-occupied | Renter-occupied |
| Less than High School | 33 (51.6%) | 31 (48.4%) |
| High School Diploma | 112 (86.2%) | 18 (13.9%) |
| College/Associate Degree | 63 (95.5%) | 3 (4.5%) |
| Bachelor's Degree or higher | 36 (75.0%) | 12 (25.0%) |
Occupancy by Age of Householder in Aspermont
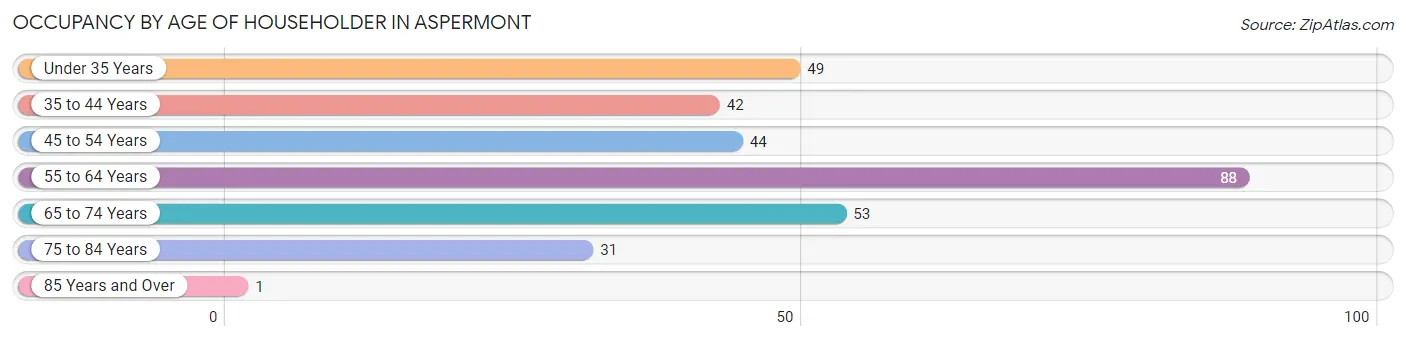
| Age Bracket | # Households | % Households |
| Under 35 Years | 49 | 15.9% |
| 35 to 44 Years | 42 | 13.6% |
| 45 to 54 Years | 44 | 14.3% |
| 55 to 64 Years | 88 | 28.6% |
| 65 to 74 Years | 53 | 17.2% |
| 75 to 84 Years | 31 | 10.1% |
| 85 Years and Over | 1 | 0.3% |
| Total | 308 | 100.0% |
Housing Finances in Aspermont
Median Income by Occupancy in Aspermont
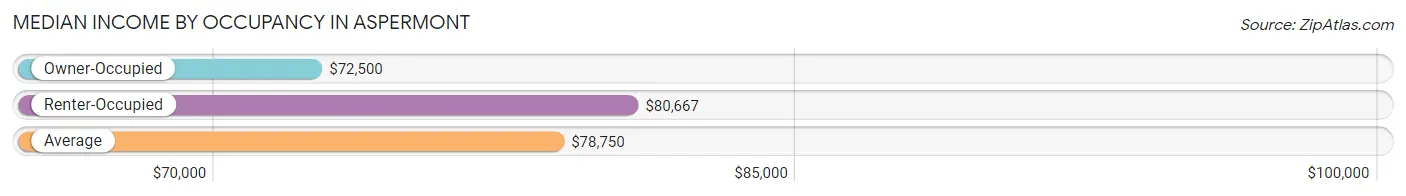
| Occupancy Type | # Households | Median Income |
| Owner-Occupied | 244 (79.2%) | $72,500 |
| Renter-Occupied | 64 (20.8%) | $80,667 |
| Average | 308 (100.0%) | $78,750 |
Occupancy by Householder Income Bracket in Aspermont
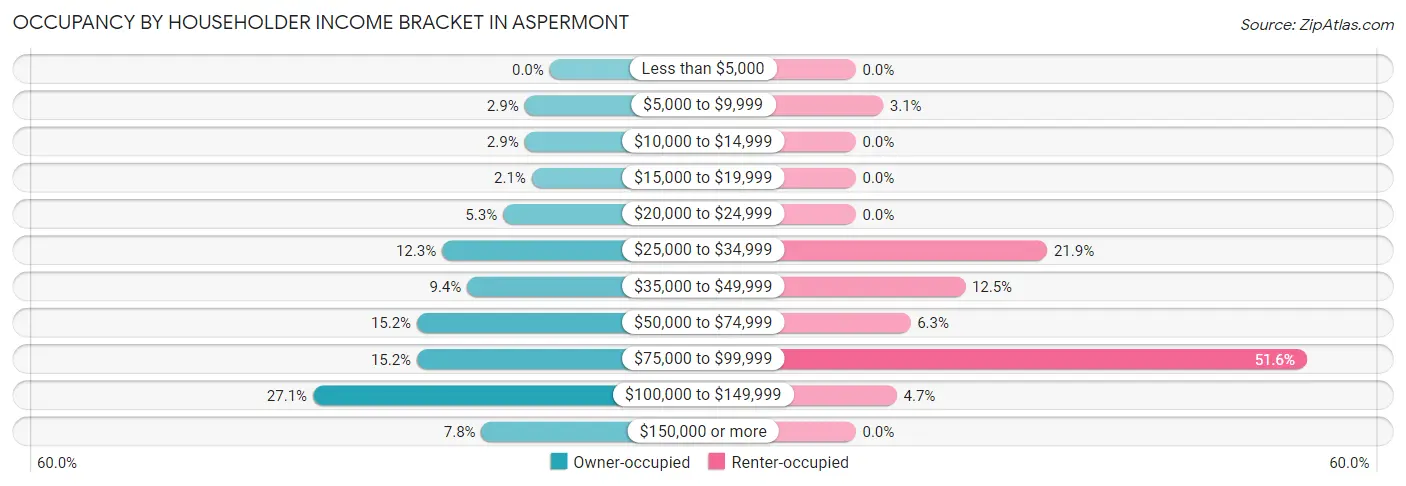
| Income Bracket | Owner-occupied | Renter-occupied |
| Less than $5,000 | 0 (0.0%) | 0 (0.0%) |
| $5,000 to $9,999 | 7 (2.9%) | 2 (3.1%) |
| $10,000 to $14,999 | 7 (2.9%) | 0 (0.0%) |
| $15,000 to $19,999 | 5 (2.1%) | 0 (0.0%) |
| $20,000 to $24,999 | 13 (5.3%) | 0 (0.0%) |
| $25,000 to $34,999 | 30 (12.3%) | 14 (21.9%) |
| $35,000 to $49,999 | 23 (9.4%) | 8 (12.5%) |
| $50,000 to $74,999 | 37 (15.2%) | 4 (6.2%) |
| $75,000 to $99,999 | 37 (15.2%) | 33 (51.6%) |
| $100,000 to $149,999 | 66 (27.1%) | 3 (4.7%) |
| $150,000 or more | 19 (7.8%) | 0 (0.0%) |
| Total | 244 (100.0%) | 64 (100.0%) |
Monthly Housing Cost Tiers in Aspermont
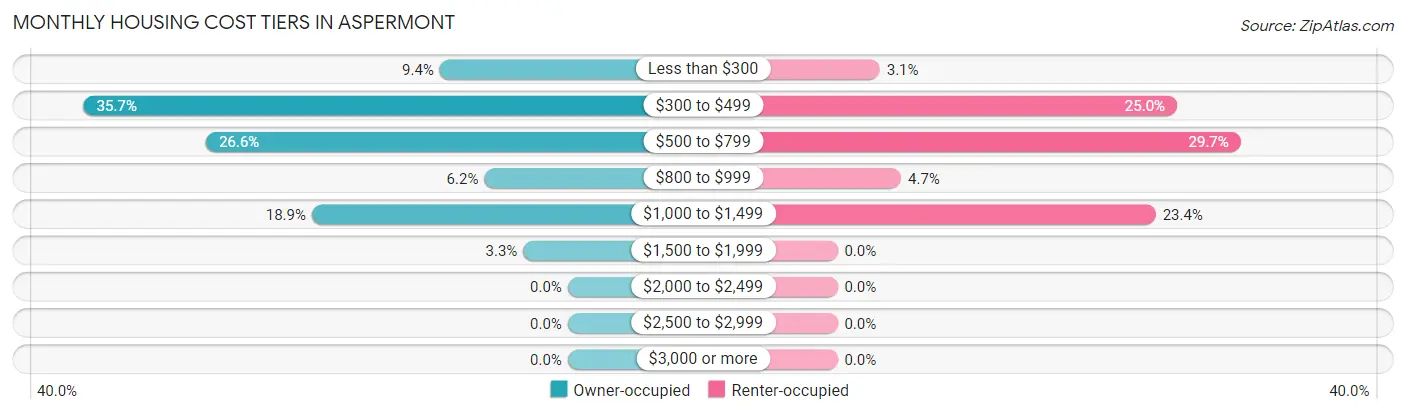
| Monthly Cost | Owner-occupied | Renter-occupied |
| Less than $300 | 23 (9.4%) | 2 (3.1%) |
| $300 to $499 | 87 (35.7%) | 16 (25.0%) |
| $500 to $799 | 65 (26.6%) | 19 (29.7%) |
| $800 to $999 | 15 (6.1%) | 3 (4.7%) |
| $1,000 to $1,499 | 46 (18.9%) | 15 (23.4%) |
| $1,500 to $1,999 | 8 (3.3%) | 0 (0.0%) |
| $2,000 to $2,499 | 0 (0.0%) | 0 (0.0%) |
| $2,500 to $2,999 | 0 (0.0%) | 0 (0.0%) |
| $3,000 or more | 0 (0.0%) | 0 (0.0%) |
| Total | 244 (100.0%) | 64 (100.0%) |
Physical Housing Characteristics in Aspermont
Housing Structures in Aspermont
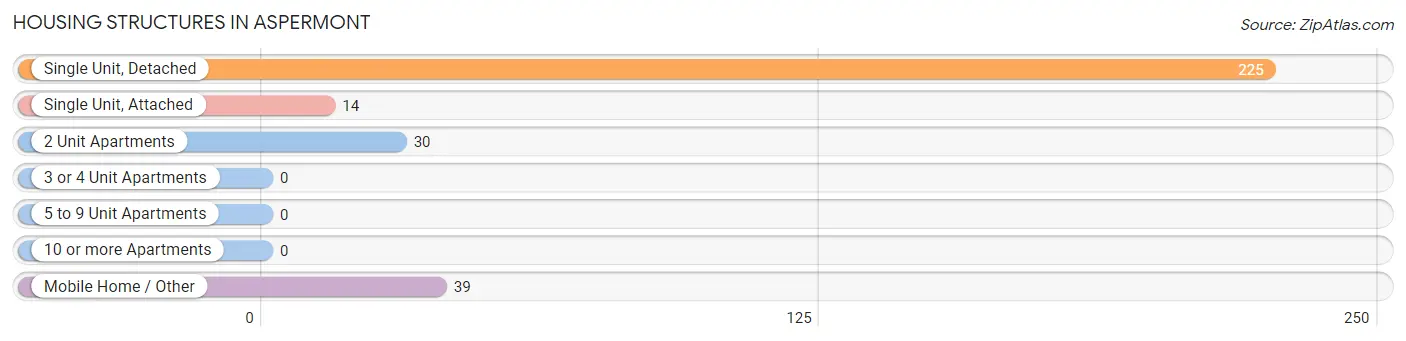
| Structure Type | # Housing Units | % Housing Units |
| Single Unit, Detached | 225 | 73.1% |
| Single Unit, Attached | 14 | 4.5% |
| 2 Unit Apartments | 30 | 9.7% |
| 3 or 4 Unit Apartments | 0 | 0.0% |
| 5 to 9 Unit Apartments | 0 | 0.0% |
| 10 or more Apartments | 0 | 0.0% |
| Mobile Home / Other | 39 | 12.7% |
| Total | 308 | 100.0% |
Housing Structures by Occupancy in Aspermont
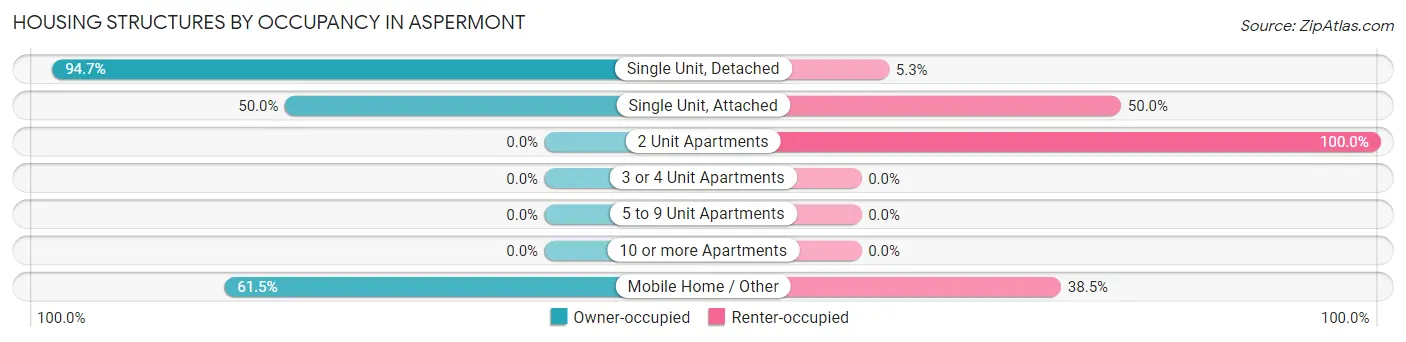
| Structure Type | Owner-occupied | Renter-occupied |
| Single Unit, Detached | 213 (94.7%) | 12 (5.3%) |
| Single Unit, Attached | 7 (50.0%) | 7 (50.0%) |
| 2 Unit Apartments | 0 (0.0%) | 30 (100.0%) |
| 3 or 4 Unit Apartments | 0 (0.0%) | 0 (0.0%) |
| 5 to 9 Unit Apartments | 0 (0.0%) | 0 (0.0%) |
| 10 or more Apartments | 0 (0.0%) | 0 (0.0%) |
| Mobile Home / Other | 24 (61.5%) | 15 (38.5%) |
| Total | 244 (79.2%) | 64 (20.8%) |
Housing Structures by Number of Rooms in Aspermont
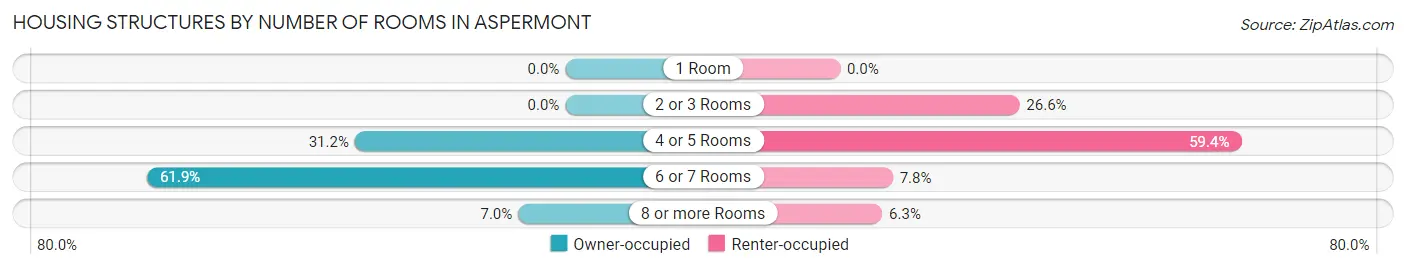
| Number of Rooms | Owner-occupied | Renter-occupied |
| 1 Room | 0 (0.0%) | 0 (0.0%) |
| 2 or 3 Rooms | 0 (0.0%) | 17 (26.6%) |
| 4 or 5 Rooms | 76 (31.1%) | 38 (59.4%) |
| 6 or 7 Rooms | 151 (61.9%) | 5 (7.8%) |
| 8 or more Rooms | 17 (7.0%) | 4 (6.2%) |
| Total | 244 (100.0%) | 64 (100.0%) |
Housing Structure by Heating Type in Aspermont
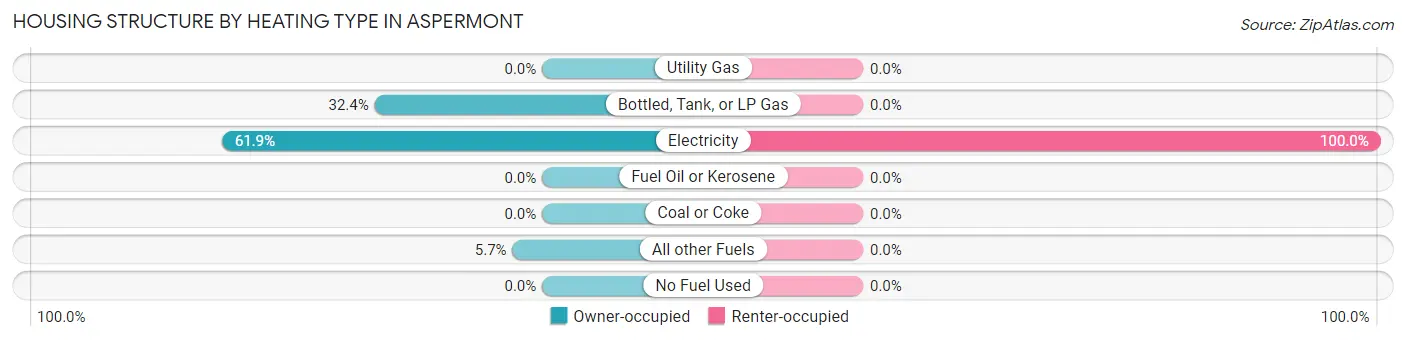
| Heating Type | Owner-occupied | Renter-occupied |
| Utility Gas | 0 (0.0%) | 0 (0.0%) |
| Bottled, Tank, or LP Gas | 79 (32.4%) | 0 (0.0%) |
| Electricity | 151 (61.9%) | 64 (100.0%) |
| Fuel Oil or Kerosene | 0 (0.0%) | 0 (0.0%) |
| Coal or Coke | 0 (0.0%) | 0 (0.0%) |
| All other Fuels | 14 (5.7%) | 0 (0.0%) |
| No Fuel Used | 0 (0.0%) | 0 (0.0%) |
| Total | 244 (100.0%) | 64 (100.0%) |
Household Vehicle Usage in Aspermont
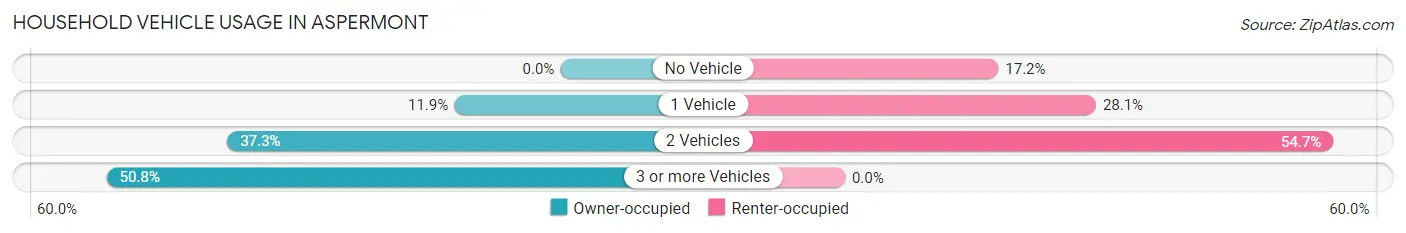
| Vehicles per Household | Owner-occupied | Renter-occupied |
| No Vehicle | 0 (0.0%) | 11 (17.2%) |
| 1 Vehicle | 29 (11.9%) | 18 (28.1%) |
| 2 Vehicles | 91 (37.3%) | 35 (54.7%) |
| 3 or more Vehicles | 124 (50.8%) | 0 (0.0%) |
| Total | 244 (100.0%) | 64 (100.0%) |
Real Estate & Mortgages in Aspermont
Real Estate and Mortgage Overview in Aspermont
| Characteristic | Without Mortgage | With Mortgage |
| Housing Units | 184 | 60 |
| Median Property Value | - | - |
| Median Household Income | $55,625 | $8 |
| Monthly Housing Costs | $400 | $0 |
| Real Estate Taxes | $702 | $0 |
Property Value by Mortgage Status in Aspermont
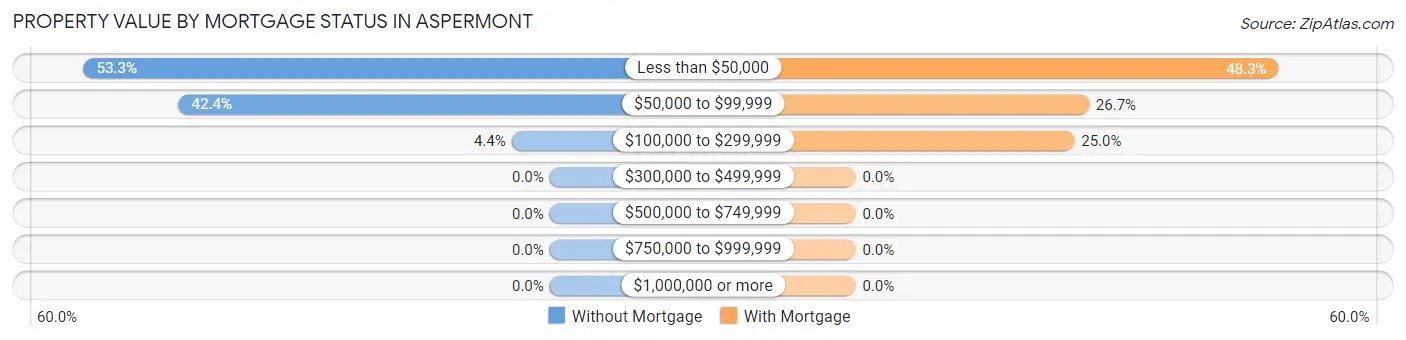
| Property Value | Without Mortgage | With Mortgage |
| Less than $50,000 | 98 (53.3%) | 29 (48.3%) |
| $50,000 to $99,999 | 78 (42.4%) | 16 (26.7%) |
| $100,000 to $299,999 | 8 (4.3%) | 15 (25.0%) |
| $300,000 to $499,999 | 0 (0.0%) | 0 (0.0%) |
| $500,000 to $749,999 | 0 (0.0%) | 0 (0.0%) |
| $750,000 to $999,999 | 0 (0.0%) | 0 (0.0%) |
| $1,000,000 or more | 0 (0.0%) | 0 (0.0%) |
| Total | 184 (100.0%) | 60 (100.0%) |
Household Income by Mortgage Status in Aspermont
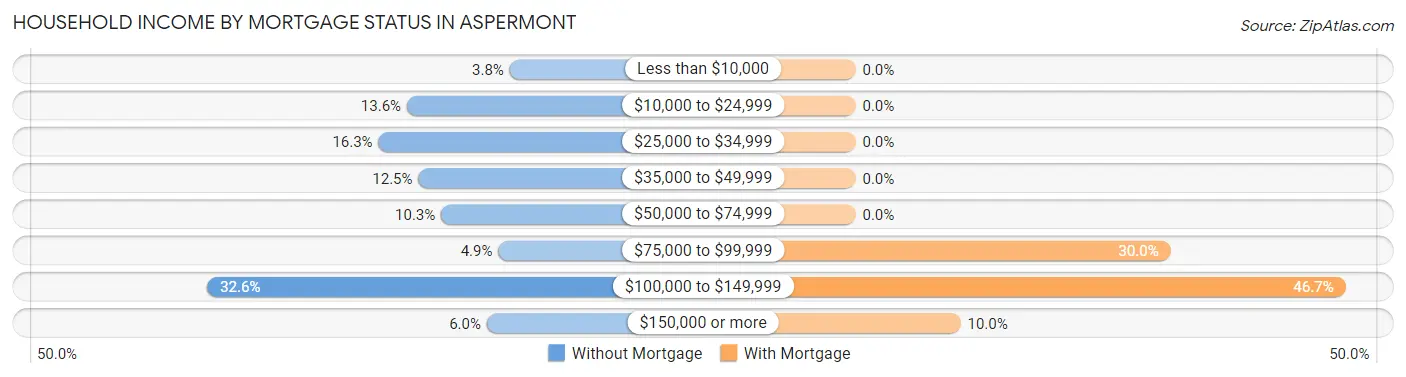
| Household Income | Without Mortgage | With Mortgage |
| Less than $10,000 | 7 (3.8%) | 0 (0.0%) |
| $10,000 to $24,999 | 25 (13.6%) | 0 (0.0%) |
| $25,000 to $34,999 | 30 (16.3%) | 0 (0.0%) |
| $35,000 to $49,999 | 23 (12.5%) | 0 (0.0%) |
| $50,000 to $74,999 | 19 (10.3%) | 0 (0.0%) |
| $75,000 to $99,999 | 9 (4.9%) | 18 (30.0%) |
| $100,000 to $149,999 | 60 (32.6%) | 28 (46.7%) |
| $150,000 or more | 11 (6.0%) | 6 (10.0%) |
| Total | 184 (100.0%) | 60 (100.0%) |
Property Value to Household Income Ratio in Aspermont
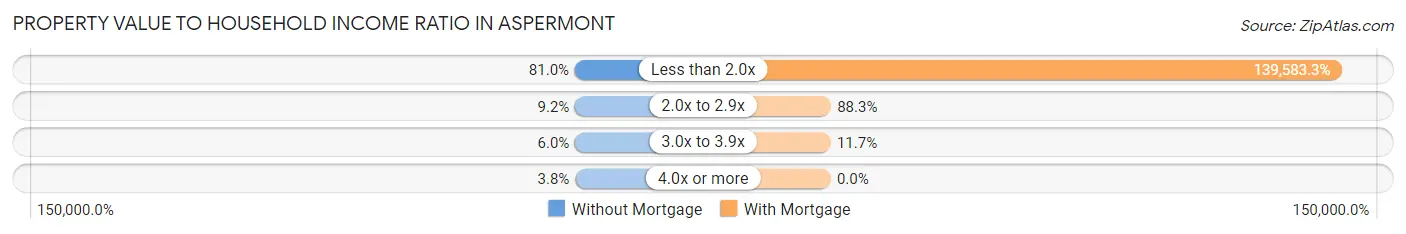
| Value-to-Income Ratio | Without Mortgage | With Mortgage |
| Less than 2.0x | 149 (81.0%) | 83,750 (139,583.3%) |
| 2.0x to 2.9x | 17 (9.2%) | 53 (88.3%) |
| 3.0x to 3.9x | 11 (6.0%) | 7 (11.7%) |
| 4.0x or more | 7 (3.8%) | 0 (0.0%) |
| Total | 184 (100.0%) | 60 (100.0%) |
Real Estate Taxes by Mortgage Status in Aspermont
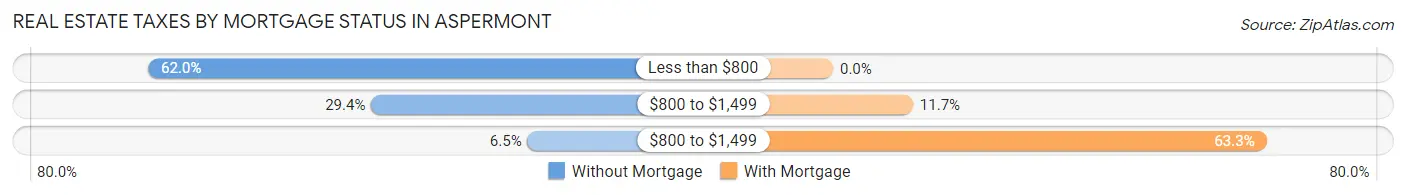
| Property Taxes | Without Mortgage | With Mortgage |
| Less than $800 | 114 (62.0%) | 0 (0.0%) |
| $800 to $1,499 | 54 (29.3%) | 7 (11.7%) |
| $800 to $1,499 | 12 (6.5%) | 38 (63.3%) |
| Total | 184 (100.0%) | 60 (100.0%) |
Health & Disability in Aspermont
Health Insurance Coverage by Age in Aspermont
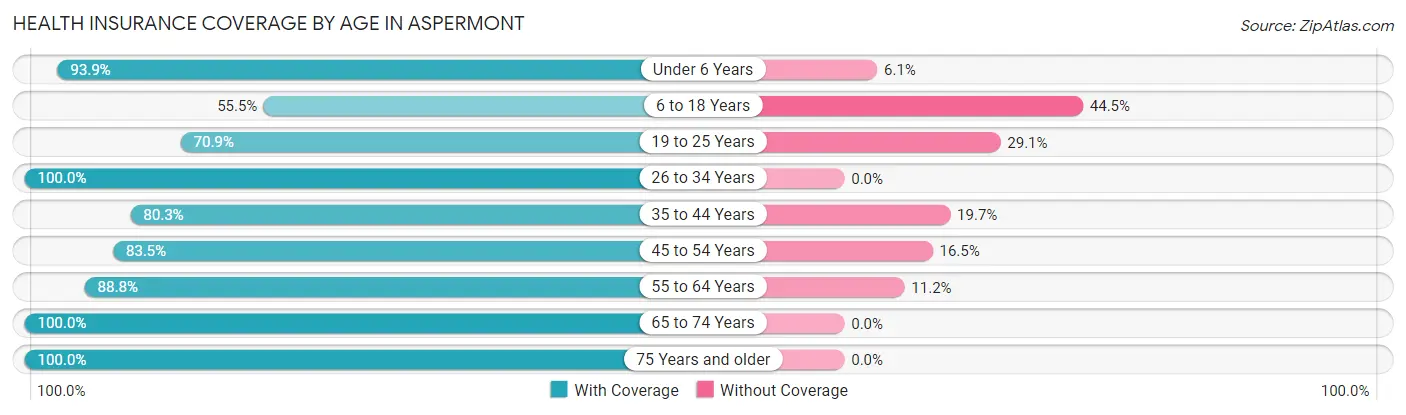
| Age Bracket | With Coverage | Without Coverage |
| Under 6 Years | 138 (93.9%) | 9 (6.1%) |
| 6 to 18 Years | 126 (55.5%) | 101 (44.5%) |
| 19 to 25 Years | 95 (70.9%) | 39 (29.1%) |
| 26 to 34 Years | 105 (100.0%) | 0 (0.0%) |
| 35 to 44 Years | 61 (80.3%) | 15 (19.7%) |
| 45 to 54 Years | 66 (83.5%) | 13 (16.5%) |
| 55 to 64 Years | 103 (88.8%) | 13 (11.2%) |
| 65 to 74 Years | 90 (100.0%) | 0 (0.0%) |
| 75 Years and older | 41 (100.0%) | 0 (0.0%) |
| Total | 825 (81.3%) | 190 (18.7%) |
Health Insurance Coverage by Citizenship Status in Aspermont
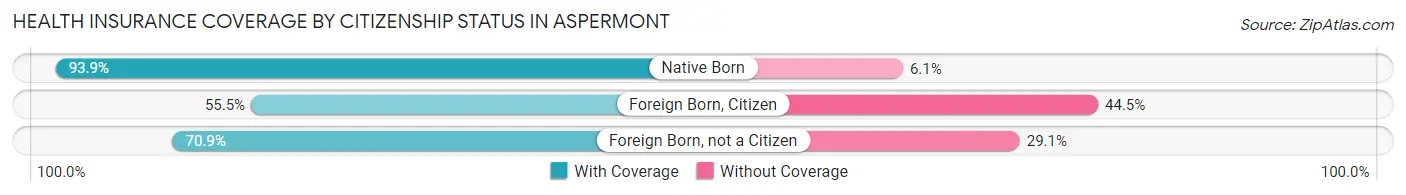
| Citizenship Status | With Coverage | Without Coverage |
| Native Born | 138 (93.9%) | 9 (6.1%) |
| Foreign Born, Citizen | 126 (55.5%) | 101 (44.5%) |
| Foreign Born, not a Citizen | 95 (70.9%) | 39 (29.1%) |
Health Insurance Coverage by Household Income in Aspermont
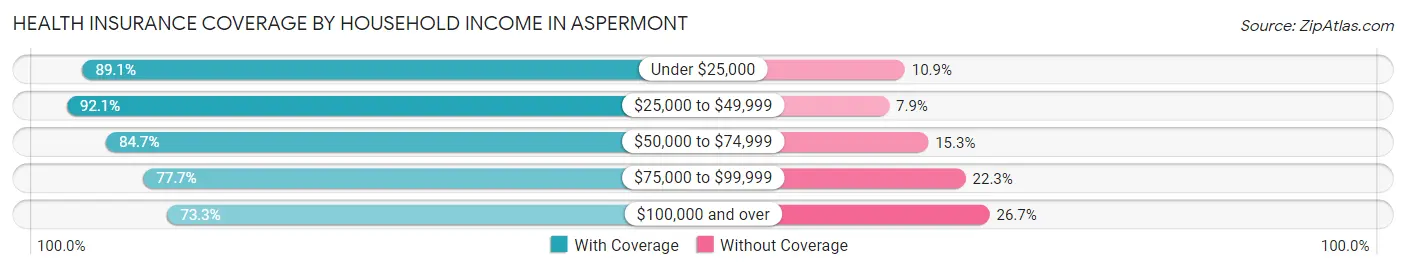
| Household Income | With Coverage | Without Coverage |
| Under $25,000 | 41 (89.1%) | 5 (10.9%) |
| $25,000 to $49,999 | 186 (92.1%) | 16 (7.9%) |
| $50,000 to $74,999 | 161 (84.7%) | 29 (15.3%) |
| $75,000 to $99,999 | 248 (77.7%) | 71 (22.3%) |
| $100,000 and over | 189 (73.3%) | 69 (26.7%) |
Public vs Private Health Insurance Coverage by Age in Aspermont
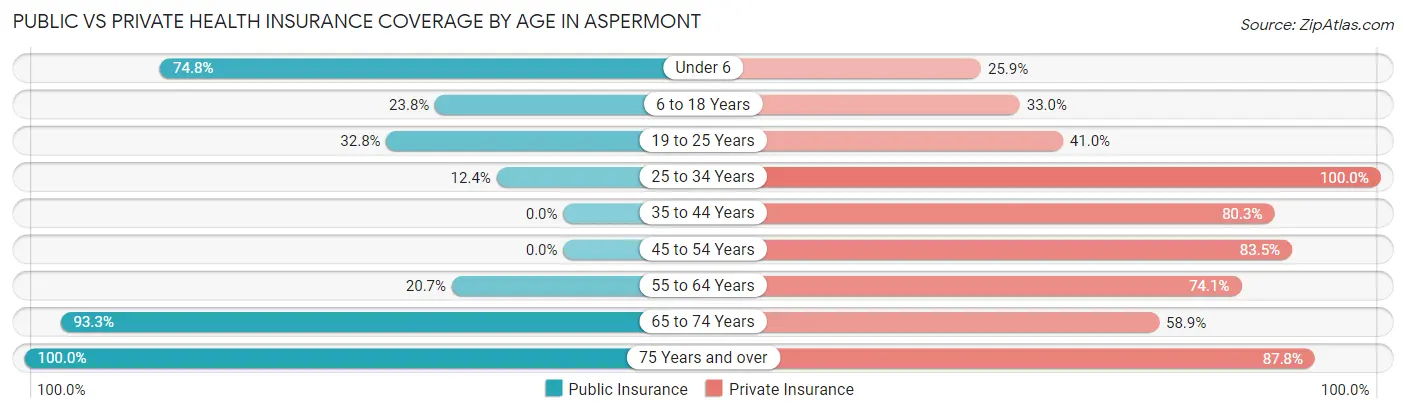
| Age Bracket | Public Insurance | Private Insurance |
| Under 6 | 110 (74.8%) | 38 (25.9%) |
| 6 to 18 Years | 54 (23.8%) | 75 (33.0%) |
| 19 to 25 Years | 44 (32.8%) | 55 (41.0%) |
| 25 to 34 Years | 13 (12.4%) | 105 (100.0%) |
| 35 to 44 Years | 0 (0.0%) | 61 (80.3%) |
| 45 to 54 Years | 0 (0.0%) | 66 (83.5%) |
| 55 to 64 Years | 24 (20.7%) | 86 (74.1%) |
| 65 to 74 Years | 84 (93.3%) | 53 (58.9%) |
| 75 Years and over | 41 (100.0%) | 36 (87.8%) |
| Total | 370 (36.4%) | 575 (56.7%) |
Disability Status by Sex by Age in Aspermont
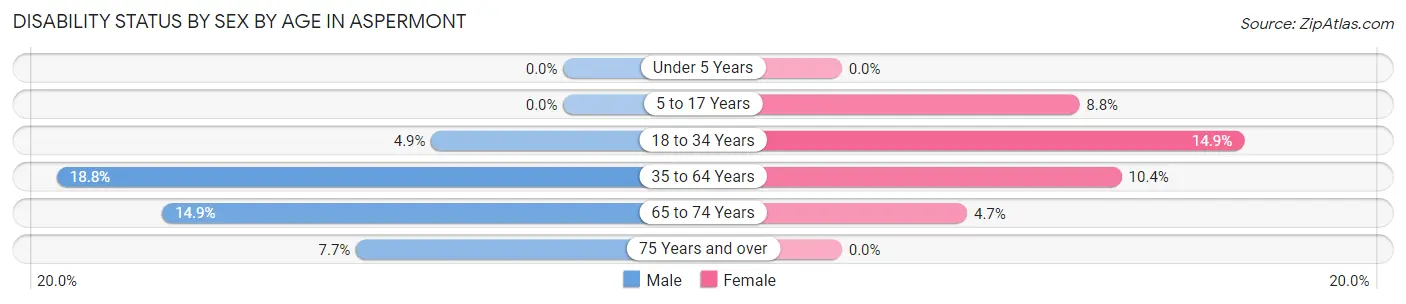
| Age Bracket | Male | Female |
| Under 5 Years | 0 (0.0%) | 0 (0.0%) |
| 5 to 17 Years | 0 (0.0%) | 9 (8.8%) |
| 18 to 34 Years | 7 (4.9%) | 20 (14.9%) |
| 35 to 64 Years | 22 (18.8%) | 16 (10.4%) |
| 65 to 74 Years | 7 (14.9%) | 2 (4.6%) |
| 75 Years and over | 1 (7.7%) | 0 (0.0%) |
Disability Class by Sex by Age in Aspermont
Disability Class: Hearing Difficulty
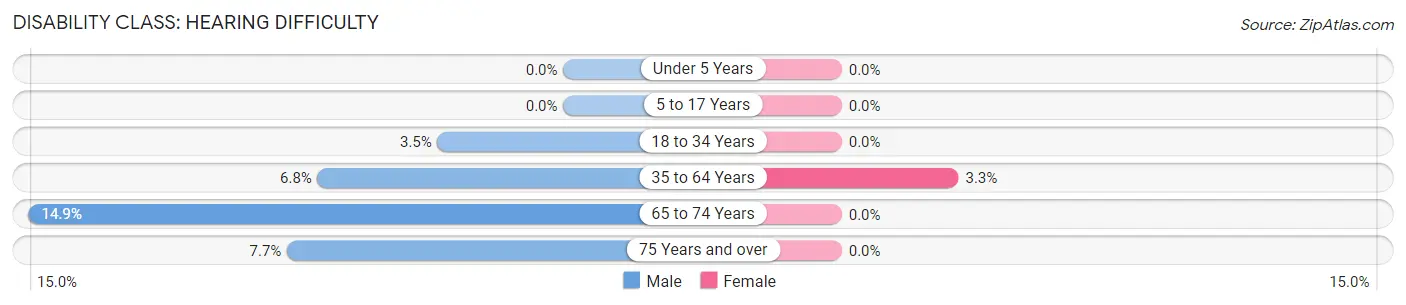
| Age Bracket | Male | Female |
| Under 5 Years | 0 (0.0%) | 0 (0.0%) |
| 5 to 17 Years | 0 (0.0%) | 0 (0.0%) |
| 18 to 34 Years | 5 (3.5%) | 0 (0.0%) |
| 35 to 64 Years | 8 (6.8%) | 5 (3.3%) |
| 65 to 74 Years | 7 (14.9%) | 0 (0.0%) |
| 75 Years and over | 1 (7.7%) | 0 (0.0%) |
Disability Class: Vision Difficulty
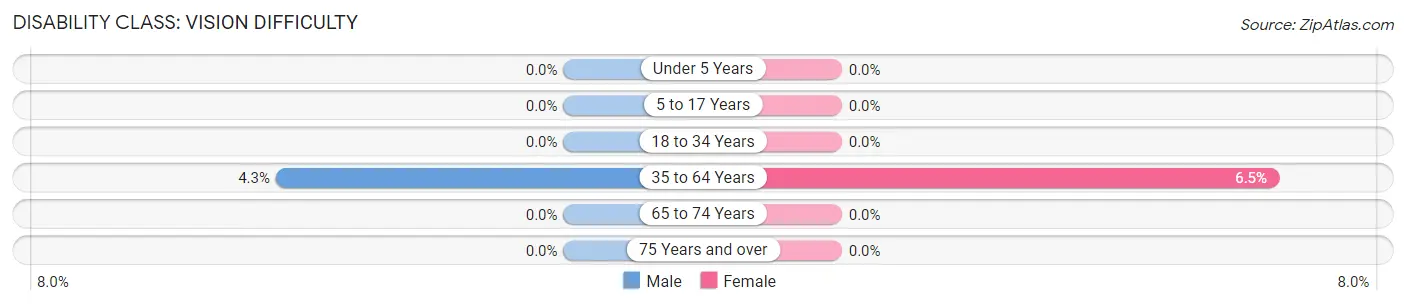
| Age Bracket | Male | Female |
| Under 5 Years | 0 (0.0%) | 0 (0.0%) |
| 5 to 17 Years | 0 (0.0%) | 0 (0.0%) |
| 18 to 34 Years | 0 (0.0%) | 0 (0.0%) |
| 35 to 64 Years | 5 (4.3%) | 10 (6.5%) |
| 65 to 74 Years | 0 (0.0%) | 0 (0.0%) |
| 75 Years and over | 0 (0.0%) | 0 (0.0%) |
Disability Class: Cognitive Difficulty
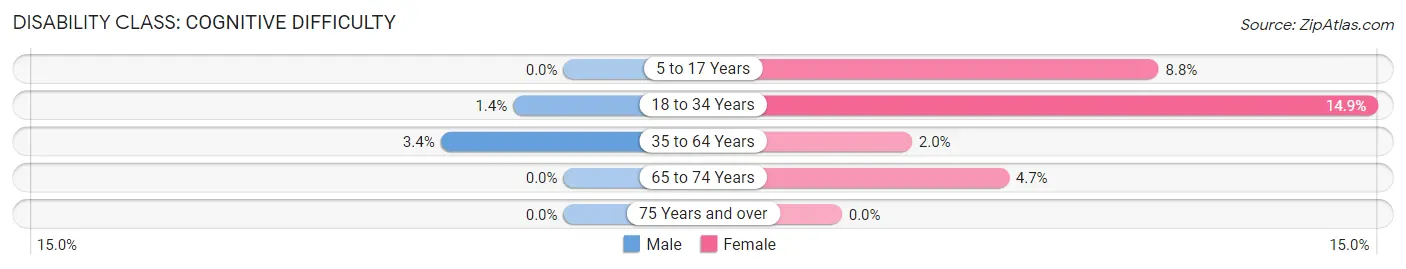
| Age Bracket | Male | Female |
| 5 to 17 Years | 0 (0.0%) | 9 (8.8%) |
| 18 to 34 Years | 2 (1.4%) | 20 (14.9%) |
| 35 to 64 Years | 4 (3.4%) | 3 (1.9%) |
| 65 to 74 Years | 0 (0.0%) | 2 (4.6%) |
| 75 Years and over | 0 (0.0%) | 0 (0.0%) |
Disability Class: Ambulatory Difficulty
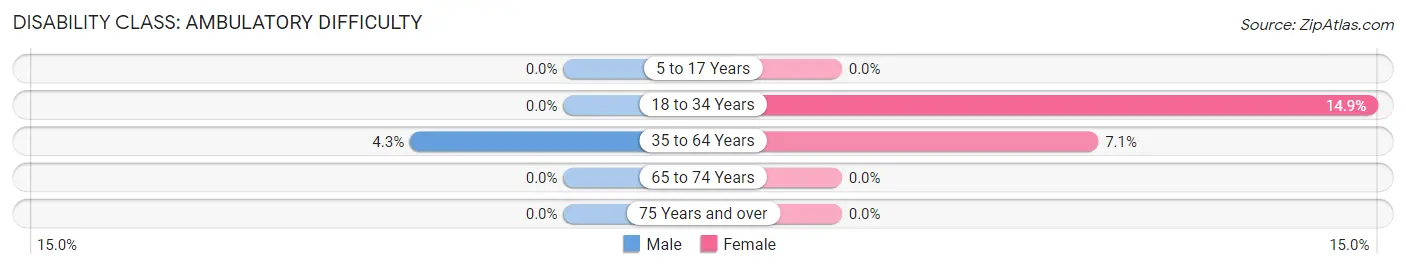
| Age Bracket | Male | Female |
| 5 to 17 Years | 0 (0.0%) | 0 (0.0%) |
| 18 to 34 Years | 0 (0.0%) | 20 (14.9%) |
| 35 to 64 Years | 5 (4.3%) | 11 (7.1%) |
| 65 to 74 Years | 0 (0.0%) | 0 (0.0%) |
| 75 Years and over | 0 (0.0%) | 0 (0.0%) |
Disability Class: Self-Care Difficulty
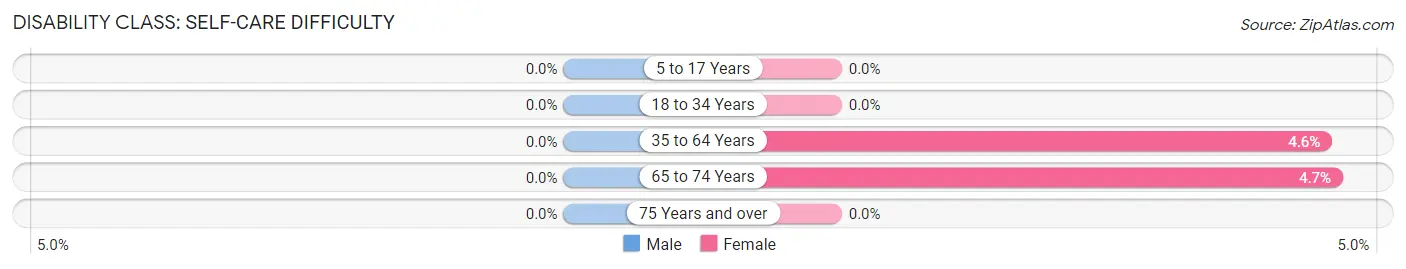
| Age Bracket | Male | Female |
| 5 to 17 Years | 0 (0.0%) | 0 (0.0%) |
| 18 to 34 Years | 0 (0.0%) | 0 (0.0%) |
| 35 to 64 Years | 0 (0.0%) | 7 (4.5%) |
| 65 to 74 Years | 0 (0.0%) | 2 (4.6%) |
| 75 Years and over | 0 (0.0%) | 0 (0.0%) |
Technology Access in Aspermont
Computing Device Access in Aspermont
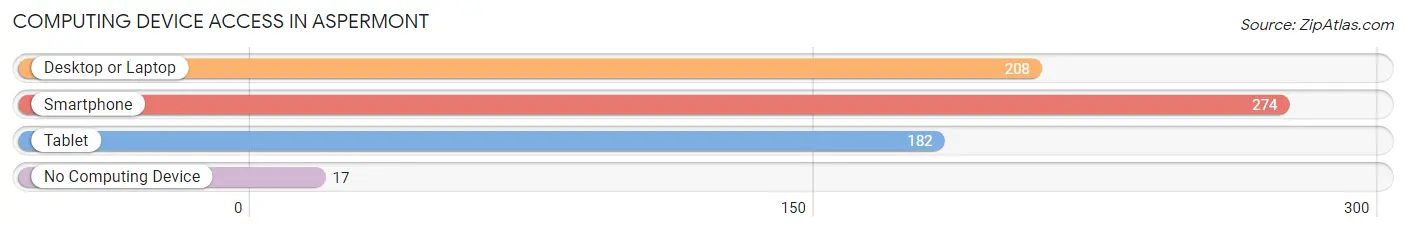
| Device Type | # Households | % Households |
| Desktop or Laptop | 208 | 67.5% |
| Smartphone | 274 | 89.0% |
| Tablet | 182 | 59.1% |
| No Computing Device | 17 | 5.5% |
| Total | 308 | 100.0% |
Internet Access in Aspermont
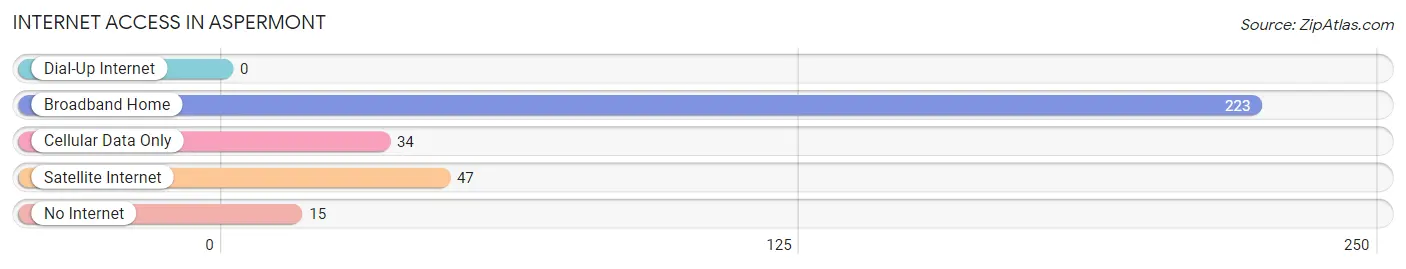
| Internet Type | # Households | % Households |
| Dial-Up Internet | 0 | 0.0% |
| Broadband Home | 223 | 72.4% |
| Cellular Data Only | 34 | 11.0% |
| Satellite Internet | 47 | 15.3% |
| No Internet | 15 | 4.9% |
| Total | 308 | 100.0% |
Aspermont Summary
Aspermont is a small town located in Stonewall County, Texas, United States. It is situated on the banks of the Salt Fork of the Brazos River, approximately 90 miles northwest of Abilene. The town was founded in 1881 and named after Aspermont, a small town in England. As of the 2010 census, the population of Aspermont was 845.
History
Aspermont was founded in 1881 by a group of settlers from England. The town was named after Aspermont, a small town in England. The settlers were attracted to the area due to its fertile soil and abundant water supply. The first post office was established in 1882 and the town was incorporated in 1884.
In the early 1900s, Aspermont was a thriving agricultural community. Cotton was the main crop, but other crops such as corn, wheat, and oats were also grown. The town also had a number of businesses, including a bank, a hotel, a general store, and a blacksmith shop.
In the 1920s, the town began to decline due to the Great Depression and the Dust Bowl. Many of the businesses closed and the population decreased. In the 1940s, the town began to recover and the population began to increase.
Geography
Aspermont is located in Stonewall County, Texas, approximately 90 miles northwest of Abilene. The town is situated on the banks of the Salt Fork of the Brazos River. The terrain is mostly flat with some rolling hills. The climate is semi-arid with hot summers and mild winters.
Economy
The economy of Aspermont is largely based on agriculture. Cotton is the main crop, but other crops such as corn, wheat, and oats are also grown. The town also has a number of businesses, including a bank, a hotel, a general store, and a blacksmith shop.
Demographics
As of the 2010 census, the population of Aspermont was 845. The racial makeup of the town was 94.3% White, 0.2% African American, 0.2% Native American, 0.2% Asian, 0.2% Pacific Islander, 3.7% from other races, and 1.2% from two or more races. Hispanic or Latino of any race were 6.2% of the population.
The median income for a household in Aspermont was $30,000, and the median income for a family was $35,000. The per capita income for the town was $14,000. About 17.2% of families and 20.2% of the population were below the poverty line, including 28.3% of those under age 18 and 10.2% of those age 65 or over.
Common Questions
What is Per Capita Income in Aspermont?
Per Capita income in Aspermont is $23,238.
What is the Median Family Income in Aspermont?
Median Family Income in Aspermont is $81,806.
What is the Median Household income in Aspermont?
Median Household Income in Aspermont is $78,750.
What is Income or Wage Gap in Aspermont?
Income or Wage Gap in Aspermont is 55.3%.
Women in Aspermont earn 44.7 cents for every dollar earned by a man.
What is Inequality or Gini Index in Aspermont?
Inequality or Gini Index in Aspermont is 0.33.
What is the Total Population of Aspermont?
Total Population of Aspermont is 1,057.
What is the Total Male Population of Aspermont?
Total Male Population of Aspermont is 526.
What is the Total Female Population of Aspermont?
Total Female Population of Aspermont is 531.
What is the Ratio of Males per 100 Females in Aspermont?
There are 99.06 Males per 100 Females in Aspermont.
What is the Ratio of Females per 100 Males in Aspermont?
There are 100.95 Females per 100 Males in Aspermont.
What is the Median Population Age in Aspermont?
Median Population Age in Aspermont is 30.0 Years.
What is the Average Family Size in Aspermont
Average Family Size in Aspermont is 3.9 People.
What is the Average Household Size in Aspermont
Average Household Size in Aspermont is 3.3 People.
How Large is the Labor Force in Aspermont?
There are 533 People in the Labor Forcein in Aspermont.
What is the Percentage of People in the Labor Force in Aspermont?
68.5% of People are in the Labor Force in Aspermont.
What is the Unemployment Rate in Aspermont?
Unemployment Rate in Aspermont is 2.3%.