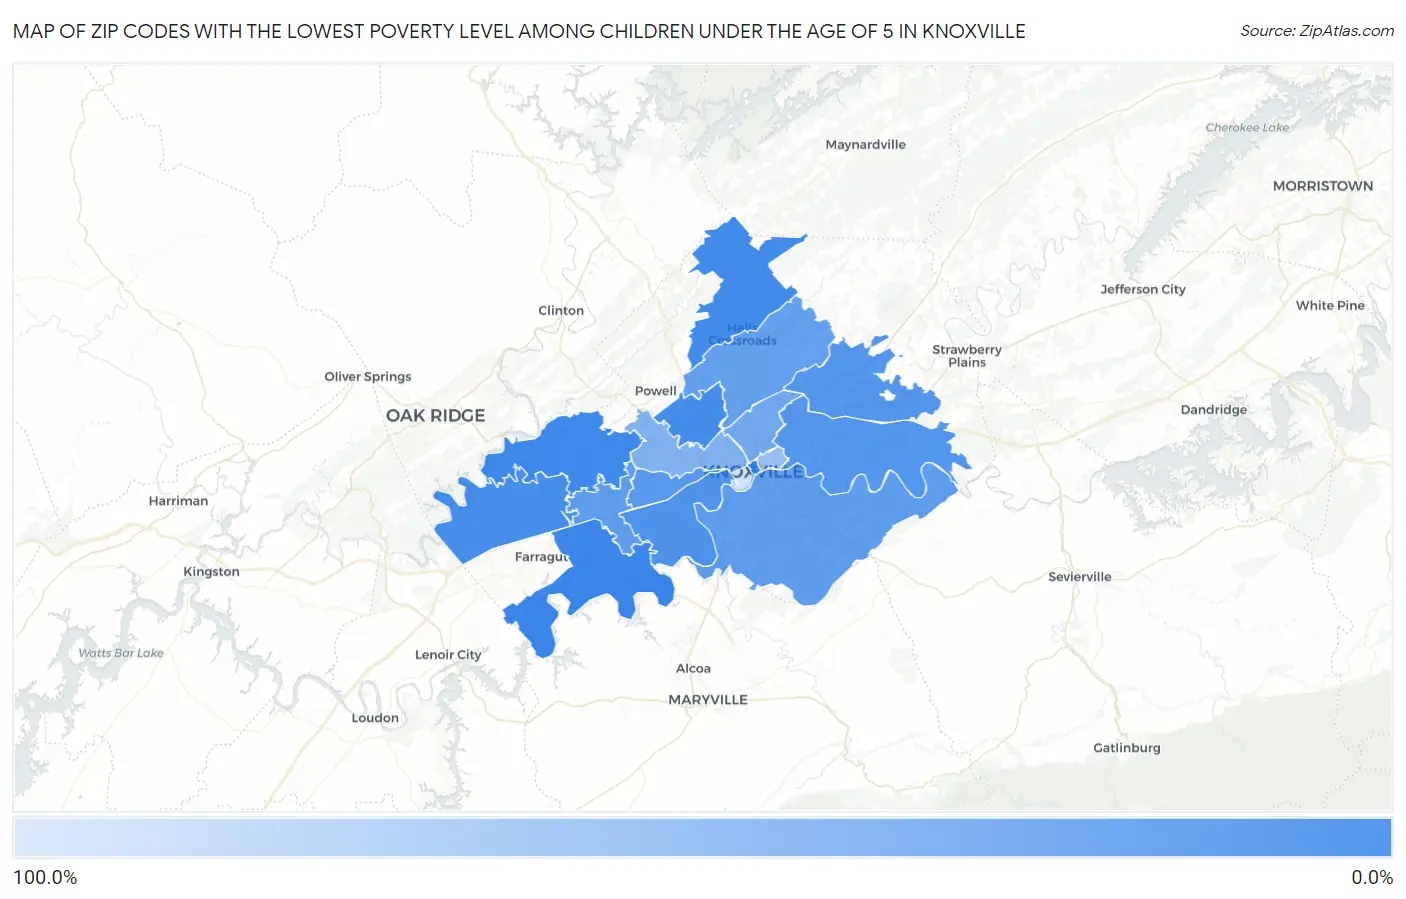
Zip Codes with the Lowest Poverty Level Among Children Under the Age of 5 in Knoxville, TN
RELATED REPORTS & OPTIONS
Lowest Poverty | Child 0-5
Knoxville
Compare Zip Codes
Map of Zip Codes with the Lowest Poverty Level Among Children Under the Age of 5 in Knoxville
100.0%
3.8%
Zip Codes with the Lowest Poverty Level Among Children Under the Age of 5 in Knoxville, TN
| Zip Code | Child Poverty | vs State | vs National | |
| 1. | 37922 | 3.8% | 21.4%(-17.5)#43 | 18.1%(-14.2)#2,052 |
| 2. | 37931 | 6.1% | 21.4%(-15.3)#63 | 18.1%(-12.0)#3,635 |
| 3. | 37938 | 6.7% | 21.4%(-14.7)#74 | 18.1%(-11.4)#4,063 |
| 4. | 37912 | 7.8% | 21.4%(-13.5)#91 | 18.1%(-10.2)#4,822 |
| 5. | 37932 | 9.8% | 21.4%(-11.6)#112 | 18.1%(-8.30)#6,118 |
| 6. | 37919 | 13.3% | 21.4%(-8.06)#144 | 18.1%(-4.73)#8,222 |
| 7. | 37914 | 16.1% | 21.4%(-5.25)#177 | 18.1%(-1.93)#9,832 |
| 8. | 37924 | 16.3% | 21.4%(-5.06)#181 | 18.1%(-1.73)#9,932 |
| 9. | 37909 | 18.0% | 21.4%(-3.41)#199 | 18.1%(-0.083)#10,707 |
| 10. | 37923 | 21.6% | 21.4%(+0.235)#238 | 18.1%(+3.56)#12,332 |
| 11. | 37920 | 22.1% | 21.4%(+0.691)#242 | 18.1%(+4.02)#12,515 |
| 12. | 37918 | 23.9% | 21.4%(+2.54)#267 | 18.1%(+5.87)#13,294 |
| 13. | 37917 | 31.6% | 21.4%(+10.3)#333 | 18.1%(+13.6)#15,755 |
| 14. | 37921 | 42.6% | 21.4%(+21.2)#393 | 18.1%(+24.5)#18,115 |
| 15. | 37915 | 55.5% | 21.4%(+34.1)#433 | 18.1%(+37.4)#19,624 |
| 16. | 37916 | 100.0% | 21.4%(+78.6)#463 | 18.1%(+81.9)#21,112 |
1
Common Questions
What are the Top 10 Zip Codes with the Lowest Poverty Level Among Children Under the Age of 5 in Knoxville, TN?
Top 10 Zip Codes with the Lowest Poverty Level Among Children Under the Age of 5 in Knoxville, TN are:
What zip code has the Lowest Poverty Level Among Children Under the Age of 5 in Knoxville, TN?
37922 has the Lowest Poverty Level Among Children Under the Age of 5 in Knoxville, TN with 3.8%.
What is the Poverty Level Among Children Under the Age of 5 in Knoxville, TN?
Poverty Level Among Children Under the Age of 5 in Knoxville is 28.0%.
What is the Poverty Level Among Children Under the Age of 5 in Tennessee?
Poverty Level Among Children Under the Age of 5 in Tennessee is 21.4%.
What is the Poverty Level Among Children Under the Age of 5 in the United States?
Poverty Level Among Children Under the Age of 5 in the United States is 18.1%.