Zip Codes with the Highest Percentage of Population Employed in Computer & Mathematics in Jackson, TN
RELATED REPORTS & OPTIONS
Computer & Mathematics
Jackson
Compare Zip Codes
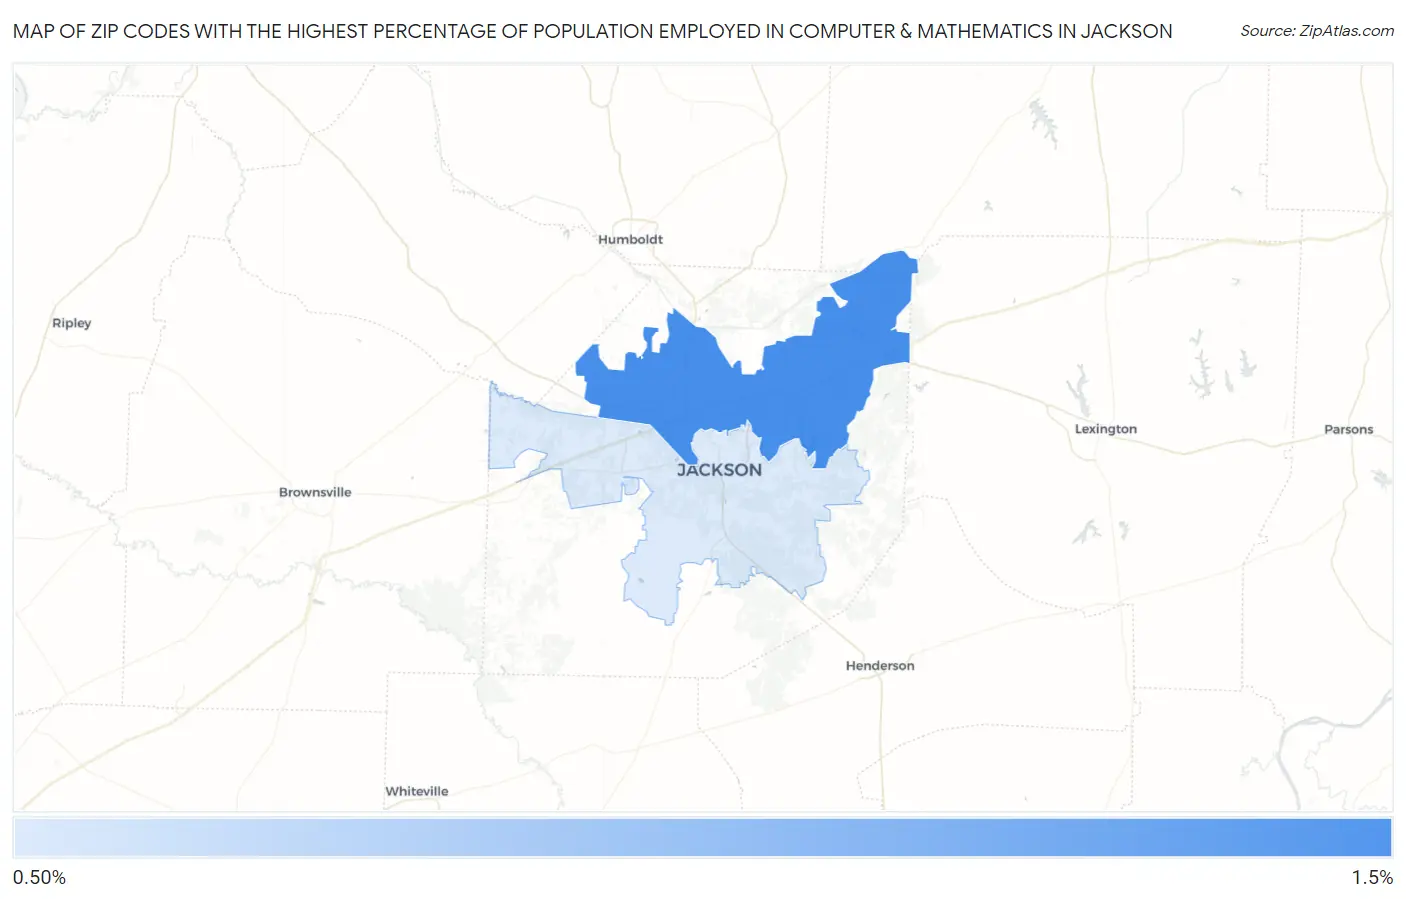
Map of Zip Codes with the Highest Percentage of Population Employed in Computer & Mathematics in Jackson
0.81%
1.1%
Zip Codes with the Highest Percentage of Population Employed in Computer & Mathematics in Jackson, TN
| Zip Code | % Employed | vs State | vs National | |
| 1. | 38305 | 1.1% | 2.6%(-1.46)#298 | 3.5%(-2.40)#16,578 |
| 2. | 38301 | 0.81% | 2.6%(-1.77)#342 | 3.5%(-2.71)#18,556 |
1
Common Questions
What are the Top Zip Codes with the Highest Percentage of Population Employed in Computer & Mathematics in Jackson, TN?
Top Zip Codes with the Highest Percentage of Population Employed in Computer & Mathematics in Jackson, TN are:
What zip code has the Highest Percentage of Population Employed in Computer & Mathematics in Jackson, TN?
38305 has the Highest Percentage of Population Employed in Computer & Mathematics in Jackson, TN with 1.1%.
What is the Percentage of Population Employed in Computer & Mathematics in Jackson, TN?
Percentage of Population Employed in Computer & Mathematics in Jackson is 0.90%.
What is the Percentage of Population Employed in Computer & Mathematics in Tennessee?
Percentage of Population Employed in Computer & Mathematics in Tennessee is 2.6%.
What is the Percentage of Population Employed in Computer & Mathematics in the United States?
Percentage of Population Employed in Computer & Mathematics in the United States is 3.5%.