Zip Codes with the Highest Percentage of Population with a Degree in Liberal Arts and History in Maryville, TN
RELATED REPORTS & OPTIONS
Liberal Arts and History
Maryville
Compare Zip Codes
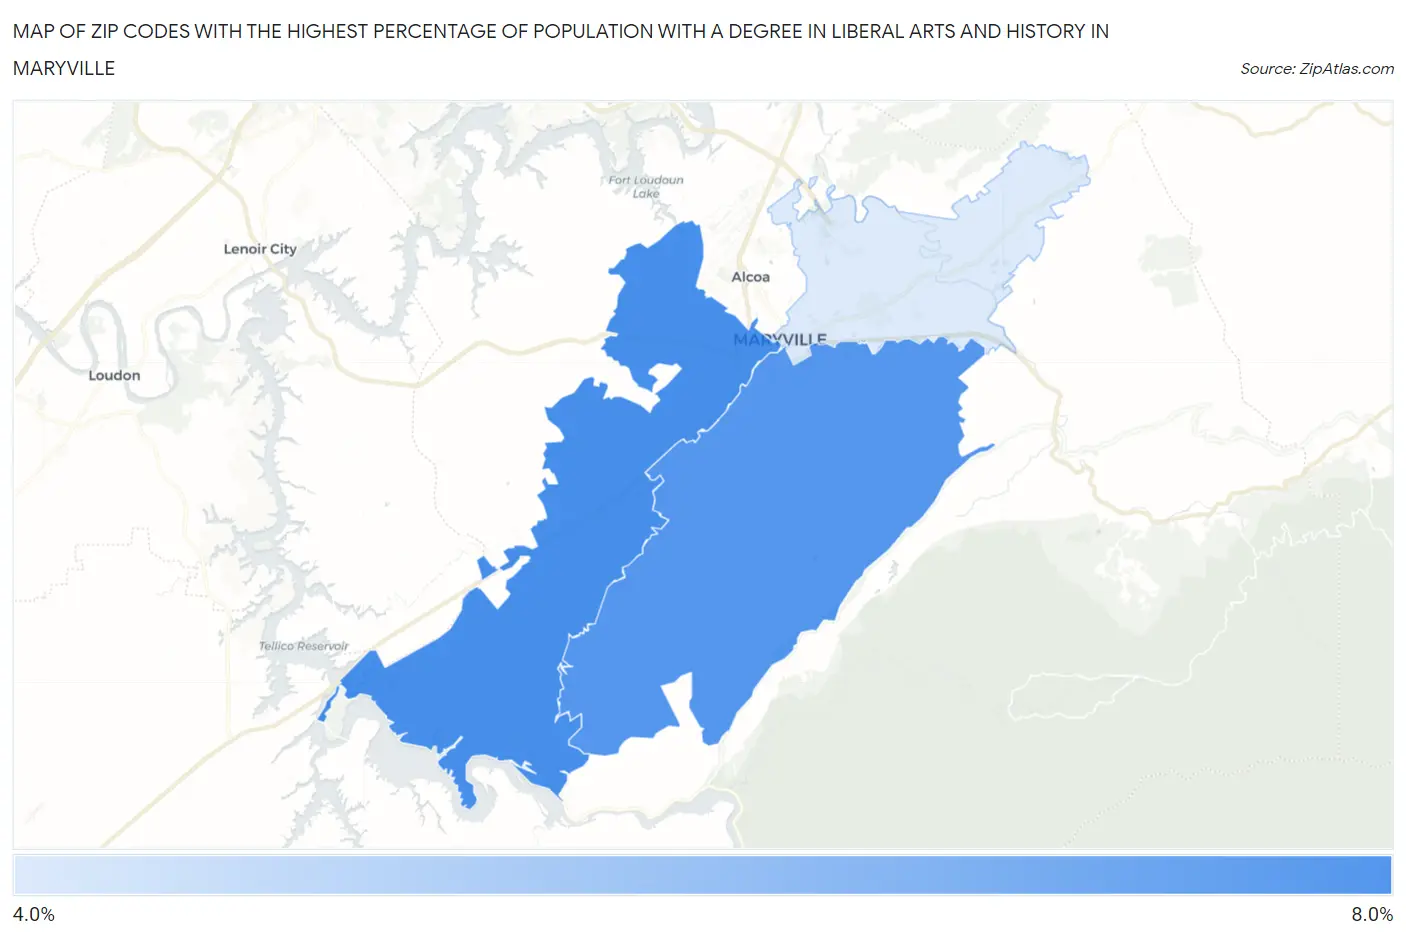
Map of Zip Codes with the Highest Percentage of Population with a Degree in Liberal Arts and History in Maryville
4.5%
6.0%
Zip Codes with the Highest Percentage of Population with a Degree in Liberal Arts and History in Maryville, TN
| Zip Code | % Graduates | vs State | vs National | |
| 1. | 37801 | 6.0% | 4.9%(+1.17)#169 | 4.9%(+1.17)#8,398 |
| 2. | 37803 | 5.9% | 4.9%(+1.02)#180 | 4.9%(+1.02)#8,783 |
| 3. | 37804 | 4.5% | 4.9%(-0.395)#260 | 4.9%(-0.388)#13,017 |
1
Common Questions
What are the Top Zip Codes with the Highest Percentage of Population with a Degree in Liberal Arts and History in Maryville, TN?
Top Zip Codes with the Highest Percentage of Population with a Degree in Liberal Arts and History in Maryville, TN are:
What zip code has the Highest Percentage of Population with a Degree in Liberal Arts and History in Maryville, TN?
37801 has the Highest Percentage of Population with a Degree in Liberal Arts and History in Maryville, TN with 6.0%.
What is the Percentage of Population with a Degree in Liberal Arts and History in Maryville, TN?
Percentage of Population with a Degree in Liberal Arts and History in Maryville is 4.9%.
What is the Percentage of Population with a Degree in Liberal Arts and History in Tennessee?
Percentage of Population with a Degree in Liberal Arts and History in Tennessee is 4.9%.
What is the Percentage of Population with a Degree in Liberal Arts and History in the United States?
Percentage of Population with a Degree in Liberal Arts and History in the United States is 4.9%.