Zip Codes with the Highest Percentage of Population Employed in Community & Social Service in Chattanooga, TN
RELATED REPORTS & OPTIONS
Community & Social Service
Chattanooga
Compare Zip Codes
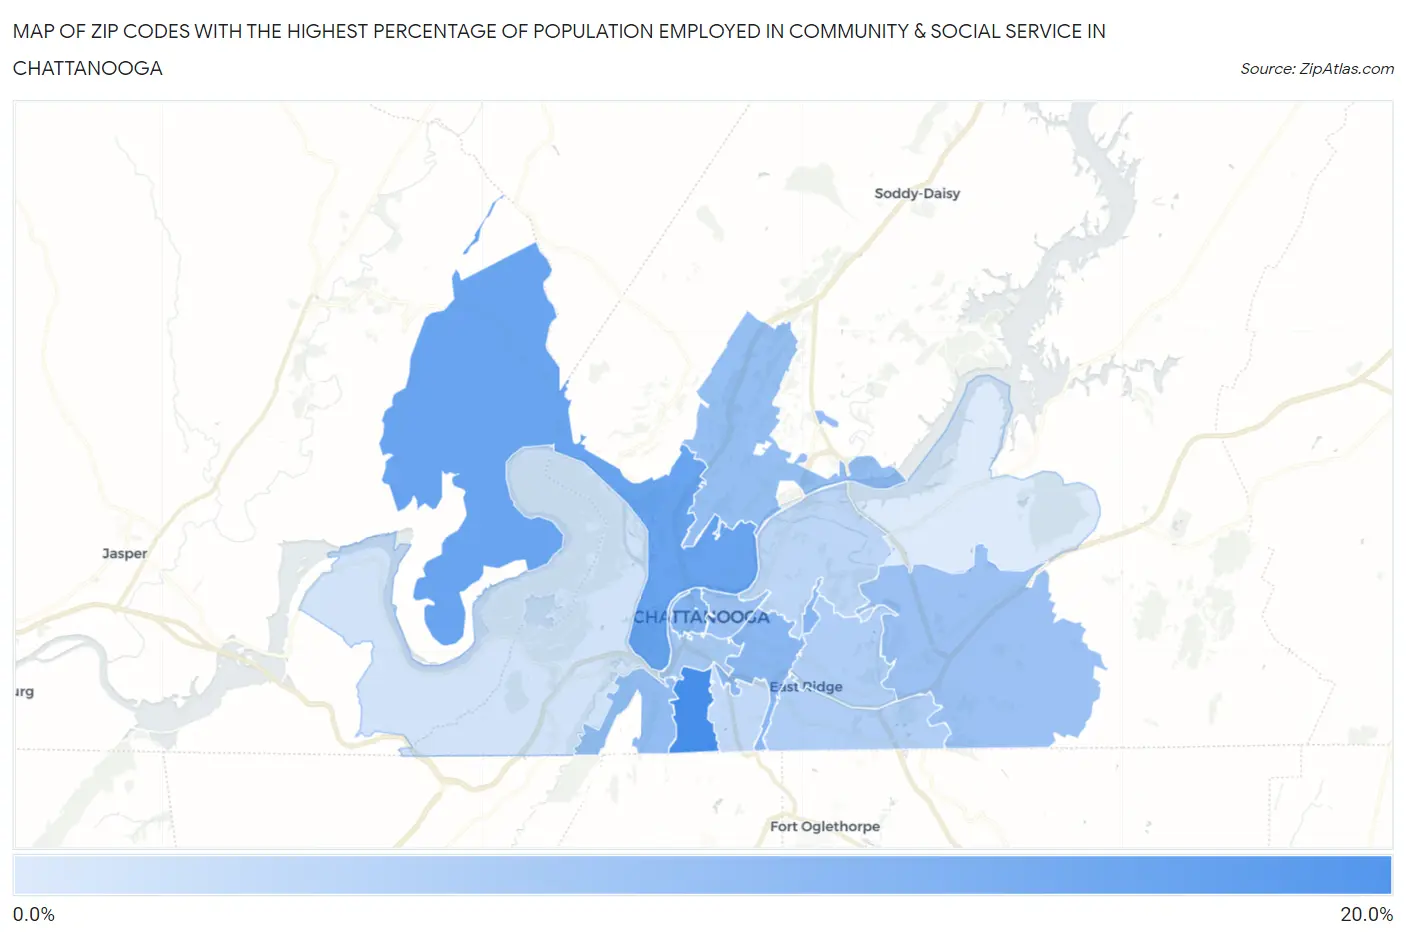
Map of Zip Codes with the Highest Percentage of Population Employed in Community & Social Service in Chattanooga
6.3%
19.1%
Zip Codes with the Highest Percentage of Population Employed in Community & Social Service in Chattanooga, TN
| Zip Code | % Employed | vs State | vs National | |
| 1. | 37410 | 19.1% | 10.4%(+8.72)#33 | 11.2%(+7.90)#2,346 |
| 2. | 37405 | 16.1% | 10.4%(+5.66)#54 | 11.2%(+4.84)#4,031 |
| 3. | 37402 | 13.5% | 10.4%(+3.11)#101 | 11.2%(+2.30)#6,731 |
| 4. | 37404 | 13.3% | 10.4%(+2.88)#107 | 11.2%(+2.06)#7,113 |
| 5. | 37409 | 12.5% | 10.4%(+2.07)#132 | 11.2%(+1.25)#8,484 |
| 6. | 37415 | 12.2% | 10.4%(+1.79)#138 | 11.2%(+0.970)#8,995 |
| 7. | 37403 | 11.9% | 10.4%(+1.48)#151 | 11.2%(+0.663)#9,608 |
| 8. | 37421 | 11.7% | 10.4%(+1.28)#159 | 11.2%(+0.466)#10,054 |
| 9. | 37408 | 10.7% | 10.4%(+0.260)#196 | 11.2%(-0.556)#12,494 |
| 10. | 37411 | 9.9% | 10.4%(-0.460)#239 | 11.2%(-1.28)#14,296 |
| 11. | 37412 | 9.9% | 10.4%(-0.541)#246 | 11.2%(-1.36)#14,514 |
| 12. | 37406 | 9.0% | 10.4%(-1.42)#286 | 11.2%(-2.23)#16,869 |
| 13. | 37407 | 8.5% | 10.4%(-1.93)#317 | 11.2%(-2.75)#18,262 |
| 14. | 37419 | 7.3% | 10.4%(-3.11)#399 | 11.2%(-3.93)#21,445 |
| 15. | 37416 | 6.3% | 10.4%(-4.13)#459 | 11.2%(-4.95)#23,798 |
1
Common Questions
What are the Top 10 Zip Codes with the Highest Percentage of Population Employed in Community & Social Service in Chattanooga, TN?
Top 10 Zip Codes with the Highest Percentage of Population Employed in Community & Social Service in Chattanooga, TN are:
What zip code has the Highest Percentage of Population Employed in Community & Social Service in Chattanooga, TN?
37410 has the Highest Percentage of Population Employed in Community & Social Service in Chattanooga, TN with 19.1%.
What is the Percentage of Population Employed in Community & Social Service in Chattanooga, TN?
Percentage of Population Employed in Community & Social Service in Chattanooga is 11.6%.
What is the Percentage of Population Employed in Community & Social Service in Tennessee?
Percentage of Population Employed in Community & Social Service in Tennessee is 10.4%.
What is the Percentage of Population Employed in Community & Social Service in the United States?
Percentage of Population Employed in Community & Social Service in the United States is 11.2%.