Zip Codes with the Highest Percentage of Population Employed in Computer, Engineering & Science in Chattanooga, TN
RELATED REPORTS & OPTIONS
Computer, Engineering & Science
Chattanooga
Compare Zip Codes
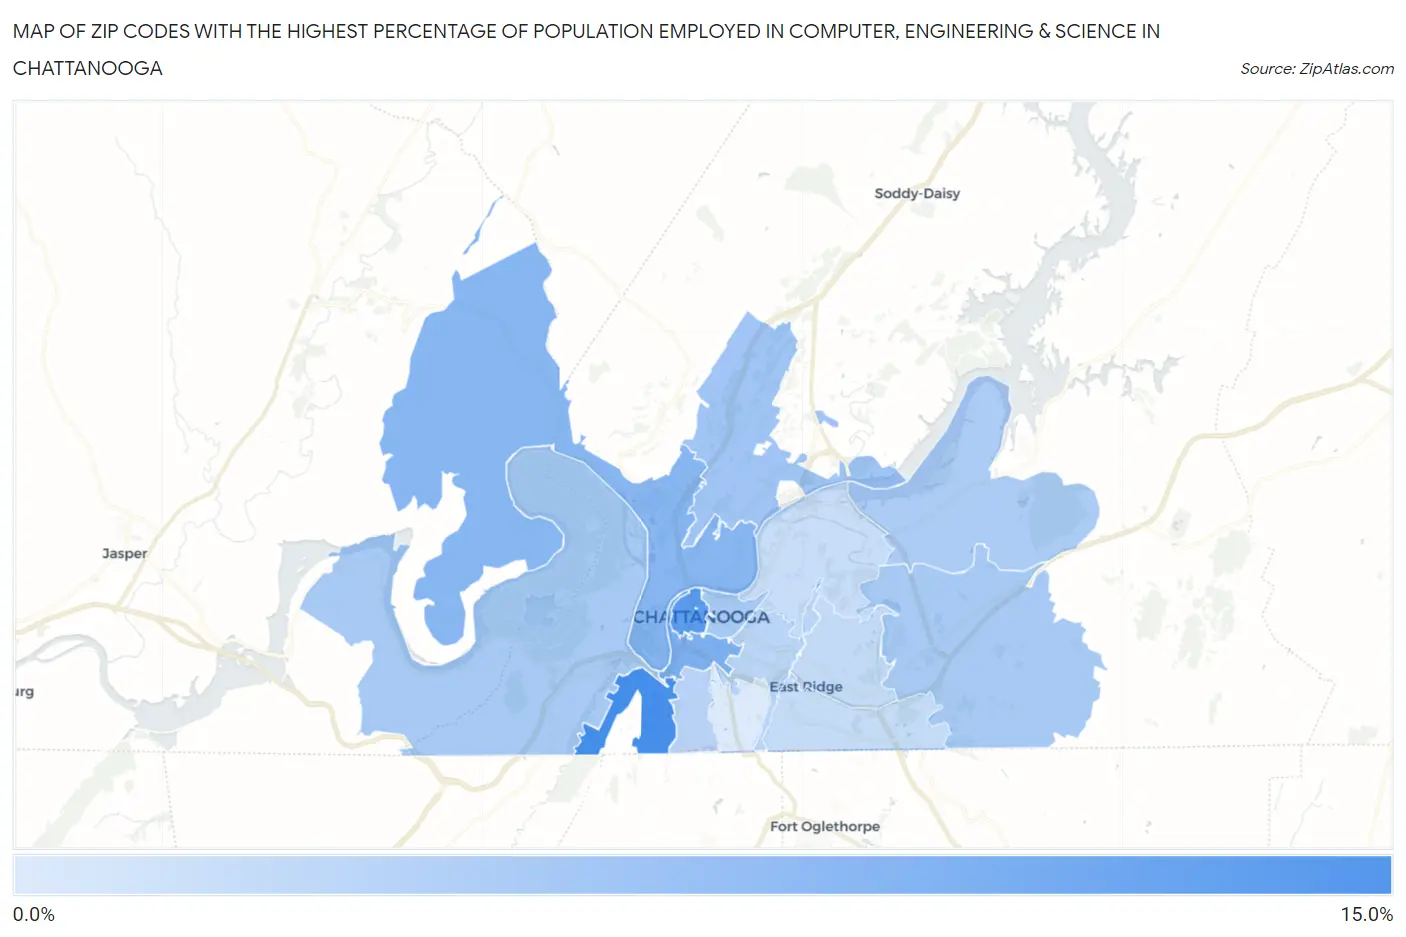
Map of Zip Codes with the Highest Percentage of Population Employed in Computer, Engineering & Science in Chattanooga
0.61%
14.8%
Zip Codes with the Highest Percentage of Population Employed in Computer, Engineering & Science in Chattanooga, TN
| Zip Code | % Employed | vs State | vs National | |
| 1. | 37409 | 14.8% | 5.1%(+9.71)#7 | 6.8%(+8.02)#1,155 |
| 2. | 37402 | 12.7% | 5.1%(+7.58)#14 | 6.8%(+5.90)#1,765 |
| 3. | 37408 | 9.4% | 5.1%(+4.36)#31 | 6.8%(+2.67)#3,653 |
| 4. | 37405 | 8.5% | 5.1%(+3.37)#50 | 6.8%(+1.69)#4,657 |
| 5. | 37415 | 6.1% | 5.1%(+0.981)#122 | 6.8%(-0.702)#8,677 |
| 6. | 37421 | 5.5% | 5.1%(+0.404)#147 | 6.8%(-1.28)#10,110 |
| 7. | 37403 | 5.5% | 5.1%(+0.373)#149 | 6.8%(-1.31)#10,168 |
| 8. | 37419 | 5.4% | 5.1%(+0.295)#155 | 6.8%(-1.39)#10,391 |
| 9. | 37416 | 4.9% | 5.1%(-0.134)#181 | 6.8%(-1.82)#11,528 |
| 10. | 37410 | 3.8% | 5.1%(-1.26)#257 | 6.8%(-2.94)#15,078 |
| 11. | 37404 | 3.7% | 5.1%(-1.38)#272 | 6.8%(-3.07)#15,472 |
| 12. | 37411 | 2.8% | 5.1%(-2.25)#341 | 6.8%(-3.94)#18,758 |
| 13. | 37412 | 2.7% | 5.1%(-2.37)#349 | 6.8%(-4.05)#19,183 |
| 14. | 37406 | 2.4% | 5.1%(-2.65)#378 | 6.8%(-4.33)#20,267 |
| 15. | 37407 | 0.61% | 5.1%(-4.47)#521 | 6.8%(-6.16)#25,999 |
1
Common Questions
What are the Top 10 Zip Codes with the Highest Percentage of Population Employed in Computer, Engineering & Science in Chattanooga, TN?
Top 10 Zip Codes with the Highest Percentage of Population Employed in Computer, Engineering & Science in Chattanooga, TN are:
What zip code has the Highest Percentage of Population Employed in Computer, Engineering & Science in Chattanooga, TN?
37409 has the Highest Percentage of Population Employed in Computer, Engineering & Science in Chattanooga, TN with 14.8%.
What is the Percentage of Population Employed in Computer, Engineering & Science in Chattanooga, TN?
Percentage of Population Employed in Computer, Engineering & Science in Chattanooga is 5.3%.
What is the Percentage of Population Employed in Computer, Engineering & Science in Tennessee?
Percentage of Population Employed in Computer, Engineering & Science in Tennessee is 5.1%.
What is the Percentage of Population Employed in Computer, Engineering & Science in the United States?
Percentage of Population Employed in Computer, Engineering & Science in the United States is 6.8%.