Zip Codes with the Highest Percentage of Population with a Degree in Visual and Performing Arts in Easley, SC
RELATED REPORTS & OPTIONS
Visual and Performing Arts
Easley
Compare Zip Codes
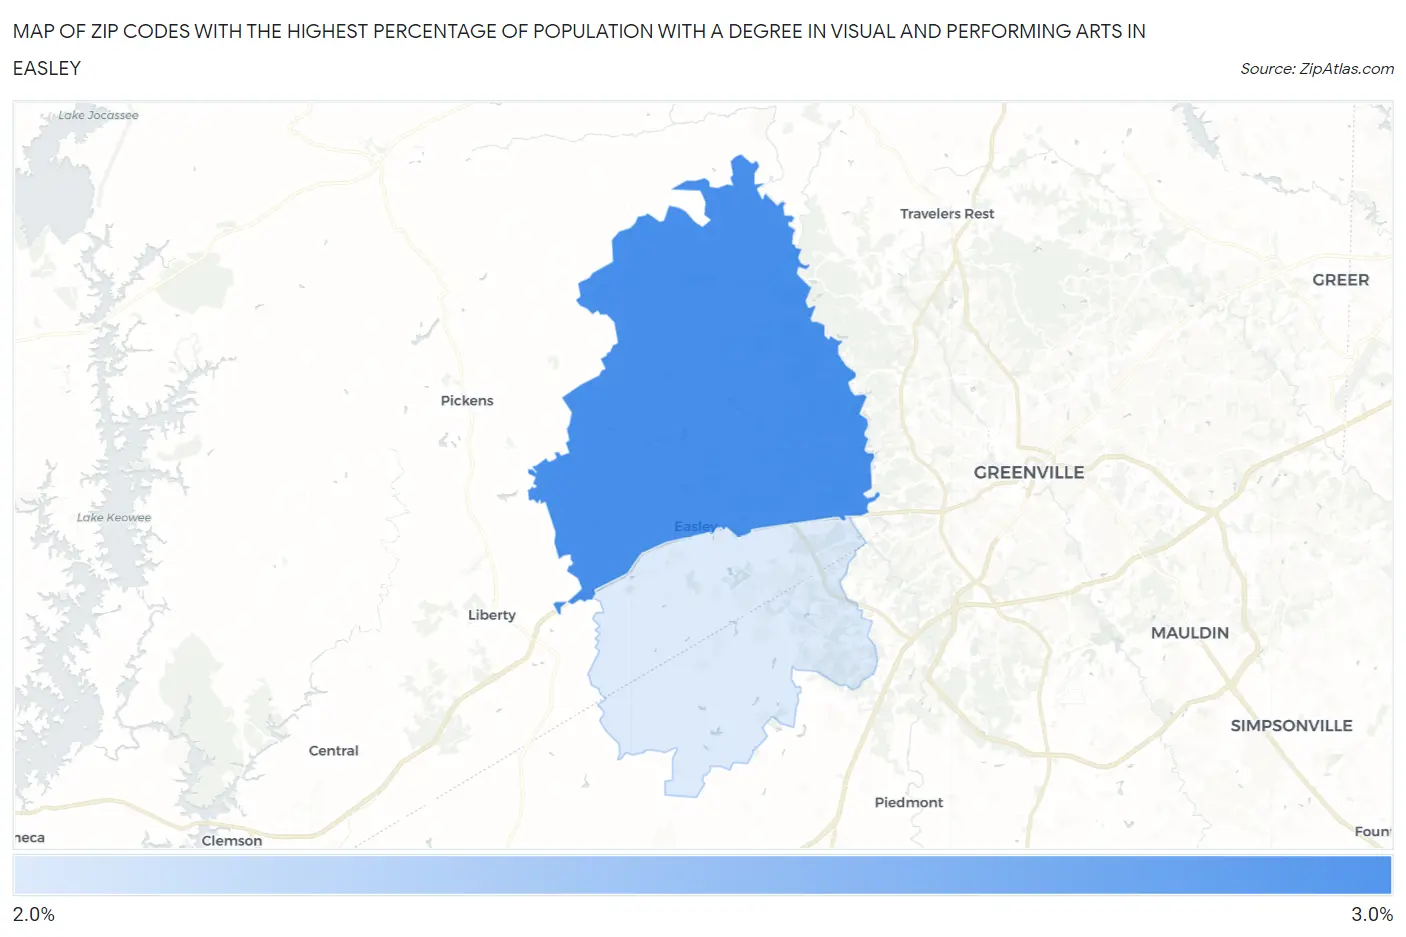
Map of Zip Codes with the Highest Percentage of Population with a Degree in Visual and Performing Arts in Easley
2.8%
2.9%
Zip Codes with the Highest Percentage of Population with a Degree in Visual and Performing Arts in Easley, SC
| Zip Code | % Graduates | vs State | vs National | |
| 1. | 29640 | 2.9% | 3.3%(-0.353)#143 | 4.3%(-1.34)#13,056 |
| 2. | 29642 | 2.8% | 3.3%(-0.440)#147 | 4.3%(-1.43)#13,395 |
1
Common Questions
What are the Top Zip Codes with the Highest Percentage of Population with a Degree in Visual and Performing Arts in Easley, SC?
Top Zip Codes with the Highest Percentage of Population with a Degree in Visual and Performing Arts in Easley, SC are:
What zip code has the Highest Percentage of Population with a Degree in Visual and Performing Arts in Easley, SC?
29640 has the Highest Percentage of Population with a Degree in Visual and Performing Arts in Easley, SC with 2.9%.
What is the Percentage of Population with a Degree in Visual and Performing Arts in Easley, SC?
Percentage of Population with a Degree in Visual and Performing Arts in Easley is 4.0%.
What is the Percentage of Population with a Degree in Visual and Performing Arts in South Carolina?
Percentage of Population with a Degree in Visual and Performing Arts in South Carolina is 3.3%.
What is the Percentage of Population with a Degree in Visual and Performing Arts in the United States?
Percentage of Population with a Degree in Visual and Performing Arts in the United States is 4.3%.