Zip Codes with the Highest Percentage of Population with a Degree in Visual and Performing Arts in Greenville, SC
RELATED REPORTS & OPTIONS
Visual and Performing Arts
Greenville
Compare Zip Codes
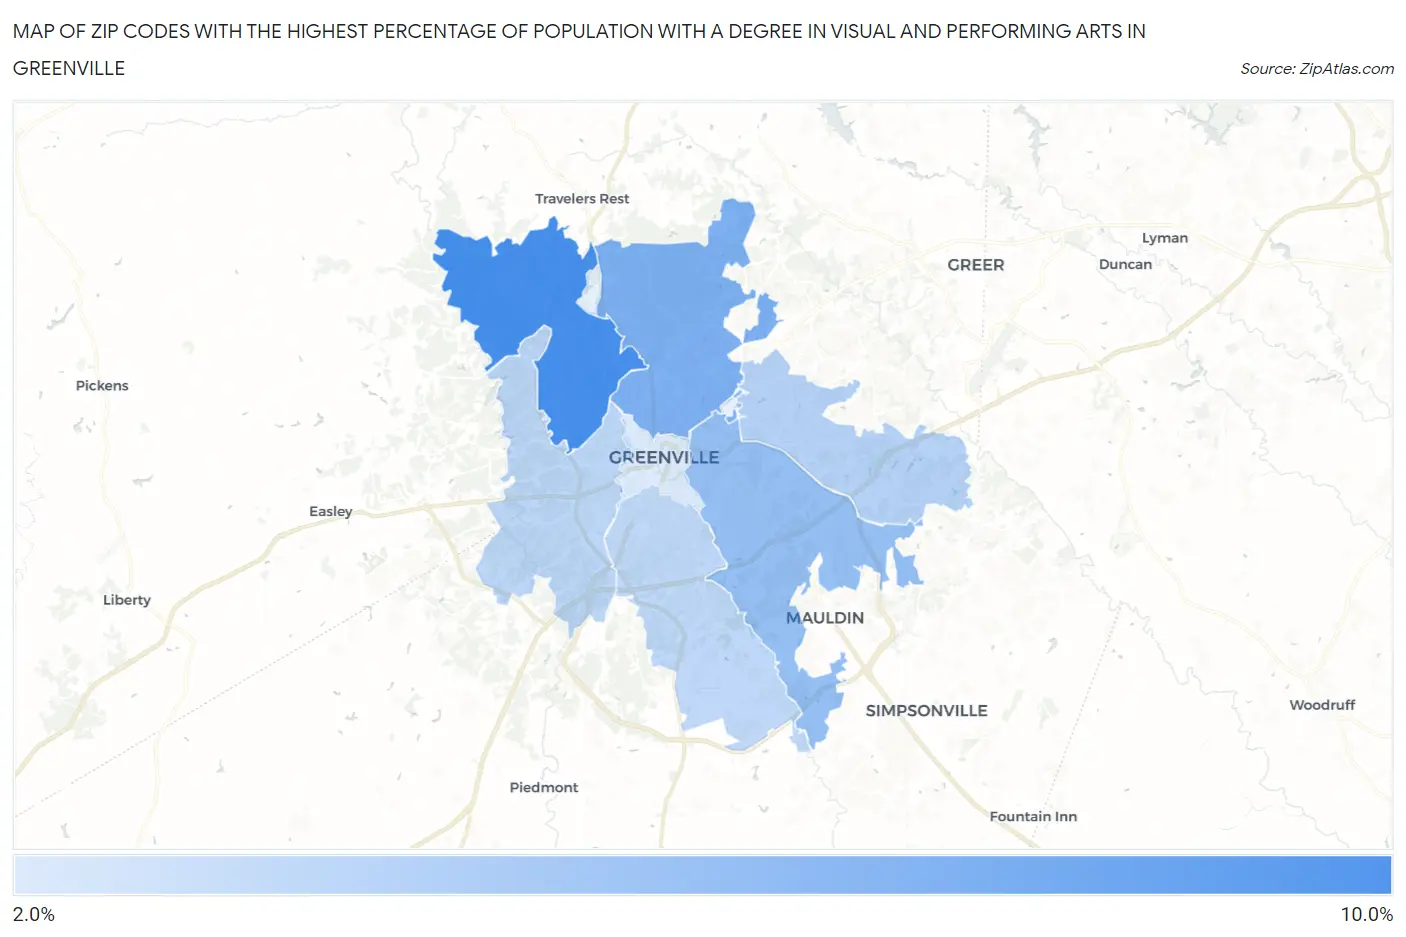
Map of Zip Codes with the Highest Percentage of Population with a Degree in Visual and Performing Arts in Greenville
2.2%
8.1%
Zip Codes with the Highest Percentage of Population with a Degree in Visual and Performing Arts in Greenville, SC
| Zip Code | % Graduates | vs State | vs National | |
| 1. | 29617 | 8.1% | 3.3%(+4.81)#20 | 4.3%(+3.82)#2,794 |
| 2. | 29609 | 5.9% | 3.3%(+2.59)#42 | 4.3%(+1.61)#5,085 |
| 3. | 29607 | 5.0% | 3.3%(+1.75)#57 | 4.3%(+0.760)#6,598 |
| 4. | 29615 | 3.7% | 3.3%(+0.467)#98 | 4.3%(-0.521)#10,056 |
| 5. | 29611 | 3.5% | 3.3%(+0.202)#102 | 4.3%(-0.787)#11,011 |
| 6. | 29605 | 3.3% | 3.3%(+0.073)#114 | 4.3%(-0.916)#11,467 |
| 7. | 29601 | 2.2% | 3.3%(-1.03)#183 | 4.3%(-2.02)#15,576 |
1
Common Questions
What are the Top 5 Zip Codes with the Highest Percentage of Population with a Degree in Visual and Performing Arts in Greenville, SC?
Top 5 Zip Codes with the Highest Percentage of Population with a Degree in Visual and Performing Arts in Greenville, SC are:
What zip code has the Highest Percentage of Population with a Degree in Visual and Performing Arts in Greenville, SC?
29617 has the Highest Percentage of Population with a Degree in Visual and Performing Arts in Greenville, SC with 8.1%.
What is the Percentage of Population with a Degree in Visual and Performing Arts in Greenville, SC?
Percentage of Population with a Degree in Visual and Performing Arts in Greenville is 4.5%.
What is the Percentage of Population with a Degree in Visual and Performing Arts in South Carolina?
Percentage of Population with a Degree in Visual and Performing Arts in South Carolina is 3.3%.
What is the Percentage of Population with a Degree in Visual and Performing Arts in the United States?
Percentage of Population with a Degree in Visual and Performing Arts in the United States is 4.3%.