Zip Codes with the Highest Percentage of Population Employed in Food Preparation & Serving in Sumter, SC
RELATED REPORTS & OPTIONS
Food Preparation & Serving
Sumter
Compare Zip Codes
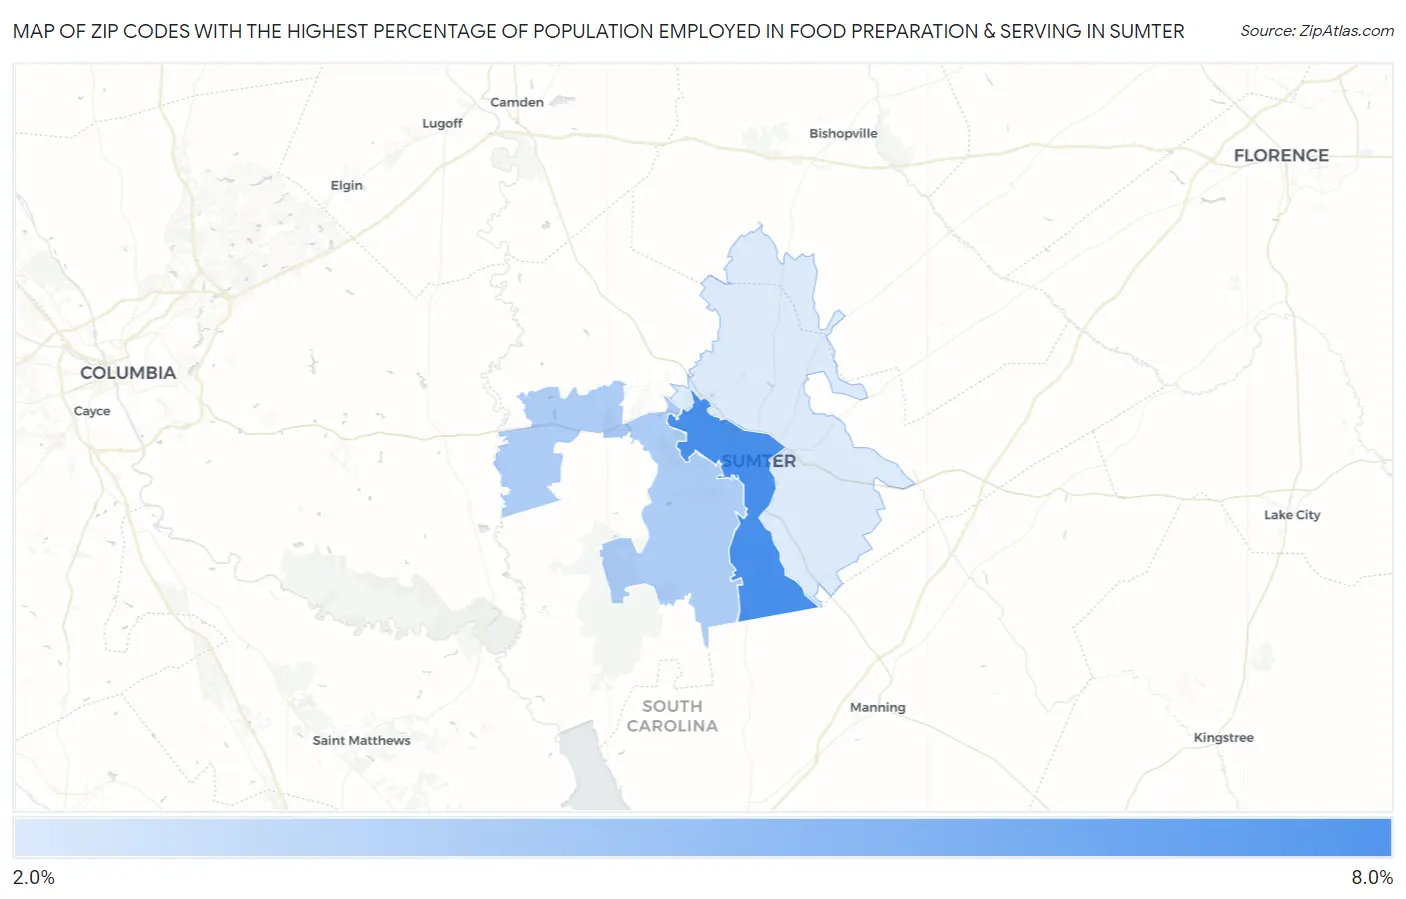
Map of Zip Codes with the Highest Percentage of Population Employed in Food Preparation & Serving in Sumter
2.9%
6.5%
Zip Codes with the Highest Percentage of Population Employed in Food Preparation & Serving in Sumter, SC
| Zip Code | % Employed | vs State | vs National | |
| 1. | 29150 | 6.5% | 5.8%(+0.763)#126 | 5.3%(+1.25)#7,789 |
| 2. | 29154 | 4.0% | 5.8%(-1.75)#247 | 5.3%(-1.27)#17,043 |
| 3. | 29153 | 2.9% | 5.8%(-2.91)#308 | 5.3%(-2.43)#21,818 |
1
Common Questions
What are the Top Zip Codes with the Highest Percentage of Population Employed in Food Preparation & Serving in Sumter, SC?
Top Zip Codes with the Highest Percentage of Population Employed in Food Preparation & Serving in Sumter, SC are:
What zip code has the Highest Percentage of Population Employed in Food Preparation & Serving in Sumter, SC?
29150 has the Highest Percentage of Population Employed in Food Preparation & Serving in Sumter, SC with 6.5%.
What is the Percentage of Population Employed in Food Preparation & Serving in Sumter, SC?
Percentage of Population Employed in Food Preparation & Serving in Sumter is 6.9%.
What is the Percentage of Population Employed in Food Preparation & Serving in South Carolina?
Percentage of Population Employed in Food Preparation & Serving in South Carolina is 5.8%.
What is the Percentage of Population Employed in Food Preparation & Serving in the United States?
Percentage of Population Employed in Food Preparation & Serving in the United States is 5.3%.