Zip Codes with the Highest Percentage of Population Employed in Food Preparation & Serving in North Augusta, SC
RELATED REPORTS & OPTIONS
Food Preparation & Serving
North Augusta
Compare Zip Codes
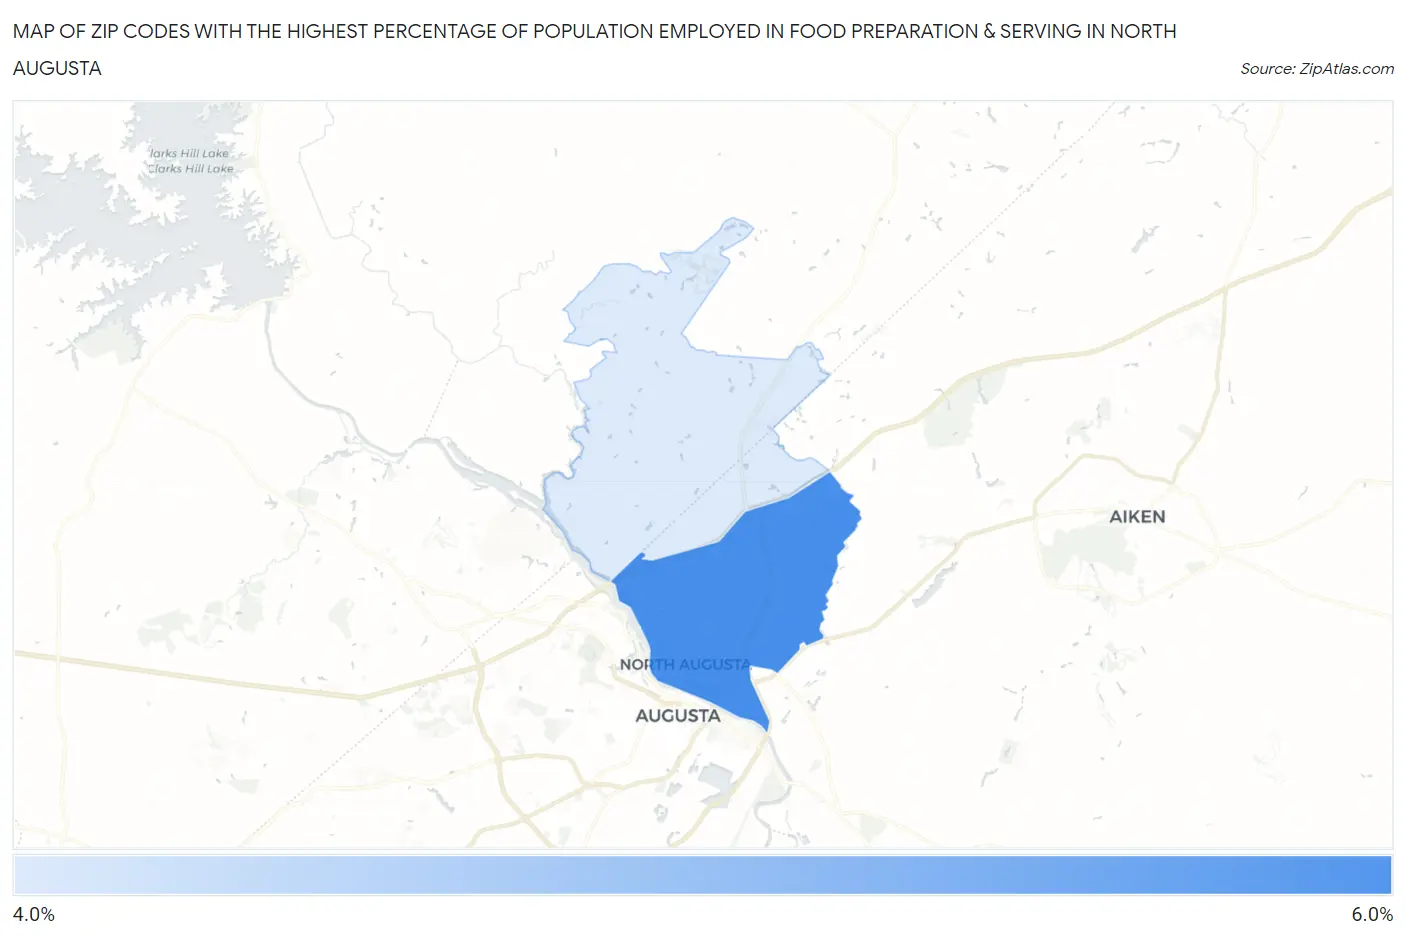
Map of Zip Codes with the Highest Percentage of Population Employed in Food Preparation & Serving in North Augusta
4.8%
5.5%
Zip Codes with the Highest Percentage of Population Employed in Food Preparation & Serving in North Augusta, SC
| Zip Code | % Employed | vs State | vs National | |
| 1. | 29841 | 5.5% | 5.8%(-0.316)#176 | 5.3%(+0.167)#11,209 |
| 2. | 29860 | 4.8% | 5.8%(-1.01)#202 | 5.3%(-0.527)#13,925 |
1
Common Questions
What are the Top Zip Codes with the Highest Percentage of Population Employed in Food Preparation & Serving in North Augusta, SC?
Top Zip Codes with the Highest Percentage of Population Employed in Food Preparation & Serving in North Augusta, SC are:
What zip code has the Highest Percentage of Population Employed in Food Preparation & Serving in North Augusta, SC?
29841 has the Highest Percentage of Population Employed in Food Preparation & Serving in North Augusta, SC with 5.5%.
What is the Percentage of Population Employed in Food Preparation & Serving in North Augusta, SC?
Percentage of Population Employed in Food Preparation & Serving in North Augusta is 4.3%.
What is the Percentage of Population Employed in Food Preparation & Serving in South Carolina?
Percentage of Population Employed in Food Preparation & Serving in South Carolina is 5.8%.
What is the Percentage of Population Employed in Food Preparation & Serving in the United States?
Percentage of Population Employed in Food Preparation & Serving in the United States is 5.3%.