Zip Codes with the Highest Percentage of Population Employed in Food Preparation & Serving in Gaffney, SC
RELATED REPORTS & OPTIONS
Food Preparation & Serving
Gaffney
Compare Zip Codes
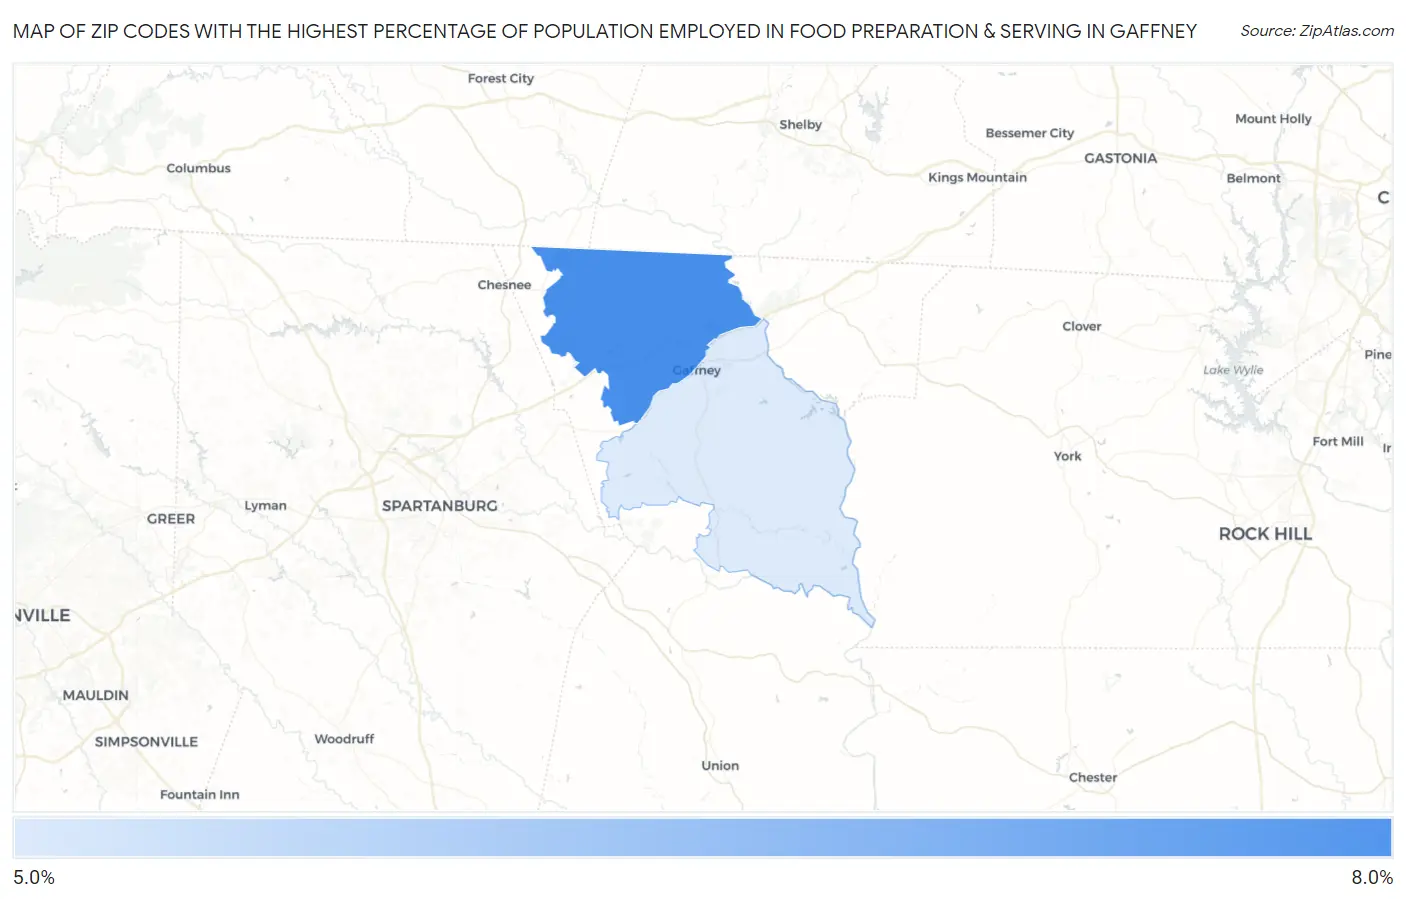
Map of Zip Codes with the Highest Percentage of Population Employed in Food Preparation & Serving in Gaffney
5.7%
8.0%
Zip Codes with the Highest Percentage of Population Employed in Food Preparation & Serving in Gaffney, SC
| Zip Code | % Employed | vs State | vs National | |
| 1. | 29341 | 8.0% | 5.8%(+2.19)#85 | 5.3%(+2.68)#4,782 |
| 2. | 29340 | 5.7% | 5.8%(-0.104)#168 | 5.3%(+0.379)#10,470 |
1
Common Questions
What are the Top Zip Codes with the Highest Percentage of Population Employed in Food Preparation & Serving in Gaffney, SC?
Top Zip Codes with the Highest Percentage of Population Employed in Food Preparation & Serving in Gaffney, SC are:
What zip code has the Highest Percentage of Population Employed in Food Preparation & Serving in Gaffney, SC?
29341 has the Highest Percentage of Population Employed in Food Preparation & Serving in Gaffney, SC with 8.0%.
What is the Percentage of Population Employed in Food Preparation & Serving in Gaffney, SC?
Percentage of Population Employed in Food Preparation & Serving in Gaffney is 5.4%.
What is the Percentage of Population Employed in Food Preparation & Serving in South Carolina?
Percentage of Population Employed in Food Preparation & Serving in South Carolina is 5.8%.
What is the Percentage of Population Employed in Food Preparation & Serving in the United States?
Percentage of Population Employed in Food Preparation & Serving in the United States is 5.3%.