Zip Codes with the Highest Percentage of Population Employed in Food Preparation & Serving in Guaynabo, PR
RELATED REPORTS & OPTIONS
Food Preparation & Serving
Guaynabo
Compare Zip Codes
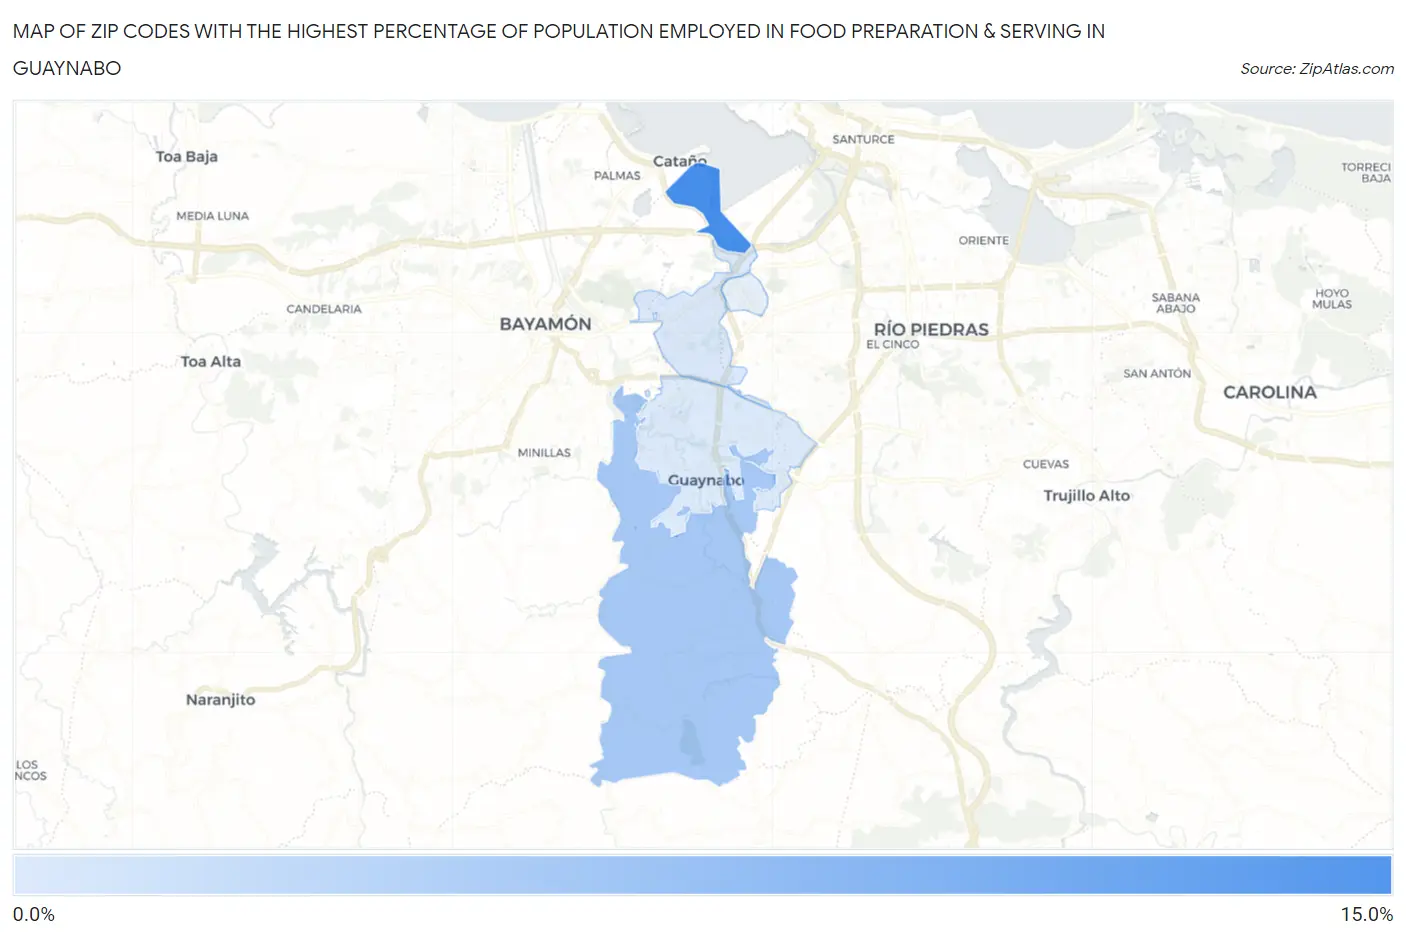
Map of Zip Codes with the Highest Percentage of Population Employed in Food Preparation & Serving in Guaynabo
2.3%
11.0%
Zip Codes with the Highest Percentage of Population Employed in Food Preparation & Serving in Guaynabo, PR
| Zip Code | % Employed | vs State | vs National | |
| 1. | 00965 | 11.0% | 5.7%(+5.33)#9 | 5.3%(+5.73)#2,052 |
| 2. | 00971 | 5.5% | 5.7%(-0.220)#73 | 5.3%(+0.178)#11,169 |
| 3. | 00966 | 2.4% | 5.7%(-3.27)#121 | 5.3%(-2.87)#23,414 |
| 4. | 00969 | 2.3% | 5.7%(-3.36)#122 | 5.3%(-2.97)#23,716 |
1
Common Questions
What are the Top 3 Zip Codes with the Highest Percentage of Population Employed in Food Preparation & Serving in Guaynabo, PR?
Top 3 Zip Codes with the Highest Percentage of Population Employed in Food Preparation & Serving in Guaynabo, PR are:
What zip code has the Highest Percentage of Population Employed in Food Preparation & Serving in Guaynabo, PR?
00965 has the Highest Percentage of Population Employed in Food Preparation & Serving in Guaynabo, PR with 11.0%.
What is the Percentage of Population Employed in Food Preparation & Serving in Guaynabo, PR?
Percentage of Population Employed in Food Preparation & Serving in Guaynabo is 3.4%.
What is the Percentage of Population Employed in Food Preparation & Serving in Puerto Rico?
Percentage of Population Employed in Food Preparation & Serving in Puerto Rico is 5.7%.
What is the Percentage of Population Employed in Food Preparation & Serving in the United States?
Percentage of Population Employed in Food Preparation & Serving in the United States is 5.3%.