Zip Codes with the Highest Percentage of Population Employed in Food Preparation & Serving in Carolina, PR
RELATED REPORTS & OPTIONS
Food Preparation & Serving
Carolina
Compare Zip Codes
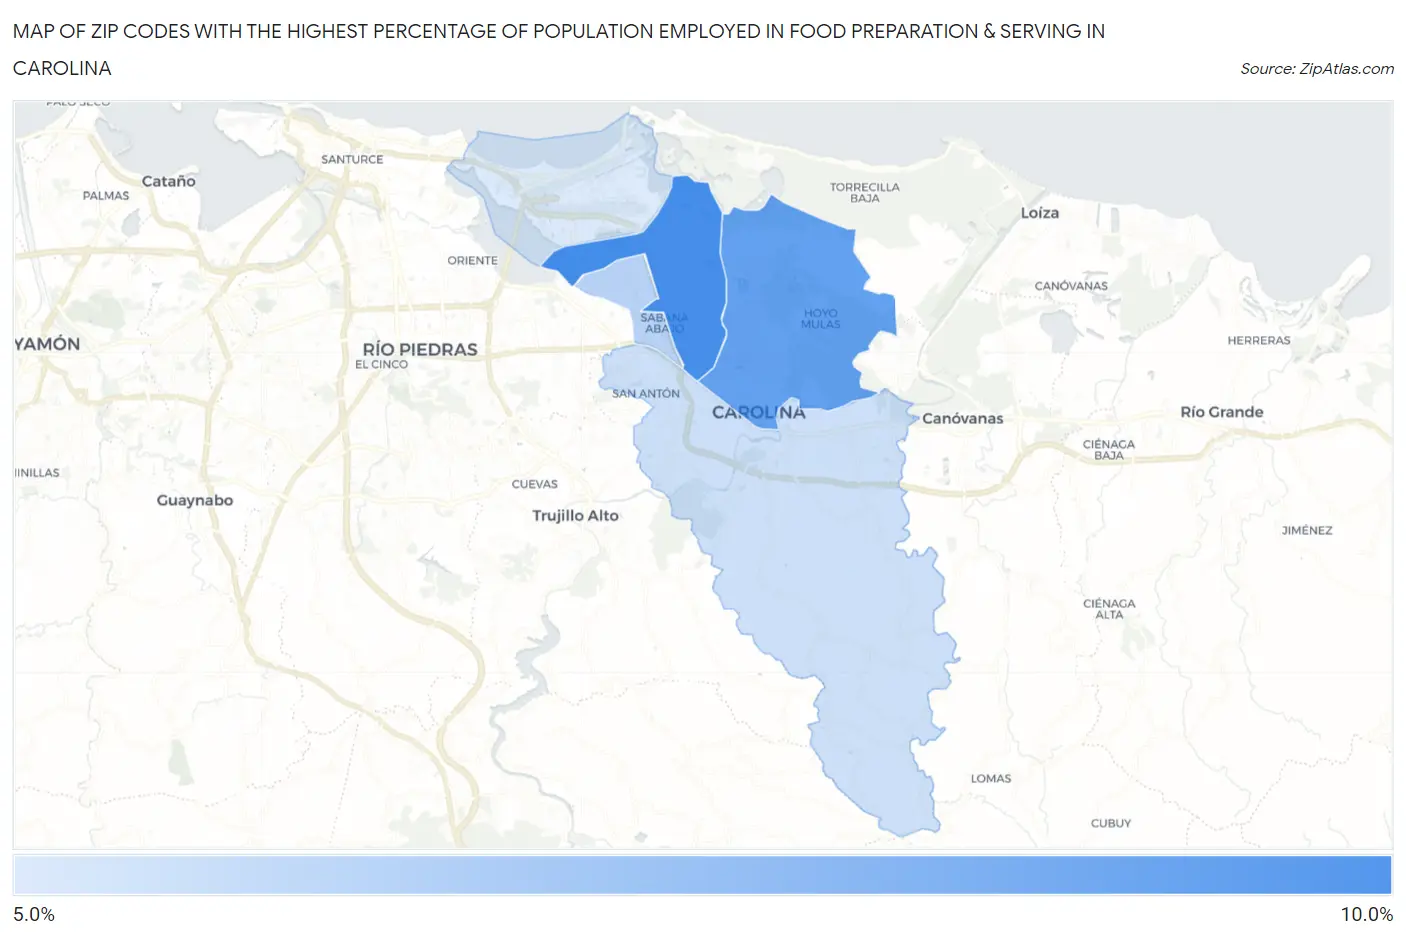
Map of Zip Codes with the Highest Percentage of Population Employed in Food Preparation & Serving in Carolina
6.0%
9.4%
Zip Codes with the Highest Percentage of Population Employed in Food Preparation & Serving in Carolina, PR
| Zip Code | % Employed | vs State | vs National | |
| 1. | 00983 | 9.4% | 5.7%(+3.69)#15 | 5.3%(+4.09)#3,159 |
| 2. | 00985 | 8.8% | 5.7%(+3.08)#20 | 5.3%(+3.48)#3,768 |
| 3. | 00982 | 6.8% | 5.7%(+1.14)#41 | 5.3%(+1.54)#7,010 |
| 4. | 00987 | 6.4% | 5.7%(+0.667)#55 | 5.3%(+1.06)#8,276 |
| 5. | 00979 | 6.0% | 5.7%(+0.315)#60 | 5.3%(+0.712)#9,352 |
1
Common Questions
What are the Top 3 Zip Codes with the Highest Percentage of Population Employed in Food Preparation & Serving in Carolina, PR?
Top 3 Zip Codes with the Highest Percentage of Population Employed in Food Preparation & Serving in Carolina, PR are:
What zip code has the Highest Percentage of Population Employed in Food Preparation & Serving in Carolina, PR?
00983 has the Highest Percentage of Population Employed in Food Preparation & Serving in Carolina, PR with 9.4%.
What is the Percentage of Population Employed in Food Preparation & Serving in Carolina, PR?
Percentage of Population Employed in Food Preparation & Serving in Carolina is 7.7%.
What is the Percentage of Population Employed in Food Preparation & Serving in Puerto Rico?
Percentage of Population Employed in Food Preparation & Serving in Puerto Rico is 5.7%.
What is the Percentage of Population Employed in Food Preparation & Serving in the United States?
Percentage of Population Employed in Food Preparation & Serving in the United States is 5.3%.