Yuman vs Immigrants from Armenia Female Poverty Among 18-24 Year Olds
COMPARE
Yuman
Immigrants from Armenia
Female Poverty Among 18-24 Year Olds
Female Poverty Among 18-24 Year Olds Comparison
Yuman
Immigrants from Armenia
24.0%
FEMALE POVERTY AMONG 18-24 YEAR OLDS
0.0/ 100
METRIC RATING
312th/ 347
METRIC RANK
18.9%
FEMALE POVERTY AMONG 18-24 YEAR OLDS
99.2/ 100
METRIC RATING
85th/ 347
METRIC RANK
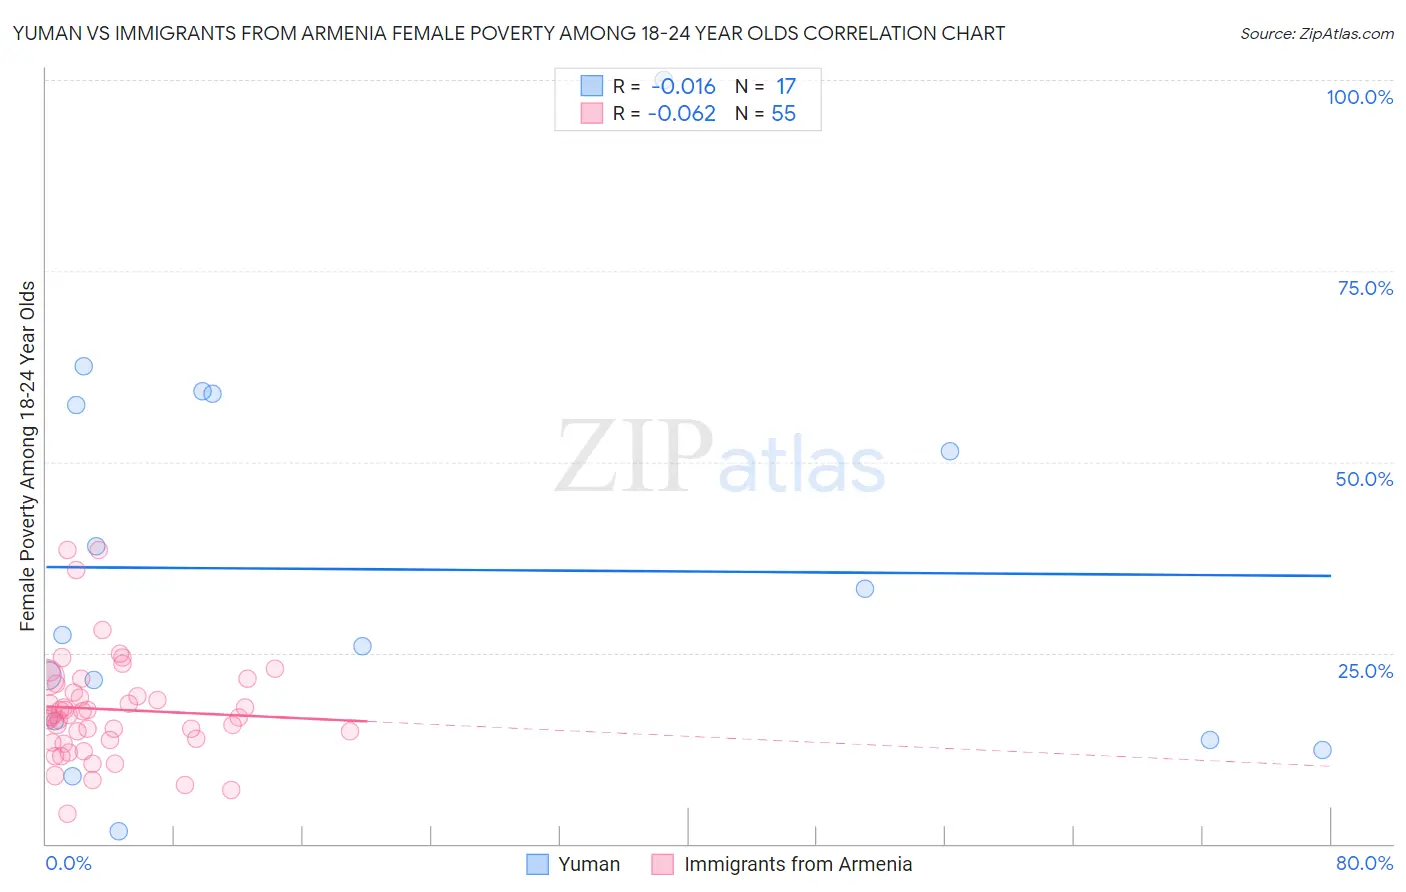
Yuman vs Immigrants from Armenia Female Poverty Among 18-24 Year Olds Correlation Chart
The statistical analysis conducted on geographies consisting of 40,585,448 people shows no correlation between the proportion of Yuman and poverty level among females between the ages 18 and 24 in the United States with a correlation coefficient (R) of -0.016 and weighted average of 24.0%. Similarly, the statistical analysis conducted on geographies consisting of 97,121,428 people shows a slight negative correlation between the proportion of Immigrants from Armenia and poverty level among females between the ages 18 and 24 in the United States with a correlation coefficient (R) of -0.062 and weighted average of 18.9%, a difference of 26.7%.
Female Poverty Among 18-24 Year Olds Correlation Summary
| Measurement | Yuman | Immigrants from Armenia |
| Minimum | 1.7% | 4.0% |
| Maximum | 100.0% | 38.5% |
| Range | 98.3% | 34.6% |
| Mean | 35.9% | 17.6% |
| Median | 27.4% | 16.8% |
| Interquartile 25% (IQ1) | 14.9% | 13.6% |
| Interquartile 75% (IQ3) | 58.2% | 20.9% |
| Interquartile Range (IQR) | 43.3% | 7.3% |
| Standard Deviation (Sample) | 25.7% | 6.9% |
| Standard Deviation (Population) | 24.9% | 6.8% |
Similar Demographics by Female Poverty Among 18-24 Year Olds
Demographics Similar to Yuman by Female Poverty Among 18-24 Year Olds
In terms of female poverty among 18-24 year olds, the demographic groups most similar to Yuman are Creek (24.2%, a difference of 1.1%), Potawatomi (23.7%, a difference of 1.2%), Choctaw (24.3%, a difference of 1.2%), Black/African American (24.3%, a difference of 1.4%), and Comanche (23.6%, a difference of 1.5%).
| Demographics | Rating | Rank | Female Poverty Among 18-24 Year Olds |
| Immigrants | Kuwait | 0.0 /100 | #305 | Tragic 23.0% |
| Paiute | 0.0 /100 | #306 | Tragic 23.3% |
| Cree | 0.0 /100 | #307 | Tragic 23.4% |
| Immigrants | Sudan | 0.0 /100 | #308 | Tragic 23.5% |
| Blackfeet | 0.0 /100 | #309 | Tragic 23.6% |
| Comanche | 0.0 /100 | #310 | Tragic 23.6% |
| Potawatomi | 0.0 /100 | #311 | Tragic 23.7% |
| Yuman | 0.0 /100 | #312 | Tragic 24.0% |
| Creek | 0.0 /100 | #313 | Tragic 24.2% |
| Choctaw | 0.0 /100 | #314 | Tragic 24.3% |
| Blacks/African Americans | 0.0 /100 | #315 | Tragic 24.3% |
| Alsatians | 0.0 /100 | #316 | Tragic 24.4% |
| Osage | 0.0 /100 | #317 | Tragic 24.5% |
| Chickasaw | 0.0 /100 | #318 | Tragic 24.5% |
| Dutch West Indians | 0.0 /100 | #319 | Tragic 24.5% |
Demographics Similar to Immigrants from Armenia by Female Poverty Among 18-24 Year Olds
In terms of female poverty among 18-24 year olds, the demographic groups most similar to Immigrants from Armenia are Burmese (18.9%, a difference of 0.030%), Immigrants from Iraq (18.9%, a difference of 0.070%), Immigrants from Jamaica (18.9%, a difference of 0.090%), Croatian (19.0%, a difference of 0.24%), and Immigrants from Cabo Verde (19.0%, a difference of 0.26%).
| Demographics | Rating | Rank | Female Poverty Among 18-24 Year Olds |
| Immigrants | Europe | 99.5 /100 | #78 | Exceptional 18.8% |
| Uruguayans | 99.5 /100 | #79 | Exceptional 18.8% |
| Palestinians | 99.5 /100 | #80 | Exceptional 18.8% |
| Japanese | 99.5 /100 | #81 | Exceptional 18.8% |
| Immigrants | Uruguay | 99.4 /100 | #82 | Exceptional 18.8% |
| Immigrants | Indonesia | 99.4 /100 | #83 | Exceptional 18.9% |
| Burmese | 99.2 /100 | #84 | Exceptional 18.9% |
| Immigrants | Armenia | 99.2 /100 | #85 | Exceptional 18.9% |
| Immigrants | Iraq | 99.2 /100 | #86 | Exceptional 18.9% |
| Immigrants | Jamaica | 99.2 /100 | #87 | Exceptional 18.9% |
| Croatians | 99.1 /100 | #88 | Exceptional 19.0% |
| Immigrants | Cabo Verde | 99.0 /100 | #89 | Exceptional 19.0% |
| Afghans | 99.0 /100 | #90 | Exceptional 19.0% |
| Romanians | 98.9 /100 | #91 | Exceptional 19.0% |
| Filipinos | 98.9 /100 | #92 | Exceptional 19.0% |