Immigrants from Cambodia vs Immigrants from Armenia Female Poverty Among 18-24 Year Olds

COMPARE

Immigrants from Cambodia
Race
Ancestry
AfghanAfricanAlaska NativeAlaskan AthabascanAlbanianAleutAlsatianAmericanApacheArabArapahoArgentineanArmenianAssyrian/Chaldean/SyriacAustralianAustrianBahamianBangladeshiBarbadianBasqueBelgianBelizeanBermudanBhutaneseBlackfeetBolivianBrazilianBritishBritish West IndianBulgarianBurmeseCajunCambodianCanadianCape VerdeanCarpatho RusynCelticCentral AmericanCentral American IndianCherokeeCheyenneChickasawChileanChineseChippewaChoctawColombianColvilleComancheCosta RicanCreeCreekCroatianCrowCubanCypriotCzechCzechoslovakianDanishDelawareDominicanDutchDutch West IndianEastern EuropeanEcuadorianEgyptianEnglishEstonianEthiopianEuropeanFijianFilipinoFinnishFrenchFrench American IndianFrench CanadianGermanGerman RussianGhanaianGreekGuamanian/ChamorroGuatemalanGuyaneseHaitianHmongHonduranHopiHoumaHungarianIcelanderIndian (Asian)IndonesianInupiatIranianIraqiIrishIroquoisIsraeliItalianJamaicanJapaneseJordanianKenyanKiowaKoreanLaotianLatvianLebaneseLiberianLithuanianLumbeeLuxembourgerMacedonianMalaysianMalteseMarshalleseMenomineeMexicanMexican American IndianMongolianMoroccanNative HawaiianNavajoNepaleseNew ZealanderNicaraguanNigerianNorthern EuropeanNorwegianOkinawanOsageOttawaPaiutePakistaniPalestinianPanamanianParaguayanPennsylvania GermanPeruvianPimaPolishPortuguesePotawatomiPuebloPuerto RicanPuget Sound SalishRomanianRussianSalvadoranSamoanScandinavianScotch-IrishScottishSeminoleSenegaleseSerbianShoshoneSierra LeoneanSiouxSlavicSlovakSloveneSomaliSouth AfricanSouth AmericanSouth American IndianSoviet UnionSpaniardSpanishSpanish AmericanSpanish American IndianSri LankanSubsaharan AfricanSudaneseSwedishSwissSyrianTaiwaneseThaiTlingit-HaidaTohono O'OdhamTonganTrinidadian and TobagonianTsimshianTurkishU.S. Virgin IslanderUgandanUkrainianUruguayanUteVenezuelanVietnameseWelshWest IndianYakamaYaquiYugoslavianYumanYup'ikZimbabwean
Immigration
NonimmigrantsImmigrantsAfghanistanAfricaAlbaniaArgentinaAsiaAustraliaAustriaBahamasBangladeshBarbadosBelarusBelgiumBelizeBoliviaBosnia and HerzegovinaBrazilBulgariaBurma/MyanmarCabo VerdeCambodiaCameroonCanadaCaribbeanCentral AmericaChileChinaColombiaCongoCosta RicaCroatiaCubaCzechoslovakiaDenmarkDominicaDominican RepublicEastern AfricaEastern AsiaEastern EuropeEcuadorEgyptEl SalvadorEnglandEritreaEthiopiaEuropeFijiFranceGermanyGhanaGreeceGrenadaGuatemalaGuyanaHaitiHondurasHong KongHungaryIndiaIndonesiaIranIraqIrelandIsraelItalyJamaicaJapanJordanKazakhstanKenyaKoreaKuwaitLaosLatin AmericaLatviaLebanonLiberiaLithuaniaMalaysiaMexicoMicronesiaMiddle AfricaMoldovaMoroccoNepalNetherlandsNicaraguaNigeriaNorth AmericaNorth MacedoniaNorthern AfricaNorthern EuropeNorwayOceaniaPakistanPanamaPeruPhilippinesPolandPortugalRomaniaRussiaSaudi ArabiaScotlandSenegalSerbiaSierra LeoneSingaporeSomaliaSouth AfricaSouth AmericaSouth Central AsiaSouth Eastern AsiaSouthern EuropeSpainSri LankaSt. Vincent and the GrenadinesSudanSwedenSwitzerlandSyriaTaiwanThailandTrinidad and TobagoTurkeyUgandaUkraineUruguayUzbekistanVenezuelaVietnamWest IndiesWestern AfricaWestern AsiaWestern EuropeYemenZaireZimbabweAzores
Immigrants from Armenia
Race
Ancestry
AfghanAfricanAlaska NativeAlaskan AthabascanAlbanianAleutAlsatianAmericanApacheArabArapahoArgentineanArmenianAssyrian/Chaldean/SyriacAustralianAustrianBahamianBangladeshiBarbadianBasqueBelgianBelizeanBermudanBhutaneseBlackfeetBolivianBrazilianBritishBritish West IndianBulgarianBurmeseCajunCambodianCanadianCape VerdeanCarpatho RusynCelticCentral AmericanCentral American IndianCherokeeCheyenneChickasawChileanChineseChippewaChoctawColombianColvilleComancheCosta RicanCreeCreekCroatianCrowCubanCypriotCzechCzechoslovakianDanishDelawareDominicanDutchDutch West IndianEastern EuropeanEcuadorianEgyptianEnglishEstonianEthiopianEuropeanFijianFilipinoFinnishFrenchFrench American IndianFrench CanadianGermanGerman RussianGhanaianGreekGuamanian/ChamorroGuatemalanGuyaneseHaitianHmongHonduranHopiHoumaHungarianIcelanderIndian (Asian)IndonesianInupiatIranianIraqiIrishIroquoisIsraeliItalianJamaicanJapaneseJordanianKenyanKiowaKoreanLaotianLatvianLebaneseLiberianLithuanianLumbeeLuxembourgerMacedonianMalaysianMalteseMarshalleseMenomineeMexicanMexican American IndianMongolianMoroccanNative HawaiianNavajoNepaleseNew ZealanderNicaraguanNigerianNorthern EuropeanNorwegianOkinawanOsageOttawaPaiutePakistaniPalestinianPanamanianParaguayanPennsylvania GermanPeruvianPimaPolishPortuguesePotawatomiPuebloPuerto RicanPuget Sound SalishRomanianRussianSalvadoranSamoanScandinavianScotch-IrishScottishSeminoleSenegaleseSerbianShoshoneSierra LeoneanSiouxSlavicSlovakSloveneSomaliSouth AfricanSouth AmericanSouth American IndianSoviet UnionSpaniardSpanishSpanish AmericanSpanish American IndianSri LankanSubsaharan AfricanSudaneseSwedishSwissSyrianTaiwaneseThaiTlingit-HaidaTohono O'OdhamTonganTrinidadian and TobagonianTsimshianTurkishU.S. Virgin IslanderUgandanUkrainianUruguayanUteVenezuelanVietnameseWelshWest IndianYakamaYaquiYugoslavianYumanYup'ikZimbabwean
Immigration
NonimmigrantsImmigrantsAfghanistanAfricaAlbaniaArgentinaArmeniaAsiaAustraliaAustriaBahamasBangladeshBarbadosBelarusBelgiumBelizeBoliviaBosnia and HerzegovinaBrazilBulgariaBurma/MyanmarCabo VerdeCameroonCanadaCaribbeanCentral AmericaChileChinaColombiaCongoCosta RicaCroatiaCubaCzechoslovakiaDenmarkDominicaDominican RepublicEastern AfricaEastern AsiaEastern EuropeEcuadorEgyptEl SalvadorEnglandEritreaEthiopiaEuropeFijiFranceGermanyGhanaGreeceGrenadaGuatemalaGuyanaHaitiHondurasHong KongHungaryIndiaIndonesiaIranIraqIrelandIsraelItalyJamaicaJapanJordanKazakhstanKenyaKoreaKuwaitLaosLatin AmericaLatviaLebanonLiberiaLithuaniaMalaysiaMexicoMicronesiaMiddle AfricaMoldovaMoroccoNepalNetherlandsNicaraguaNigeriaNorth AmericaNorth MacedoniaNorthern AfricaNorthern EuropeNorwayOceaniaPakistanPanamaPeruPhilippinesPolandPortugalRomaniaRussiaSaudi ArabiaScotlandSenegalSerbiaSierra LeoneSingaporeSomaliaSouth AfricaSouth AmericaSouth Central AsiaSouth Eastern AsiaSouthern EuropeSpainSri LankaSt. Vincent and the GrenadinesSudanSwedenSwitzerlandSyriaTaiwanThailandTrinidad and TobagoTurkeyUgandaUkraineUruguayUzbekistanVenezuelaVietnamWest IndiesWestern AfricaWestern AsiaWestern EuropeYemenZaireZimbabweAzores
Female Poverty Among 18-24 Year Olds
Income
Poverty
Unemployment
Labor Participation
Family Structure
Vehicle Availability
Education Level
Disability

Female Poverty Among 18-24 Year Olds Comparison

Immigrants from Cambodia

Immigrants from Armenia

Exceptional
Exceptional
18.8%
FEMALE POVERTY AMONG 18-24 YEAR OLDS
99.5/ 100
METRIC RATING
76th/ 347
METRIC RANK
18.9%
FEMALE POVERTY AMONG 18-24 YEAR OLDS
99.2/ 100
METRIC RATING
85th/ 347
METRIC RANK

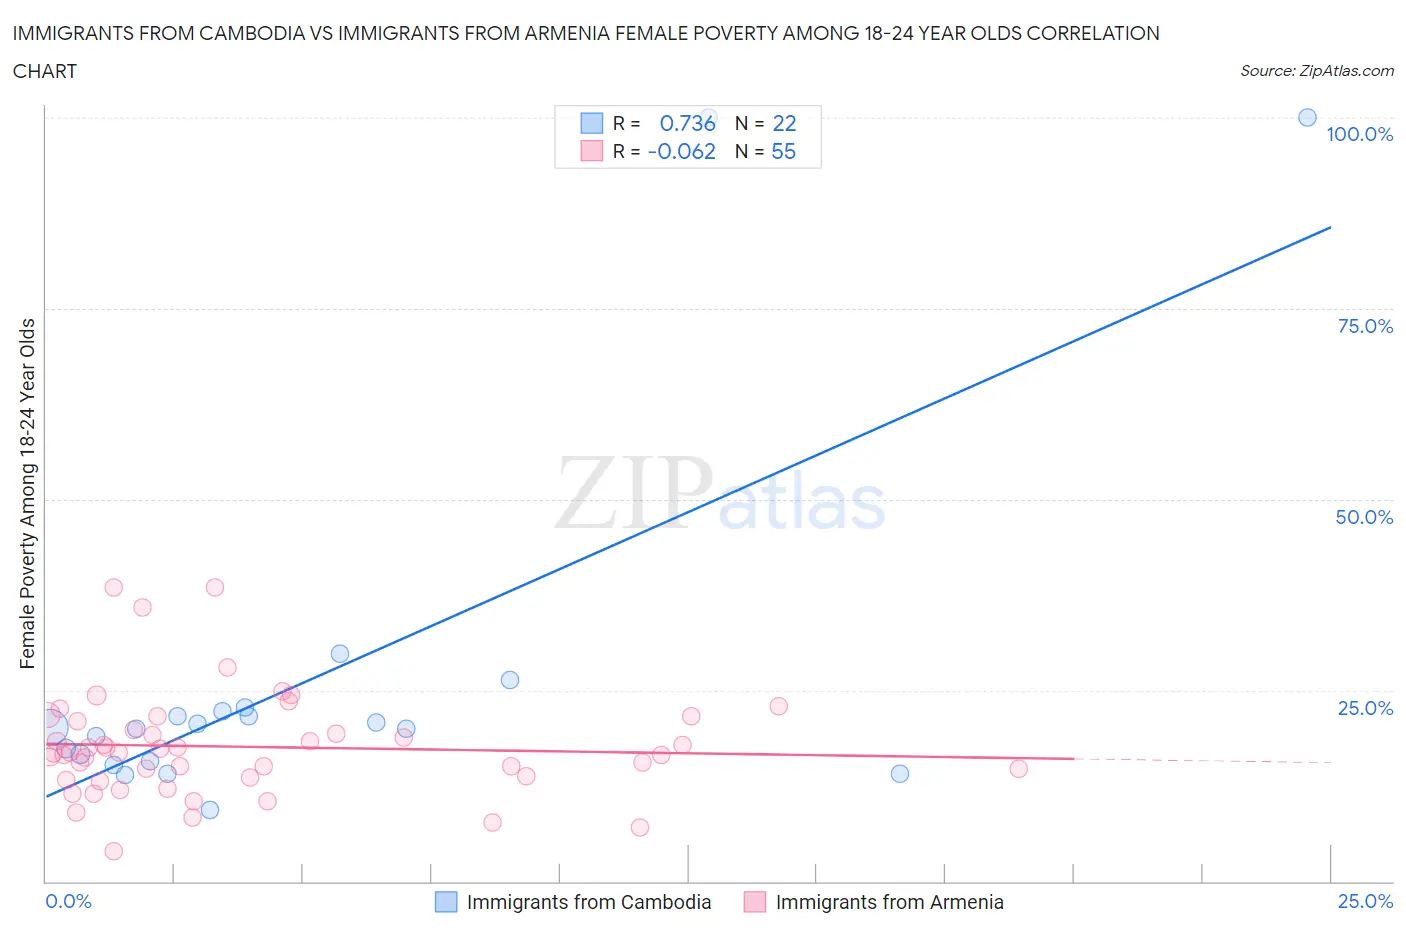
Immigrants from Cambodia vs Immigrants from Armenia Female Poverty Among 18-24 Year Olds Correlation Chart

The statistical analysis conducted on geographies consisting of 203,303,935 people shows a strong positive correlation between the proportion of Immigrants from Cambodia and poverty level among females between the ages 18 and 24 in the United States with a correlation coefficient (R) of 0.736 and weighted average of 18.8%. Similarly, the statistical analysis conducted on geographies consisting of 97,121,428 people shows a slight negative correlation between the proportion of Immigrants from Armenia and poverty level among females between the ages 18 and 24 in the United States with a correlation coefficient (R) of -0.062 and weighted average of 18.9%, a difference of 0.71%.
Immigrants from Cambodia vs Immigrants from Armenia Female Poverty Among 18-24 Year Olds

Female Poverty Among 18-24 Year Olds Correlation Summary

MeasurementImmigrants from CambodiaImmigrants from Armenia
Minimum9.3%4.0%
Maximum100.0%38.5%
Range90.7%34.6%
Mean26.4%17.6%
Median20.1%16.8%
Interquartile 25% (IQ1)15.8%13.6%
Interquartile 75% (IQ3)22.2%20.9%
Interquartile Range (IQR)6.4%7.3%
Standard Deviation (Sample)24.2%6.9%
Standard Deviation (Population)23.7%6.8%

Demographics Similar to Immigrants from Cambodia and Immigrants from Armenia by Female Poverty Among 18-24 Year Olds

In terms of female poverty among 18-24 year olds, the demographic groups most similar to Immigrants from Cambodia are Polish (18.8%, a difference of 0.080%), Costa Rican (18.8%, a difference of 0.10%), Immigrants from Europe (18.8%, a difference of 0.11%), Uruguayan (18.8%, a difference of 0.11%), and Palestinian (18.8%, a difference of 0.19%). Similarly, the demographic groups most similar to Immigrants from Armenia are Burmese (18.9%, a difference of 0.030%), Immigrants from Iraq (18.9%, a difference of 0.070%), Immigrants from Jamaica (18.9%, a difference of 0.090%), Croatian (19.0%, a difference of 0.24%), and Immigrants from Cabo Verde (19.0%, a difference of 0.26%).
DemographicsRating | RankFemale Poverty Among 18-24 Year Olds
Immigrants | Costa Rica
99.7
/100
|
#70
Exceptional
18.7%
Immigrants | Haiti
99.7
/100
|
#71
Exceptional
18.7%
Armenians
99.7
/100
|
#72
Exceptional
18.7%
Lithuanians
99.7
/100
|
#73
Exceptional
18.7%
Hawaiians
99.6
/100
|
#74
Exceptional
18.7%
Poles
99.6
/100
|
#75
Exceptional
18.8%
Immigrants | Cambodia
99.5
/100
|
#76
Exceptional
18.8%
Costa Ricans
99.5
/100
|
#77
Exceptional
18.8%
Immigrants | Europe
99.5
/100
|
#78
Exceptional
18.8%
Uruguayans
99.5
/100
|
#79
Exceptional
18.8%
Palestinians
99.5
/100
|
#80
Exceptional
18.8%
Japanese
99.5
/100
|
#81
Exceptional
18.8%
Immigrants | Uruguay
99.4
/100
|
#82
Exceptional
18.8%
Immigrants | Indonesia
99.4
/100
|
#83
Exceptional
18.9%
Burmese
99.2
/100
|
#84
Exceptional
18.9%
Immigrants | Armenia
99.2
/100
|
#85
Exceptional
18.9%
Immigrants | Iraq
99.2
/100
|
#86
Exceptional
18.9%
Immigrants | Jamaica
99.2
/100
|
#87
Exceptional
18.9%
Croatians
99.1
/100
|
#88
Exceptional
19.0%
Immigrants | Cabo Verde
99.0
/100
|
#89
Exceptional
19.0%
Afghans
99.0
/100
|
#90
Exceptional
19.0%