Yuman vs Hungarian Female Poverty Among 18-24 Year Olds
COMPARE
Yuman
Hungarian
Female Poverty Among 18-24 Year Olds
Female Poverty Among 18-24 Year Olds Comparison
Yuman
Hungarians
24.0%
FEMALE POVERTY AMONG 18-24 YEAR OLDS
0.0/ 100
METRIC RATING
312th/ 347
METRIC RANK
19.8%
FEMALE POVERTY AMONG 18-24 YEAR OLDS
76.6/ 100
METRIC RATING
155th/ 347
METRIC RANK
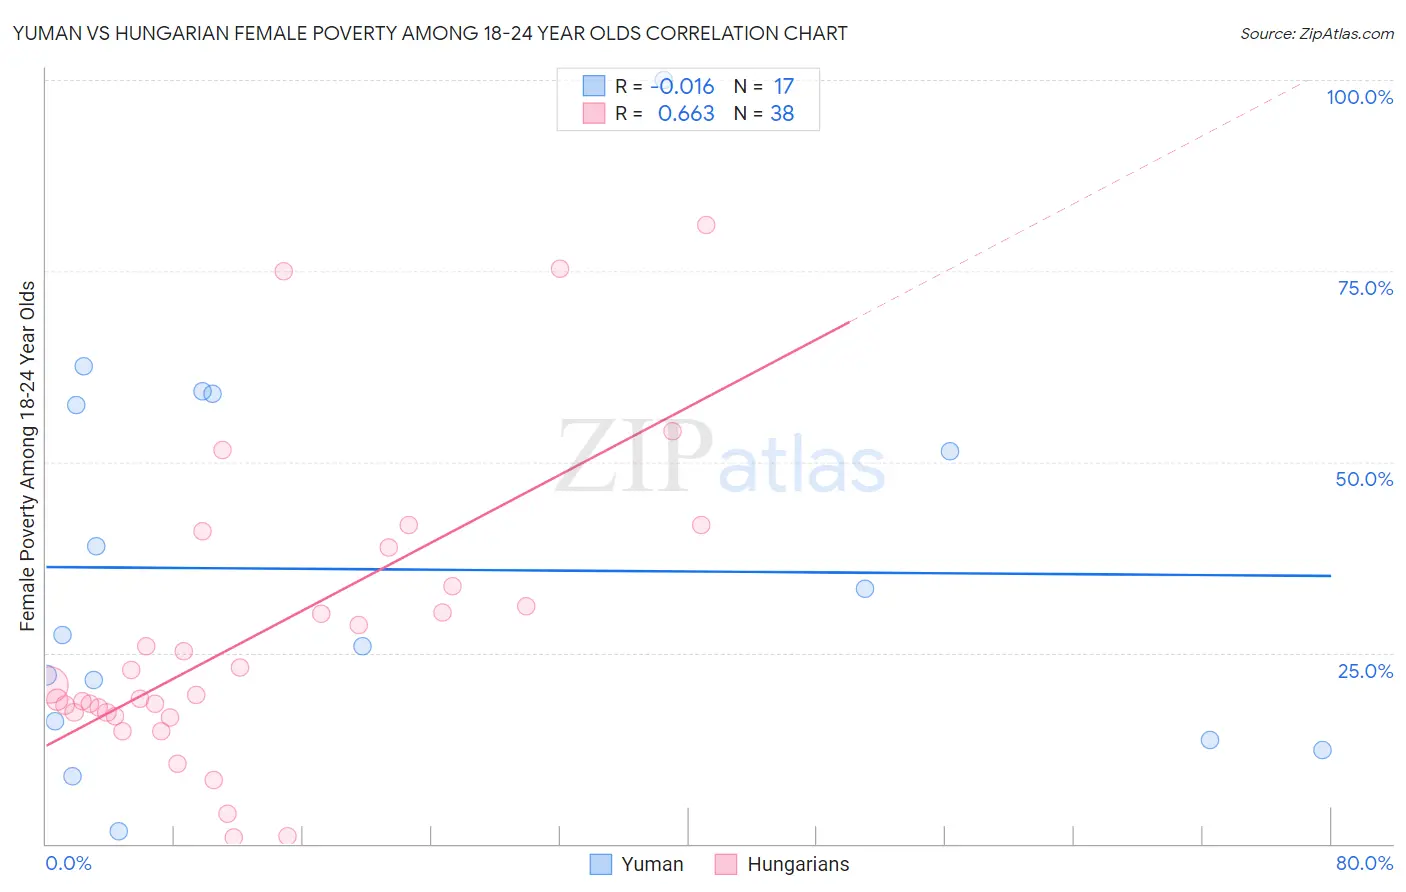
Yuman vs Hungarian Female Poverty Among 18-24 Year Olds Correlation Chart
The statistical analysis conducted on geographies consisting of 40,585,448 people shows no correlation between the proportion of Yuman and poverty level among females between the ages 18 and 24 in the United States with a correlation coefficient (R) of -0.016 and weighted average of 24.0%. Similarly, the statistical analysis conducted on geographies consisting of 465,185,254 people shows a significant positive correlation between the proportion of Hungarians and poverty level among females between the ages 18 and 24 in the United States with a correlation coefficient (R) of 0.663 and weighted average of 19.8%, a difference of 21.0%.
Female Poverty Among 18-24 Year Olds Correlation Summary
| Measurement | Yuman | Hungarian |
| Minimum | 1.7% | 0.77% |
| Maximum | 100.0% | 81.0% |
| Range | 98.3% | 80.3% |
| Mean | 35.9% | 27.4% |
| Median | 27.4% | 20.1% |
| Interquartile 25% (IQ1) | 14.9% | 17.1% |
| Interquartile 75% (IQ3) | 58.2% | 33.7% |
| Interquartile Range (IQR) | 43.3% | 16.5% |
| Standard Deviation (Sample) | 25.7% | 19.2% |
| Standard Deviation (Population) | 24.9% | 18.9% |
Similar Demographics by Female Poverty Among 18-24 Year Olds
Demographics Similar to Yuman by Female Poverty Among 18-24 Year Olds
In terms of female poverty among 18-24 year olds, the demographic groups most similar to Yuman are Creek (24.2%, a difference of 1.1%), Potawatomi (23.7%, a difference of 1.2%), Choctaw (24.3%, a difference of 1.2%), Black/African American (24.3%, a difference of 1.4%), and Comanche (23.6%, a difference of 1.5%).
| Demographics | Rating | Rank | Female Poverty Among 18-24 Year Olds |
| Immigrants | Kuwait | 0.0 /100 | #305 | Tragic 23.0% |
| Paiute | 0.0 /100 | #306 | Tragic 23.3% |
| Cree | 0.0 /100 | #307 | Tragic 23.4% |
| Immigrants | Sudan | 0.0 /100 | #308 | Tragic 23.5% |
| Blackfeet | 0.0 /100 | #309 | Tragic 23.6% |
| Comanche | 0.0 /100 | #310 | Tragic 23.6% |
| Potawatomi | 0.0 /100 | #311 | Tragic 23.7% |
| Yuman | 0.0 /100 | #312 | Tragic 24.0% |
| Creek | 0.0 /100 | #313 | Tragic 24.2% |
| Choctaw | 0.0 /100 | #314 | Tragic 24.3% |
| Blacks/African Americans | 0.0 /100 | #315 | Tragic 24.3% |
| Alsatians | 0.0 /100 | #316 | Tragic 24.4% |
| Osage | 0.0 /100 | #317 | Tragic 24.5% |
| Chickasaw | 0.0 /100 | #318 | Tragic 24.5% |
| Dutch West Indians | 0.0 /100 | #319 | Tragic 24.5% |
Demographics Similar to Hungarians by Female Poverty Among 18-24 Year Olds
In terms of female poverty among 18-24 year olds, the demographic groups most similar to Hungarians are Immigrants from Zimbabwe (19.8%, a difference of 0.0%), Immigrants from Belgium (19.8%, a difference of 0.010%), Danish (19.8%, a difference of 0.070%), Immigrants from Lebanon (19.8%, a difference of 0.090%), and Immigrants from Japan (19.8%, a difference of 0.11%).
| Demographics | Rating | Rank | Female Poverty Among 18-24 Year Olds |
| Immigrants | Latin America | 81.3 /100 | #148 | Excellent 19.7% |
| Immigrants | Oceania | 81.2 /100 | #149 | Excellent 19.7% |
| Syrians | 80.2 /100 | #150 | Excellent 19.8% |
| Immigrants | Eastern Asia | 79.7 /100 | #151 | Good 19.8% |
| Yugoslavians | 79.0 /100 | #152 | Good 19.8% |
| Immigrants | Japan | 78.1 /100 | #153 | Good 19.8% |
| Immigrants | Zimbabwe | 76.7 /100 | #154 | Good 19.8% |
| Hungarians | 76.6 /100 | #155 | Good 19.8% |
| Immigrants | Belgium | 76.4 /100 | #156 | Good 19.8% |
| Danes | 75.5 /100 | #157 | Good 19.8% |
| Immigrants | Lebanon | 75.3 /100 | #158 | Good 19.8% |
| Trinidadians and Tobagonians | 74.4 /100 | #159 | Good 19.8% |
| Pakistanis | 74.1 /100 | #160 | Good 19.8% |
| Immigrants | Belize | 74.1 /100 | #161 | Good 19.8% |
| French Canadians | 73.0 /100 | #162 | Good 19.9% |