Yakama vs Nigerian Family Poverty
COMPARE
Yakama
Nigerian
Family Poverty
Family Poverty Comparison
Yakama
Nigerians
13.1%
FAMILY POVERTY
0.0/ 100
METRIC RATING
327th/ 347
METRIC RANK
10.1%
FAMILY POVERTY
2.0/ 100
METRIC RATING
235th/ 347
METRIC RANK
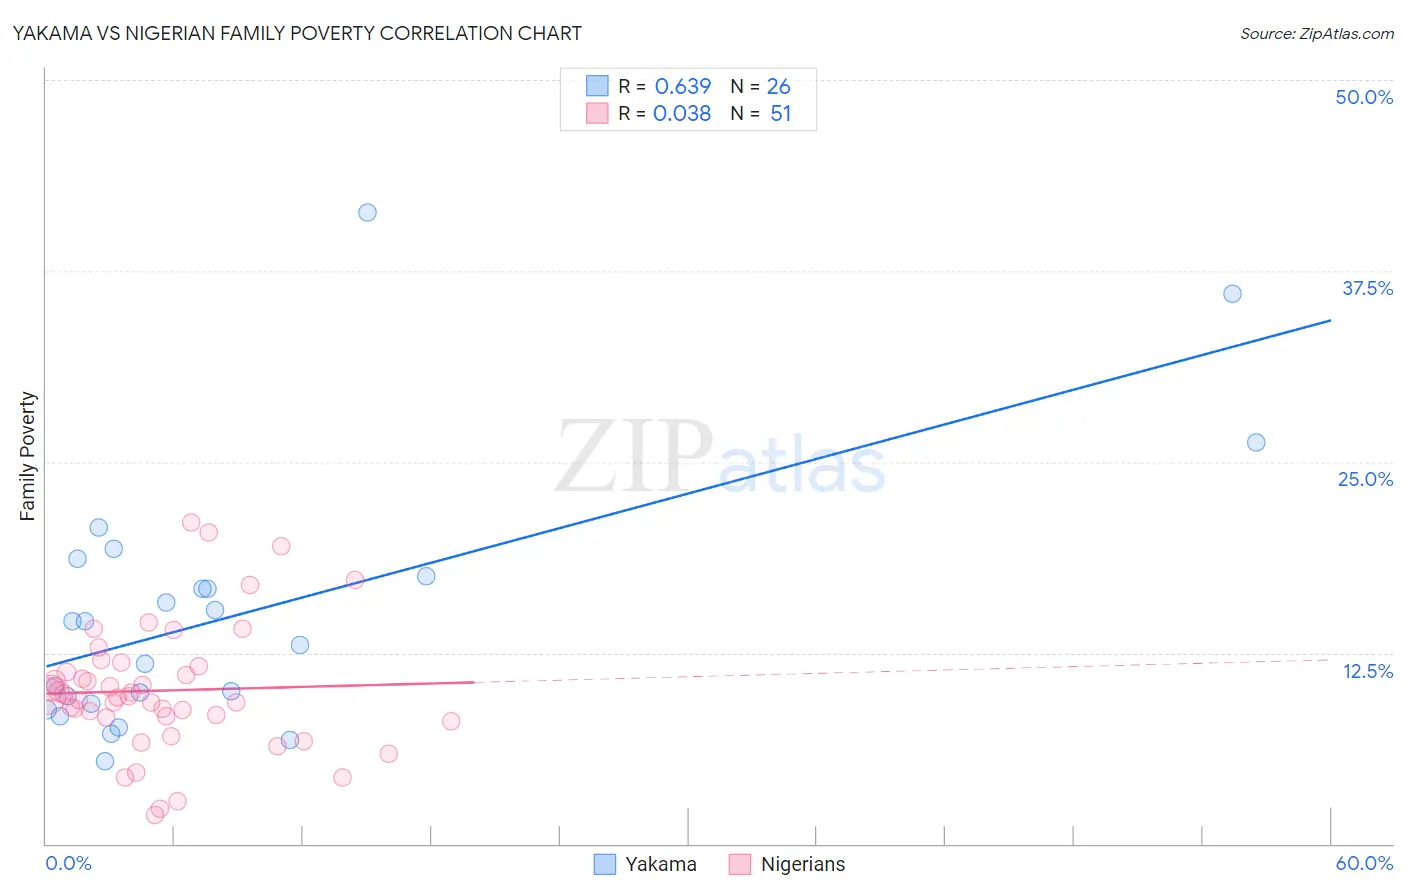
Yakama vs Nigerian Family Poverty Correlation Chart
The statistical analysis conducted on geographies consisting of 19,913,351 people shows a significant positive correlation between the proportion of Yakama and poverty level among families in the United States with a correlation coefficient (R) of 0.639 and weighted average of 13.1%. Similarly, the statistical analysis conducted on geographies consisting of 332,122,343 people shows no correlation between the proportion of Nigerians and poverty level among families in the United States with a correlation coefficient (R) of 0.038 and weighted average of 10.1%, a difference of 29.0%.
Family Poverty Correlation Summary
| Measurement | Yakama | Nigerian |
| Minimum | 5.4% | 1.9% |
| Maximum | 41.3% | 21.1% |
| Range | 35.9% | 19.2% |
| Mean | 15.1% | 10.0% |
| Median | 13.8% | 9.6% |
| Interquartile 25% (IQ1) | 9.1% | 8.3% |
| Interquartile 75% (IQ3) | 17.5% | 11.6% |
| Interquartile Range (IQR) | 8.4% | 3.4% |
| Standard Deviation (Sample) | 8.6% | 4.2% |
| Standard Deviation (Population) | 8.4% | 4.1% |
Similar Demographics by Family Poverty
Demographics Similar to Yakama by Family Poverty
In terms of family poverty, the demographic groups most similar to Yakama are Colville (13.0%, a difference of 0.68%), Paiute (13.0%, a difference of 0.75%), Central American Indian (13.3%, a difference of 1.7%), Black/African American (13.3%, a difference of 1.8%), and Immigrants from Dominica (12.7%, a difference of 2.7%).
| Demographics | Rating | Rank | Family Poverty |
| Inupiat | 0.0 /100 | #320 | Tragic 12.5% |
| Arapaho | 0.0 /100 | #321 | Tragic 12.7% |
| Immigrants | Honduras | 0.0 /100 | #322 | Tragic 12.7% |
| Menominee | 0.0 /100 | #323 | Tragic 12.7% |
| Immigrants | Dominica | 0.0 /100 | #324 | Tragic 12.7% |
| Paiute | 0.0 /100 | #325 | Tragic 13.0% |
| Colville | 0.0 /100 | #326 | Tragic 13.0% |
| Yakama | 0.0 /100 | #327 | Tragic 13.1% |
| Central American Indians | 0.0 /100 | #328 | Tragic 13.3% |
| Blacks/African Americans | 0.0 /100 | #329 | Tragic 13.3% |
| Natives/Alaskans | 0.0 /100 | #330 | Tragic 14.3% |
| Cheyenne | 0.0 /100 | #331 | Tragic 14.3% |
| Dominicans | 0.0 /100 | #332 | Tragic 14.3% |
| Immigrants | Dominican Republic | 0.0 /100 | #333 | Tragic 14.4% |
| Houma | 0.0 /100 | #334 | Tragic 14.6% |
Demographics Similar to Nigerians by Family Poverty
In terms of family poverty, the demographic groups most similar to Nigerians are Immigrants from Middle Africa (10.1%, a difference of 0.030%), Fijian (10.1%, a difference of 0.14%), Immigrants from Nigeria (10.2%, a difference of 0.25%), Immigrants from Sudan (10.1%, a difference of 0.39%), and Immigrants from Laos (10.2%, a difference of 0.51%).
| Demographics | Rating | Rank | Family Poverty |
| Sudanese | 3.1 /100 | #228 | Tragic 10.0% |
| Immigrants | Uzbekistan | 3.1 /100 | #229 | Tragic 10.0% |
| Immigrants | Panama | 3.1 /100 | #230 | Tragic 10.0% |
| Alaskan Athabascans | 2.7 /100 | #231 | Tragic 10.1% |
| Immigrants | Sudan | 2.3 /100 | #232 | Tragic 10.1% |
| Fijians | 2.1 /100 | #233 | Tragic 10.1% |
| Immigrants | Middle Africa | 2.1 /100 | #234 | Tragic 10.1% |
| Nigerians | 2.0 /100 | #235 | Tragic 10.1% |
| Immigrants | Nigeria | 1.9 /100 | #236 | Tragic 10.2% |
| Immigrants | Laos | 1.7 /100 | #237 | Tragic 10.2% |
| French American Indians | 1.5 /100 | #238 | Tragic 10.2% |
| Potawatomi | 1.5 /100 | #239 | Tragic 10.2% |
| Immigrants | Azores | 1.4 /100 | #240 | Tragic 10.3% |
| Ghanaians | 1.3 /100 | #241 | Tragic 10.3% |
| Alaska Natives | 1.0 /100 | #242 | Tragic 10.4% |