Yakama vs Immigrants from Western Europe Family Poverty
COMPARE
Yakama
Immigrants from Western Europe
Family Poverty
Family Poverty Comparison
Yakama
Immigrants from Western Europe
13.1%
FAMILY POVERTY
0.0/ 100
METRIC RATING
327th/ 347
METRIC RANK
8.2%
FAMILY POVERTY
92.9/ 100
METRIC RATING
118th/ 347
METRIC RANK
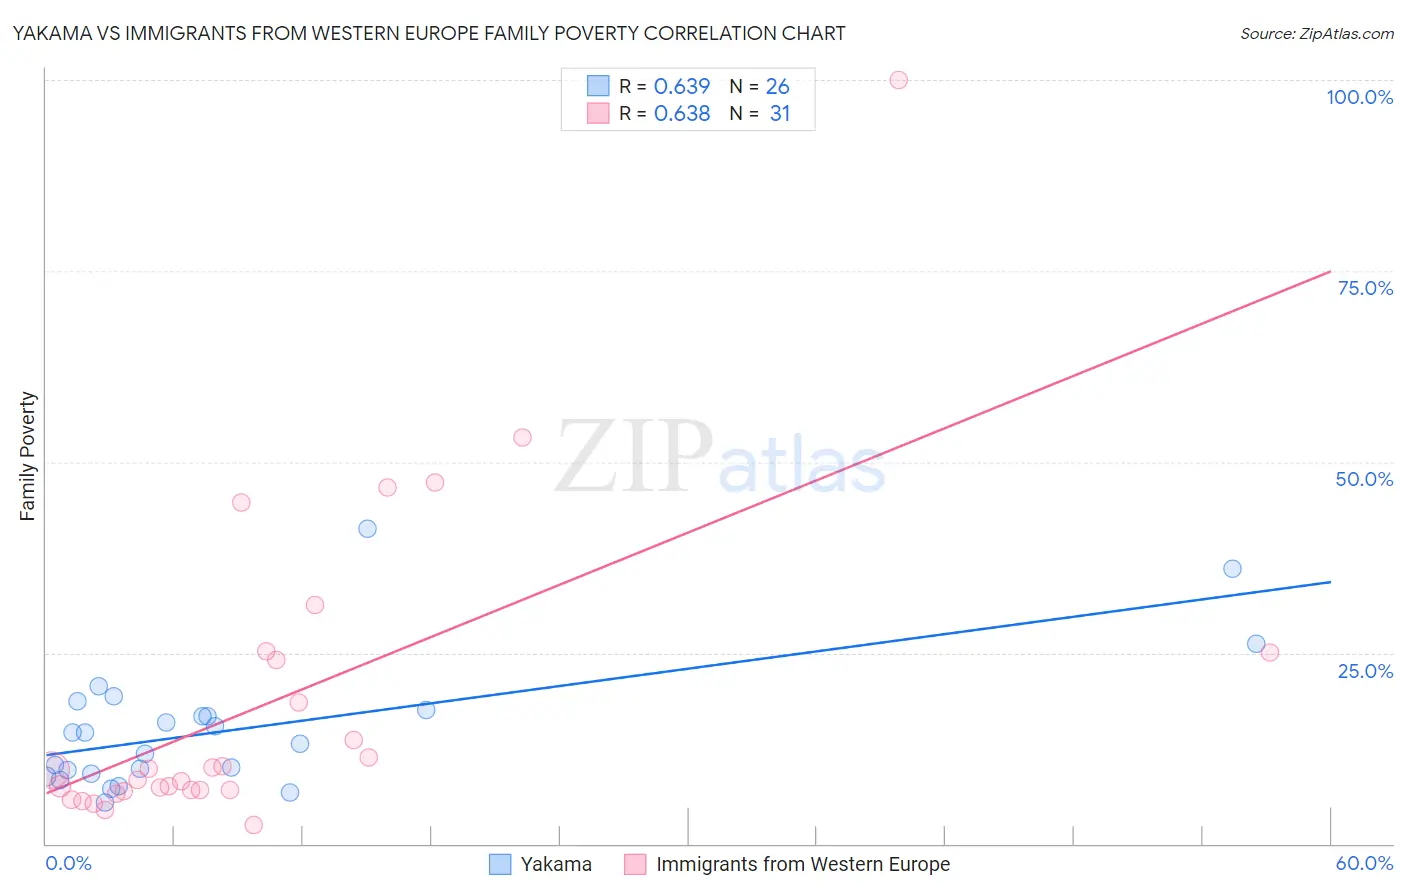
Yakama vs Immigrants from Western Europe Family Poverty Correlation Chart
The statistical analysis conducted on geographies consisting of 19,913,351 people shows a significant positive correlation between the proportion of Yakama and poverty level among families in the United States with a correlation coefficient (R) of 0.639 and weighted average of 13.1%. Similarly, the statistical analysis conducted on geographies consisting of 491,859,652 people shows a significant positive correlation between the proportion of Immigrants from Western Europe and poverty level among families in the United States with a correlation coefficient (R) of 0.638 and weighted average of 8.2%, a difference of 58.7%.
Family Poverty Correlation Summary
| Measurement | Yakama | Immigrants from Western Europe |
| Minimum | 5.4% | 2.5% |
| Maximum | 41.3% | 100.0% |
| Range | 35.9% | 97.5% |
| Mean | 15.1% | 18.6% |
| Median | 13.8% | 9.6% |
| Interquartile 25% (IQ1) | 9.1% | 7.0% |
| Interquartile 75% (IQ3) | 17.5% | 25.0% |
| Interquartile Range (IQR) | 8.4% | 18.0% |
| Standard Deviation (Sample) | 8.6% | 20.8% |
| Standard Deviation (Population) | 8.4% | 20.5% |
Similar Demographics by Family Poverty
Demographics Similar to Yakama by Family Poverty
In terms of family poverty, the demographic groups most similar to Yakama are Colville (13.0%, a difference of 0.68%), Paiute (13.0%, a difference of 0.75%), Central American Indian (13.3%, a difference of 1.7%), Black/African American (13.3%, a difference of 1.8%), and Immigrants from Dominica (12.7%, a difference of 2.7%).
| Demographics | Rating | Rank | Family Poverty |
| Inupiat | 0.0 /100 | #320 | Tragic 12.5% |
| Arapaho | 0.0 /100 | #321 | Tragic 12.7% |
| Immigrants | Honduras | 0.0 /100 | #322 | Tragic 12.7% |
| Menominee | 0.0 /100 | #323 | Tragic 12.7% |
| Immigrants | Dominica | 0.0 /100 | #324 | Tragic 12.7% |
| Paiute | 0.0 /100 | #325 | Tragic 13.0% |
| Colville | 0.0 /100 | #326 | Tragic 13.0% |
| Yakama | 0.0 /100 | #327 | Tragic 13.1% |
| Central American Indians | 0.0 /100 | #328 | Tragic 13.3% |
| Blacks/African Americans | 0.0 /100 | #329 | Tragic 13.3% |
| Natives/Alaskans | 0.0 /100 | #330 | Tragic 14.3% |
| Cheyenne | 0.0 /100 | #331 | Tragic 14.3% |
| Dominicans | 0.0 /100 | #332 | Tragic 14.3% |
| Immigrants | Dominican Republic | 0.0 /100 | #333 | Tragic 14.4% |
| Houma | 0.0 /100 | #334 | Tragic 14.6% |
Demographics Similar to Immigrants from Western Europe by Family Poverty
In terms of family poverty, the demographic groups most similar to Immigrants from Western Europe are French (8.3%, a difference of 0.070%), Immigrants from Russia (8.2%, a difference of 0.19%), South African (8.2%, a difference of 0.26%), Immigrants from Israel (8.2%, a difference of 0.32%), and Immigrants from Egypt (8.3%, a difference of 0.63%).
| Demographics | Rating | Rank | Family Poverty |
| Taiwanese | 94.6 /100 | #111 | Exceptional 8.2% |
| Immigrants | France | 94.4 /100 | #112 | Exceptional 8.2% |
| Canadians | 94.2 /100 | #113 | Exceptional 8.2% |
| Immigrants | Zimbabwe | 94.0 /100 | #114 | Exceptional 8.2% |
| Immigrants | Israel | 93.5 /100 | #115 | Exceptional 8.2% |
| South Africans | 93.4 /100 | #116 | Exceptional 8.2% |
| Immigrants | Russia | 93.2 /100 | #117 | Exceptional 8.2% |
| Immigrants | Western Europe | 92.9 /100 | #118 | Exceptional 8.2% |
| French | 92.8 /100 | #119 | Exceptional 8.3% |
| Immigrants | Egypt | 91.6 /100 | #120 | Exceptional 8.3% |
| Native Hawaiians | 91.3 /100 | #121 | Exceptional 8.3% |
| Paraguayans | 91.2 /100 | #122 | Exceptional 8.3% |
| Palestinians | 91.1 /100 | #123 | Exceptional 8.3% |
| Soviet Union | 90.8 /100 | #124 | Exceptional 8.3% |
| Pakistanis | 90.8 /100 | #125 | Exceptional 8.3% |