Yakama vs Immigrants from Belize Family Poverty
COMPARE
Yakama
Immigrants from Belize
Family Poverty
Family Poverty Comparison
Yakama
Immigrants from Belize
13.1%
FAMILY POVERTY
0.0/ 100
METRIC RATING
327th/ 347
METRIC RANK
11.5%
FAMILY POVERTY
0.0/ 100
METRIC RATING
288th/ 347
METRIC RANK
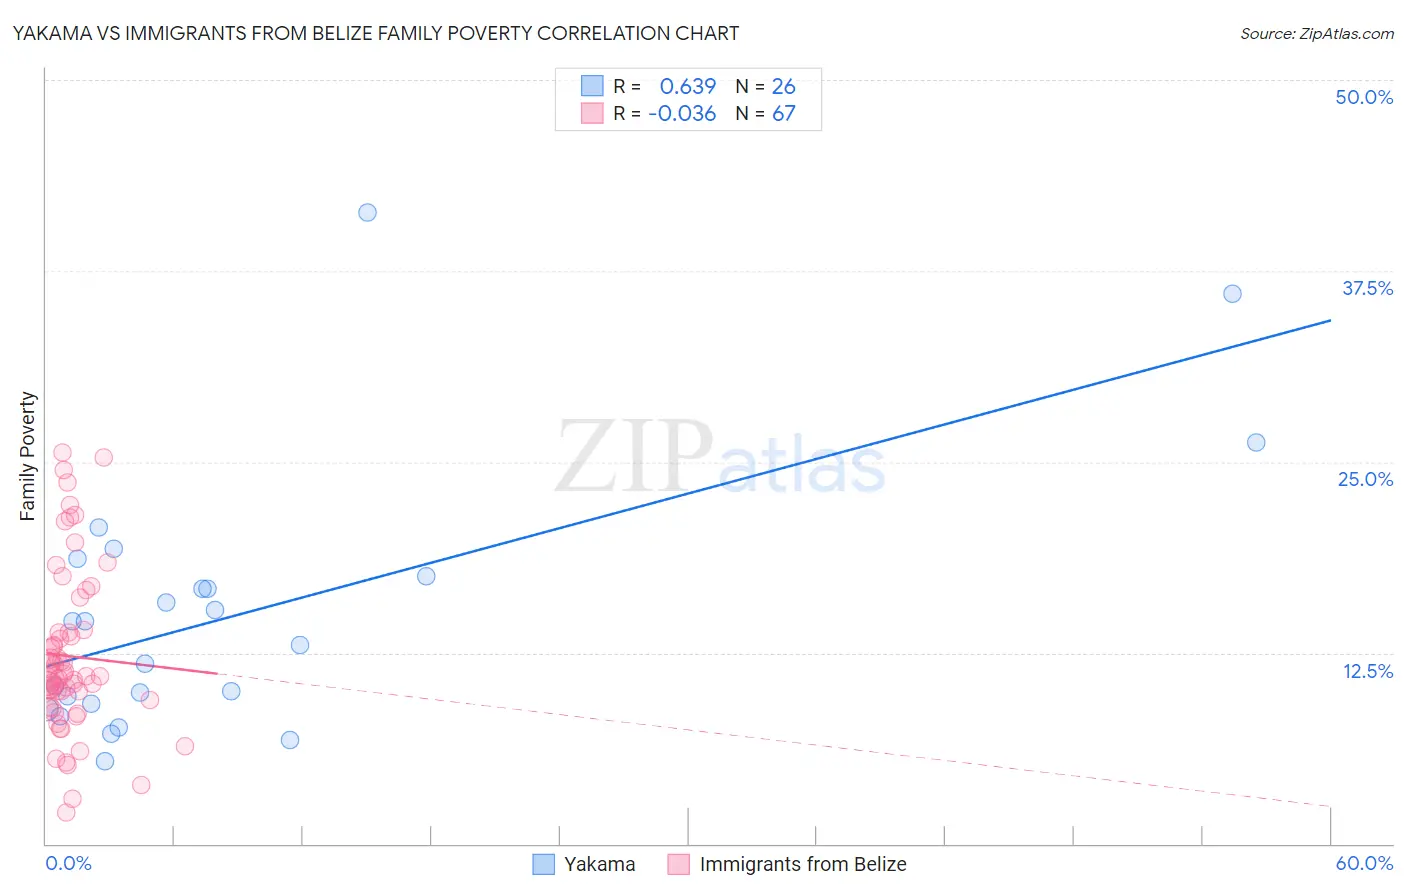
Yakama vs Immigrants from Belize Family Poverty Correlation Chart
The statistical analysis conducted on geographies consisting of 19,913,351 people shows a significant positive correlation between the proportion of Yakama and poverty level among families in the United States with a correlation coefficient (R) of 0.639 and weighted average of 13.1%. Similarly, the statistical analysis conducted on geographies consisting of 130,249,442 people shows no correlation between the proportion of Immigrants from Belize and poverty level among families in the United States with a correlation coefficient (R) of -0.036 and weighted average of 11.5%, a difference of 13.6%.
Family Poverty Correlation Summary
| Measurement | Yakama | Immigrants from Belize |
| Minimum | 5.4% | 2.0% |
| Maximum | 41.3% | 25.6% |
| Range | 35.9% | 23.6% |
| Mean | 15.1% | 12.3% |
| Median | 13.8% | 10.9% |
| Interquartile 25% (IQ1) | 9.1% | 9.4% |
| Interquartile 75% (IQ3) | 17.5% | 13.8% |
| Interquartile Range (IQR) | 8.4% | 4.4% |
| Standard Deviation (Sample) | 8.6% | 5.3% |
| Standard Deviation (Population) | 8.4% | 5.3% |
Similar Demographics by Family Poverty
Demographics Similar to Yakama by Family Poverty
In terms of family poverty, the demographic groups most similar to Yakama are Colville (13.0%, a difference of 0.68%), Paiute (13.0%, a difference of 0.75%), Central American Indian (13.3%, a difference of 1.7%), Black/African American (13.3%, a difference of 1.8%), and Immigrants from Dominica (12.7%, a difference of 2.7%).
| Demographics | Rating | Rank | Family Poverty |
| Inupiat | 0.0 /100 | #320 | Tragic 12.5% |
| Arapaho | 0.0 /100 | #321 | Tragic 12.7% |
| Immigrants | Honduras | 0.0 /100 | #322 | Tragic 12.7% |
| Menominee | 0.0 /100 | #323 | Tragic 12.7% |
| Immigrants | Dominica | 0.0 /100 | #324 | Tragic 12.7% |
| Paiute | 0.0 /100 | #325 | Tragic 13.0% |
| Colville | 0.0 /100 | #326 | Tragic 13.0% |
| Yakama | 0.0 /100 | #327 | Tragic 13.1% |
| Central American Indians | 0.0 /100 | #328 | Tragic 13.3% |
| Blacks/African Americans | 0.0 /100 | #329 | Tragic 13.3% |
| Natives/Alaskans | 0.0 /100 | #330 | Tragic 14.3% |
| Cheyenne | 0.0 /100 | #331 | Tragic 14.3% |
| Dominicans | 0.0 /100 | #332 | Tragic 14.3% |
| Immigrants | Dominican Republic | 0.0 /100 | #333 | Tragic 14.4% |
| Houma | 0.0 /100 | #334 | Tragic 14.6% |
Demographics Similar to Immigrants from Belize by Family Poverty
In terms of family poverty, the demographic groups most similar to Immigrants from Belize are Immigrants from Barbados (11.5%, a difference of 0.050%), West Indian (11.5%, a difference of 0.060%), Haitian (11.5%, a difference of 0.12%), Vietnamese (11.5%, a difference of 0.19%), and Immigrants from Somalia (11.5%, a difference of 0.22%).
| Demographics | Rating | Rank | Family Poverty |
| Immigrants | West Indies | 0.0 /100 | #281 | Tragic 11.3% |
| Immigrants | Cuba | 0.0 /100 | #282 | Tragic 11.3% |
| Indonesians | 0.0 /100 | #283 | Tragic 11.3% |
| Yaqui | 0.0 /100 | #284 | Tragic 11.3% |
| Barbadians | 0.0 /100 | #285 | Tragic 11.3% |
| Senegalese | 0.0 /100 | #286 | Tragic 11.5% |
| Vietnamese | 0.0 /100 | #287 | Tragic 11.5% |
| Immigrants | Belize | 0.0 /100 | #288 | Tragic 11.5% |
| Immigrants | Barbados | 0.0 /100 | #289 | Tragic 11.5% |
| West Indians | 0.0 /100 | #290 | Tragic 11.5% |
| Haitians | 0.0 /100 | #291 | Tragic 11.5% |
| Immigrants | Somalia | 0.0 /100 | #292 | Tragic 11.5% |
| Immigrants | Cabo Verde | 0.0 /100 | #293 | Tragic 11.6% |
| Immigrants | St. Vincent and the Grenadines | 0.0 /100 | #294 | Tragic 11.6% |
| Immigrants | Haiti | 0.0 /100 | #295 | Tragic 11.6% |