Yaqui vs Immigrants from Western Europe Family Poverty
COMPARE
Yaqui
Immigrants from Western Europe
Family Poverty
Family Poverty Comparison
Yaqui
Immigrants from Western Europe
11.3%
FAMILY POVERTY
0.0/ 100
METRIC RATING
284th/ 347
METRIC RANK
8.2%
FAMILY POVERTY
92.9/ 100
METRIC RATING
118th/ 347
METRIC RANK
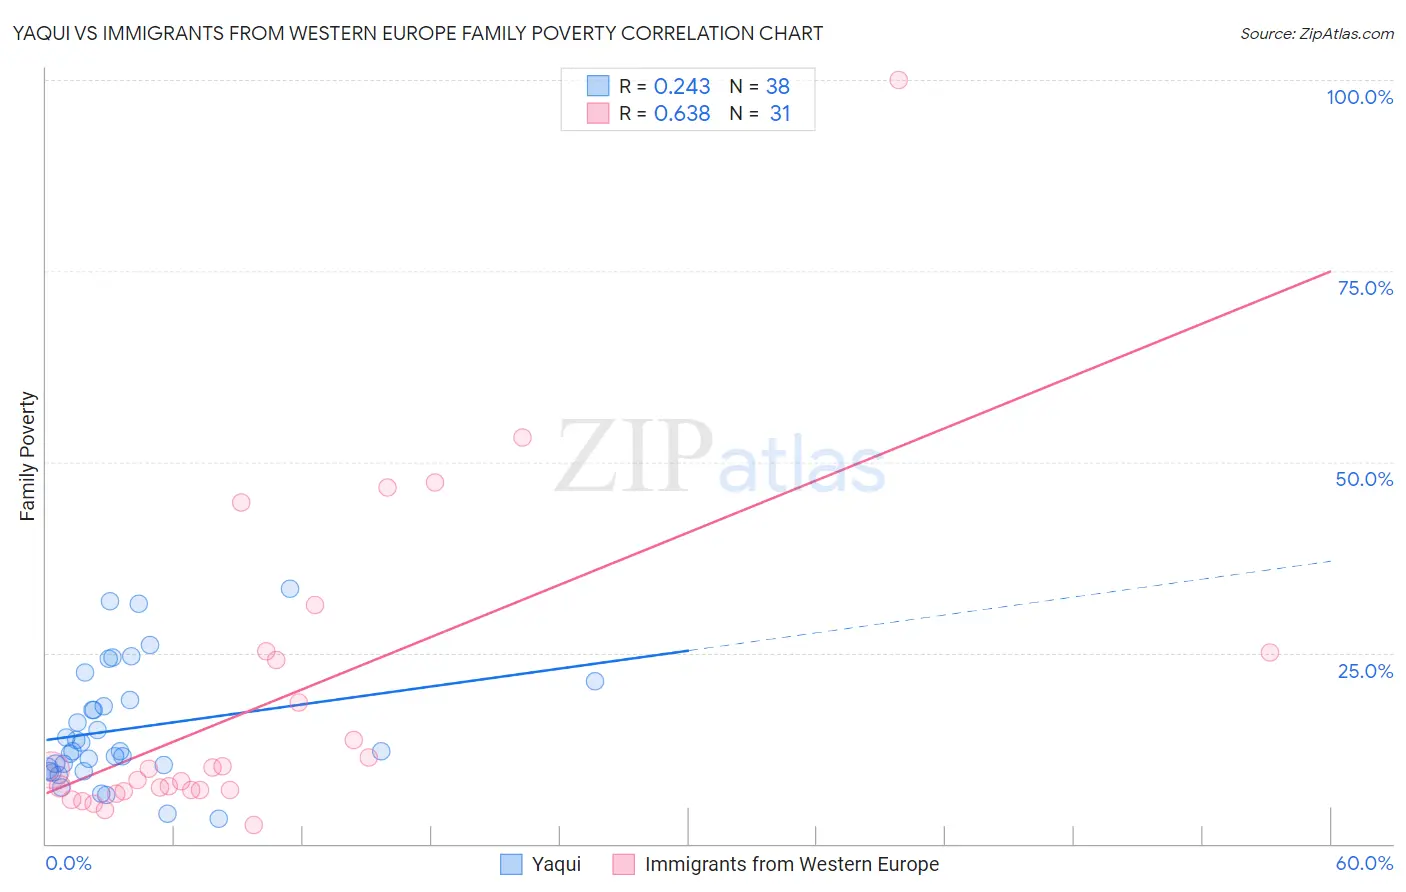
Yaqui vs Immigrants from Western Europe Family Poverty Correlation Chart
The statistical analysis conducted on geographies consisting of 107,688,240 people shows a weak positive correlation between the proportion of Yaqui and poverty level among families in the United States with a correlation coefficient (R) of 0.243 and weighted average of 11.3%. Similarly, the statistical analysis conducted on geographies consisting of 491,859,652 people shows a significant positive correlation between the proportion of Immigrants from Western Europe and poverty level among families in the United States with a correlation coefficient (R) of 0.638 and weighted average of 8.2%, a difference of 37.5%.
Family Poverty Correlation Summary
| Measurement | Yaqui | Immigrants from Western Europe |
| Minimum | 3.3% | 2.5% |
| Maximum | 33.3% | 100.0% |
| Range | 30.0% | 97.5% |
| Mean | 15.0% | 18.6% |
| Median | 12.2% | 9.6% |
| Interquartile 25% (IQ1) | 9.8% | 7.0% |
| Interquartile 75% (IQ3) | 18.8% | 25.0% |
| Interquartile Range (IQR) | 8.9% | 18.0% |
| Standard Deviation (Sample) | 7.6% | 20.8% |
| Standard Deviation (Population) | 7.5% | 20.5% |
Similar Demographics by Family Poverty
Demographics Similar to Yaqui by Family Poverty
In terms of family poverty, the demographic groups most similar to Yaqui are Barbadian (11.3%, a difference of 0.080%), Indonesian (11.3%, a difference of 0.12%), Immigrants from Cuba (11.3%, a difference of 0.16%), Immigrants from West Indies (11.3%, a difference of 0.42%), and Belizean (11.3%, a difference of 0.69%).
| Demographics | Rating | Rank | Family Poverty |
| Chippewa | 0.1 /100 | #277 | Tragic 11.2% |
| Guyanese | 0.1 /100 | #278 | Tragic 11.2% |
| Blackfeet | 0.0 /100 | #279 | Tragic 11.3% |
| Belizeans | 0.0 /100 | #280 | Tragic 11.3% |
| Immigrants | West Indies | 0.0 /100 | #281 | Tragic 11.3% |
| Immigrants | Cuba | 0.0 /100 | #282 | Tragic 11.3% |
| Indonesians | 0.0 /100 | #283 | Tragic 11.3% |
| Yaqui | 0.0 /100 | #284 | Tragic 11.3% |
| Barbadians | 0.0 /100 | #285 | Tragic 11.3% |
| Senegalese | 0.0 /100 | #286 | Tragic 11.5% |
| Vietnamese | 0.0 /100 | #287 | Tragic 11.5% |
| Immigrants | Belize | 0.0 /100 | #288 | Tragic 11.5% |
| Immigrants | Barbados | 0.0 /100 | #289 | Tragic 11.5% |
| West Indians | 0.0 /100 | #290 | Tragic 11.5% |
| Haitians | 0.0 /100 | #291 | Tragic 11.5% |
Demographics Similar to Immigrants from Western Europe by Family Poverty
In terms of family poverty, the demographic groups most similar to Immigrants from Western Europe are French (8.3%, a difference of 0.070%), Immigrants from Russia (8.2%, a difference of 0.19%), South African (8.2%, a difference of 0.26%), Immigrants from Israel (8.2%, a difference of 0.32%), and Immigrants from Egypt (8.3%, a difference of 0.63%).
| Demographics | Rating | Rank | Family Poverty |
| Taiwanese | 94.6 /100 | #111 | Exceptional 8.2% |
| Immigrants | France | 94.4 /100 | #112 | Exceptional 8.2% |
| Canadians | 94.2 /100 | #113 | Exceptional 8.2% |
| Immigrants | Zimbabwe | 94.0 /100 | #114 | Exceptional 8.2% |
| Immigrants | Israel | 93.5 /100 | #115 | Exceptional 8.2% |
| South Africans | 93.4 /100 | #116 | Exceptional 8.2% |
| Immigrants | Russia | 93.2 /100 | #117 | Exceptional 8.2% |
| Immigrants | Western Europe | 92.9 /100 | #118 | Exceptional 8.2% |
| French | 92.8 /100 | #119 | Exceptional 8.3% |
| Immigrants | Egypt | 91.6 /100 | #120 | Exceptional 8.3% |
| Native Hawaiians | 91.3 /100 | #121 | Exceptional 8.3% |
| Paraguayans | 91.2 /100 | #122 | Exceptional 8.3% |
| Palestinians | 91.1 /100 | #123 | Exceptional 8.3% |
| Soviet Union | 90.8 /100 | #124 | Exceptional 8.3% |
| Pakistanis | 90.8 /100 | #125 | Exceptional 8.3% |