Ute vs Immigrants from Iran Single Female Poverty
COMPARE
Ute
Immigrants from Iran
Single Female Poverty
Single Female Poverty Comparison
Ute
Immigrants from Iran
28.4%
SINGLE FEMALE POVERTY
0.0/ 100
METRIC RATING
333rd/ 347
METRIC RANK
17.5%
SINGLE FEMALE POVERTY
100.0/ 100
METRIC RATING
8th/ 347
METRIC RANK
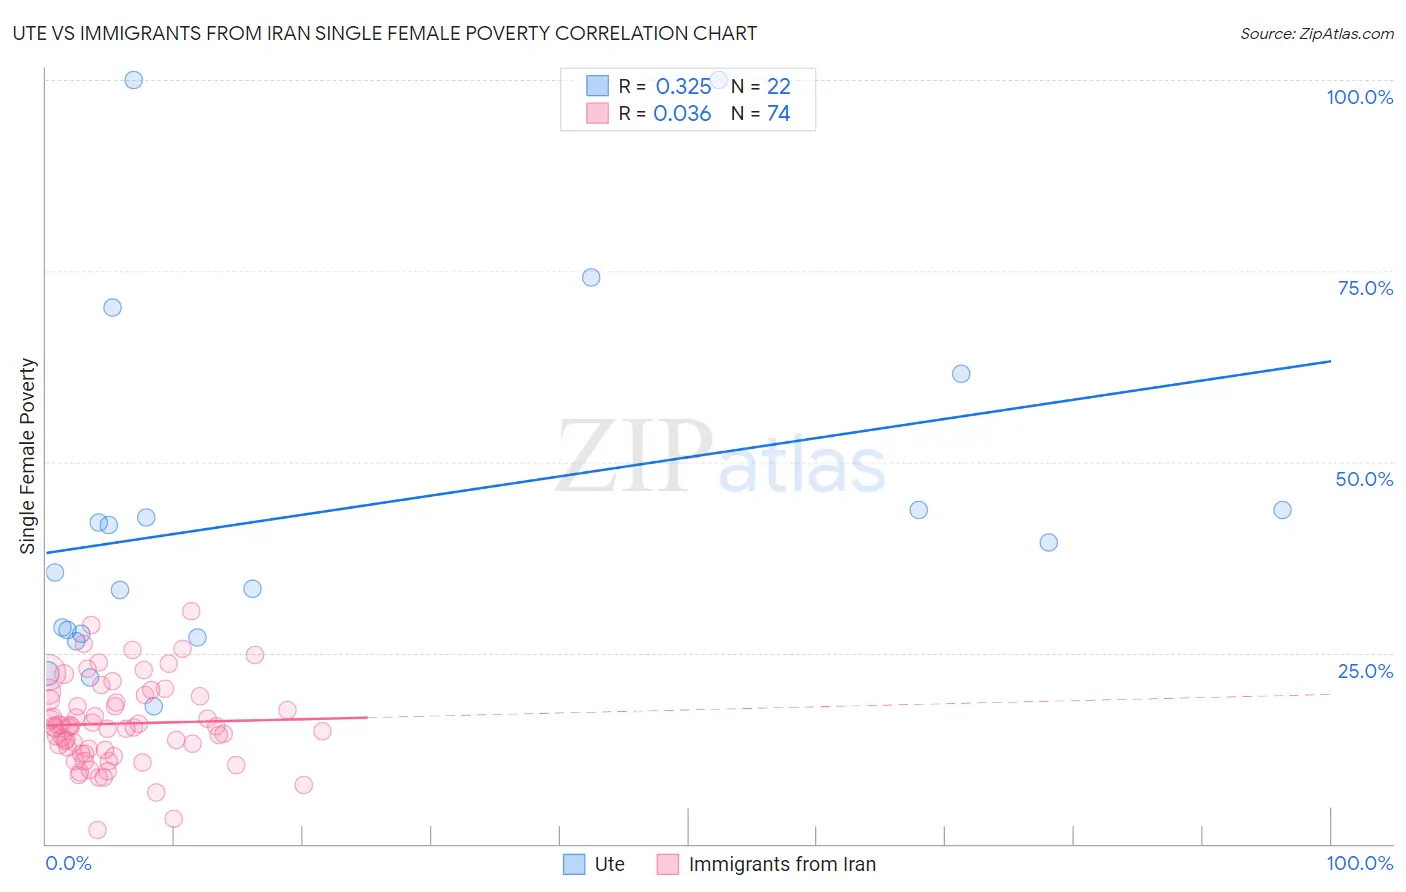
Ute vs Immigrants from Iran Single Female Poverty Correlation Chart
The statistical analysis conducted on geographies consisting of 55,519,789 people shows a mild positive correlation between the proportion of Ute and poverty level among single females in the United States with a correlation coefficient (R) of 0.325 and weighted average of 28.4%. Similarly, the statistical analysis conducted on geographies consisting of 276,267,918 people shows no correlation between the proportion of Immigrants from Iran and poverty level among single females in the United States with a correlation coefficient (R) of 0.036 and weighted average of 17.5%, a difference of 62.8%.
Single Female Poverty Correlation Summary
| Measurement | Ute | Immigrants from Iran |
| Minimum | 18.0% | 1.9% |
| Maximum | 100.0% | 30.4% |
| Range | 82.0% | 28.5% |
| Mean | 43.7% | 15.7% |
| Median | 37.5% | 15.3% |
| Interquartile 25% (IQ1) | 27.4% | 12.3% |
| Interquartile 75% (IQ3) | 43.8% | 19.3% |
| Interquartile Range (IQR) | 16.3% | 6.9% |
| Standard Deviation (Sample) | 23.4% | 5.6% |
| Standard Deviation (Population) | 22.9% | 5.5% |
Similar Demographics by Single Female Poverty
Demographics Similar to Ute by Single Female Poverty
In terms of single female poverty, the demographic groups most similar to Ute are Yakama (28.3%, a difference of 0.42%), Native/Alaskan (28.2%, a difference of 0.68%), Pueblo (28.6%, a difference of 0.73%), Hopi (28.0%, a difference of 1.3%), and Immigrants from Yemen (28.9%, a difference of 1.9%).
| Demographics | Rating | Rank | Single Female Poverty |
| Creek | 0.0 /100 | #326 | Tragic 27.4% |
| Dutch West Indians | 0.0 /100 | #327 | Tragic 27.5% |
| Apache | 0.0 /100 | #328 | Tragic 27.7% |
| Menominee | 0.0 /100 | #329 | Tragic 27.8% |
| Hopi | 0.0 /100 | #330 | Tragic 28.0% |
| Natives/Alaskans | 0.0 /100 | #331 | Tragic 28.2% |
| Yakama | 0.0 /100 | #332 | Tragic 28.3% |
| Ute | 0.0 /100 | #333 | Tragic 28.4% |
| Pueblo | 0.0 /100 | #334 | Tragic 28.6% |
| Immigrants | Yemen | 0.0 /100 | #335 | Tragic 28.9% |
| Colville | 0.0 /100 | #336 | Tragic 29.1% |
| Yuman | 0.0 /100 | #337 | Tragic 29.4% |
| Pima | 0.0 /100 | #338 | Tragic 30.3% |
| Cheyenne | 0.0 /100 | #339 | Tragic 30.4% |
| Cajuns | 0.0 /100 | #340 | Tragic 30.6% |
Demographics Similar to Immigrants from Iran by Single Female Poverty
In terms of single female poverty, the demographic groups most similar to Immigrants from Iran are Thai (17.3%, a difference of 0.99%), Bhutanese (17.7%, a difference of 1.4%), Immigrants from Ireland (17.8%, a difference of 1.8%), Immigrants from Lithuania (17.8%, a difference of 1.9%), and Immigrants from South Central Asia (17.8%, a difference of 2.0%).
| Demographics | Rating | Rank | Single Female Poverty |
| Chinese | 100.0 /100 | #1 | Exceptional 16.1% |
| Immigrants | Taiwan | 100.0 /100 | #2 | Exceptional 16.4% |
| Immigrants | Hong Kong | 100.0 /100 | #3 | Exceptional 16.5% |
| Immigrants | India | 100.0 /100 | #4 | Exceptional 16.8% |
| Assyrians/Chaldeans/Syriacs | 100.0 /100 | #5 | Exceptional 17.0% |
| Filipinos | 100.0 /100 | #6 | Exceptional 17.0% |
| Thais | 100.0 /100 | #7 | Exceptional 17.3% |
| Immigrants | Iran | 100.0 /100 | #8 | Exceptional 17.5% |
| Bhutanese | 100.0 /100 | #9 | Exceptional 17.7% |
| Immigrants | Ireland | 100.0 /100 | #10 | Exceptional 17.8% |
| Immigrants | Lithuania | 100.0 /100 | #11 | Exceptional 17.8% |
| Immigrants | South Central Asia | 100.0 /100 | #12 | Exceptional 17.8% |
| Immigrants | Bolivia | 100.0 /100 | #13 | Exceptional 17.8% |
| Bolivians | 100.0 /100 | #14 | Exceptional 17.9% |
| Indians (Asian) | 100.0 /100 | #15 | Exceptional 17.9% |