Ute vs Somali Single Female Poverty
COMPARE
Ute
Somali
Single Female Poverty
Single Female Poverty Comparison
Ute
Somalis
28.4%
SINGLE FEMALE POVERTY
0.0/ 100
METRIC RATING
333rd/ 347
METRIC RANK
25.2%
SINGLE FEMALE POVERTY
0.0/ 100
METRIC RATING
303rd/ 347
METRIC RANK
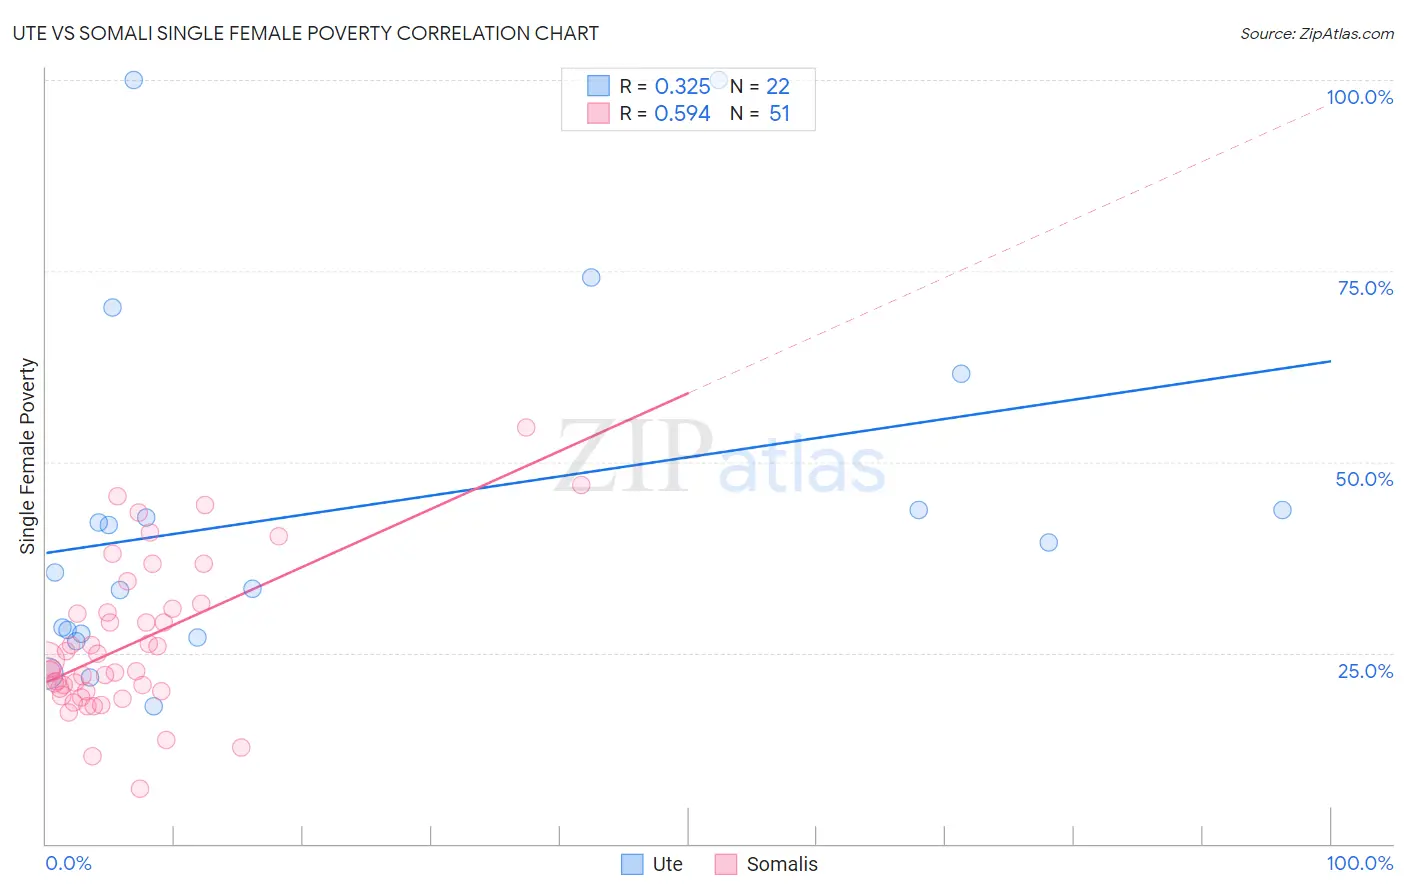
Ute vs Somali Single Female Poverty Correlation Chart
The statistical analysis conducted on geographies consisting of 55,519,789 people shows a mild positive correlation between the proportion of Ute and poverty level among single females in the United States with a correlation coefficient (R) of 0.325 and weighted average of 28.4%. Similarly, the statistical analysis conducted on geographies consisting of 99,025,014 people shows a substantial positive correlation between the proportion of Somalis and poverty level among single females in the United States with a correlation coefficient (R) of 0.594 and weighted average of 25.2%, a difference of 12.6%.
Single Female Poverty Correlation Summary
| Measurement | Ute | Somali |
| Minimum | 18.0% | 7.2% |
| Maximum | 100.0% | 54.5% |
| Range | 82.0% | 47.2% |
| Mean | 43.7% | 26.3% |
| Median | 37.5% | 23.0% |
| Interquartile 25% (IQ1) | 27.4% | 19.9% |
| Interquartile 75% (IQ3) | 43.8% | 30.8% |
| Interquartile Range (IQR) | 16.3% | 10.9% |
| Standard Deviation (Sample) | 23.4% | 9.9% |
| Standard Deviation (Population) | 22.9% | 9.8% |
Similar Demographics by Single Female Poverty
Demographics Similar to Ute by Single Female Poverty
In terms of single female poverty, the demographic groups most similar to Ute are Yakama (28.3%, a difference of 0.42%), Native/Alaskan (28.2%, a difference of 0.68%), Pueblo (28.6%, a difference of 0.73%), Hopi (28.0%, a difference of 1.3%), and Immigrants from Yemen (28.9%, a difference of 1.9%).
| Demographics | Rating | Rank | Single Female Poverty |
| Creek | 0.0 /100 | #326 | Tragic 27.4% |
| Dutch West Indians | 0.0 /100 | #327 | Tragic 27.5% |
| Apache | 0.0 /100 | #328 | Tragic 27.7% |
| Menominee | 0.0 /100 | #329 | Tragic 27.8% |
| Hopi | 0.0 /100 | #330 | Tragic 28.0% |
| Natives/Alaskans | 0.0 /100 | #331 | Tragic 28.2% |
| Yakama | 0.0 /100 | #332 | Tragic 28.3% |
| Ute | 0.0 /100 | #333 | Tragic 28.4% |
| Pueblo | 0.0 /100 | #334 | Tragic 28.6% |
| Immigrants | Yemen | 0.0 /100 | #335 | Tragic 28.9% |
| Colville | 0.0 /100 | #336 | Tragic 29.1% |
| Yuman | 0.0 /100 | #337 | Tragic 29.4% |
| Pima | 0.0 /100 | #338 | Tragic 30.3% |
| Cheyenne | 0.0 /100 | #339 | Tragic 30.4% |
| Cajuns | 0.0 /100 | #340 | Tragic 30.6% |
Demographics Similar to Somalis by Single Female Poverty
In terms of single female poverty, the demographic groups most similar to Somalis are Immigrants from Congo (25.3%, a difference of 0.27%), Immigrants from Dominican Republic (25.3%, a difference of 0.28%), Immigrants from Mexico (25.3%, a difference of 0.38%), Shoshone (25.1%, a difference of 0.40%), and Honduran (25.1%, a difference of 0.48%).
| Demographics | Rating | Rank | Single Female Poverty |
| Africans | 0.0 /100 | #296 | Tragic 24.8% |
| Immigrants | Central America | 0.0 /100 | #297 | Tragic 24.8% |
| Yaqui | 0.0 /100 | #298 | Tragic 24.9% |
| Mexicans | 0.0 /100 | #299 | Tragic 25.0% |
| Blackfeet | 0.0 /100 | #300 | Tragic 25.1% |
| Hondurans | 0.0 /100 | #301 | Tragic 25.1% |
| Shoshone | 0.0 /100 | #302 | Tragic 25.1% |
| Somalis | 0.0 /100 | #303 | Tragic 25.2% |
| Immigrants | Congo | 0.0 /100 | #304 | Tragic 25.3% |
| Immigrants | Dominican Republic | 0.0 /100 | #305 | Tragic 25.3% |
| Immigrants | Mexico | 0.0 /100 | #306 | Tragic 25.3% |
| Potawatomi | 0.0 /100 | #307 | Tragic 25.4% |
| Aleuts | 0.0 /100 | #308 | Tragic 25.4% |
| Dominicans | 0.0 /100 | #309 | Tragic 25.4% |
| Central American Indians | 0.0 /100 | #310 | Tragic 25.5% |