Ute vs Immigrants from Iran Median Household Income
COMPARE
Ute
Immigrants from Iran
Median Household Income
Median Household Income Comparison
Ute
Immigrants from Iran
$72,402
MEDIAN HOUSEHOLD INCOME
0.0/ 100
METRIC RATING
307th/ 347
METRIC RANK
$108,055
MEDIAN HOUSEHOLD INCOME
100.0/ 100
METRIC RATING
8th/ 347
METRIC RANK
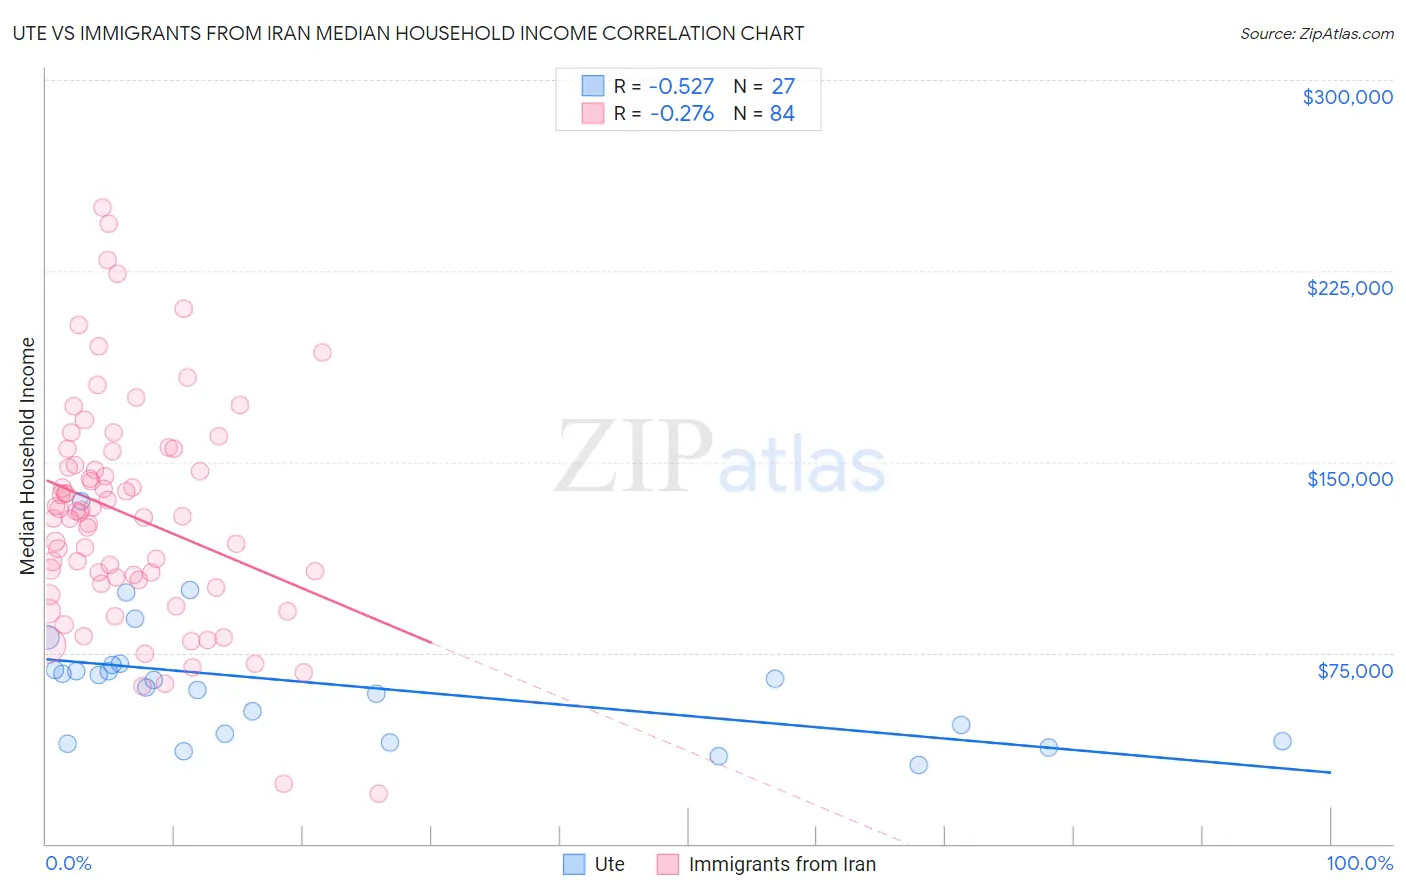
Ute vs Immigrants from Iran Median Household Income Correlation Chart
The statistical analysis conducted on geographies consisting of 55,657,610 people shows a substantial negative correlation between the proportion of Ute and median household income in the United States with a correlation coefficient (R) of -0.527 and weighted average of $72,402. Similarly, the statistical analysis conducted on geographies consisting of 279,821,960 people shows a weak negative correlation between the proportion of Immigrants from Iran and median household income in the United States with a correlation coefficient (R) of -0.276 and weighted average of $108,055, a difference of 49.2%.
Median Household Income Correlation Summary
| Measurement | Ute | Immigrants from Iran |
| Minimum | $30,694 | $19,722 |
| Maximum | $134,629 | $250,001 |
| Range | $103,935 | $230,279 |
| Mean | $62,668 | $128,949 |
| Median | $64,375 | $129,200 |
| Interquartile 25% (IQ1) | $40,417 | $102,878 |
| Interquartile 75% (IQ3) | $70,252 | $151,481 |
| Interquartile Range (IQR) | $29,835 | $48,604 |
| Standard Deviation (Sample) | $23,676 | $44,216 |
| Standard Deviation (Population) | $23,234 | $43,952 |
Similar Demographics by Median Household Income
Demographics Similar to Ute by Median Household Income
In terms of median household income, the demographic groups most similar to Ute are Potawatomi ($72,576, a difference of 0.24%), Yakama ($72,225, a difference of 0.25%), Honduran ($72,588, a difference of 0.26%), Immigrants from Haiti ($72,599, a difference of 0.27%), and African ($72,650, a difference of 0.34%).
| Demographics | Rating | Rank | Median Household Income |
| Immigrants | Dominica | 0.0 /100 | #300 | Tragic $72,760 |
| Cherokee | 0.0 /100 | #301 | Tragic $72,682 |
| Shoshone | 0.0 /100 | #302 | Tragic $72,660 |
| Africans | 0.0 /100 | #303 | Tragic $72,650 |
| Immigrants | Haiti | 0.0 /100 | #304 | Tragic $72,599 |
| Hondurans | 0.0 /100 | #305 | Tragic $72,588 |
| Potawatomi | 0.0 /100 | #306 | Tragic $72,576 |
| Ute | 0.0 /100 | #307 | Tragic $72,402 |
| Yakama | 0.0 /100 | #308 | Tragic $72,225 |
| Immigrants | Caribbean | 0.0 /100 | #309 | Tragic $71,860 |
| U.S. Virgin Islanders | 0.0 /100 | #310 | Tragic $71,853 |
| Immigrants | Zaire | 0.0 /100 | #311 | Tragic $71,801 |
| Immigrants | Honduras | 0.0 /100 | #312 | Tragic $71,452 |
| Immigrants | Bahamas | 0.0 /100 | #313 | Tragic $71,349 |
| Dominicans | 0.0 /100 | #314 | Tragic $71,302 |
Demographics Similar to Immigrants from Iran by Median Household Income
In terms of median household income, the demographic groups most similar to Immigrants from Iran are Okinawan ($106,624, a difference of 1.3%), Iranian ($109,835, a difference of 1.7%), Immigrants from South Central Asia ($106,057, a difference of 1.9%), Immigrants from Singapore ($110,428, a difference of 2.2%), and Thai ($110,648, a difference of 2.4%).
| Demographics | Rating | Rank | Median Household Income |
| Immigrants | Taiwan | 100.0 /100 | #1 | Exceptional $116,460 |
| Filipinos | 100.0 /100 | #2 | Exceptional $115,509 |
| Immigrants | India | 100.0 /100 | #3 | Exceptional $113,009 |
| Immigrants | Hong Kong | 100.0 /100 | #4 | Exceptional $111,519 |
| Thais | 100.0 /100 | #5 | Exceptional $110,648 |
| Immigrants | Singapore | 100.0 /100 | #6 | Exceptional $110,428 |
| Iranians | 100.0 /100 | #7 | Exceptional $109,835 |
| Immigrants | Iran | 100.0 /100 | #8 | Exceptional $108,055 |
| Okinawans | 100.0 /100 | #9 | Exceptional $106,624 |
| Immigrants | South Central Asia | 100.0 /100 | #10 | Exceptional $106,057 |
| Immigrants | China | 100.0 /100 | #11 | Exceptional $105,335 |
| Indians (Asian) | 100.0 /100 | #12 | Exceptional $105,262 |
| Immigrants | Eastern Asia | 100.0 /100 | #13 | Exceptional $104,796 |
| Immigrants | Ireland | 100.0 /100 | #14 | Exceptional $104,692 |
| Immigrants | Israel | 100.0 /100 | #15 | Exceptional $104,090 |