Ute vs Nicaraguan Single Female Poverty
COMPARE
Ute
Nicaraguan
Single Female Poverty
Single Female Poverty Comparison
Ute
Nicaraguans
28.4%
SINGLE FEMALE POVERTY
0.0/ 100
METRIC RATING
333rd/ 347
METRIC RANK
21.3%
SINGLE FEMALE POVERTY
27.6/ 100
METRIC RATING
195th/ 347
METRIC RANK
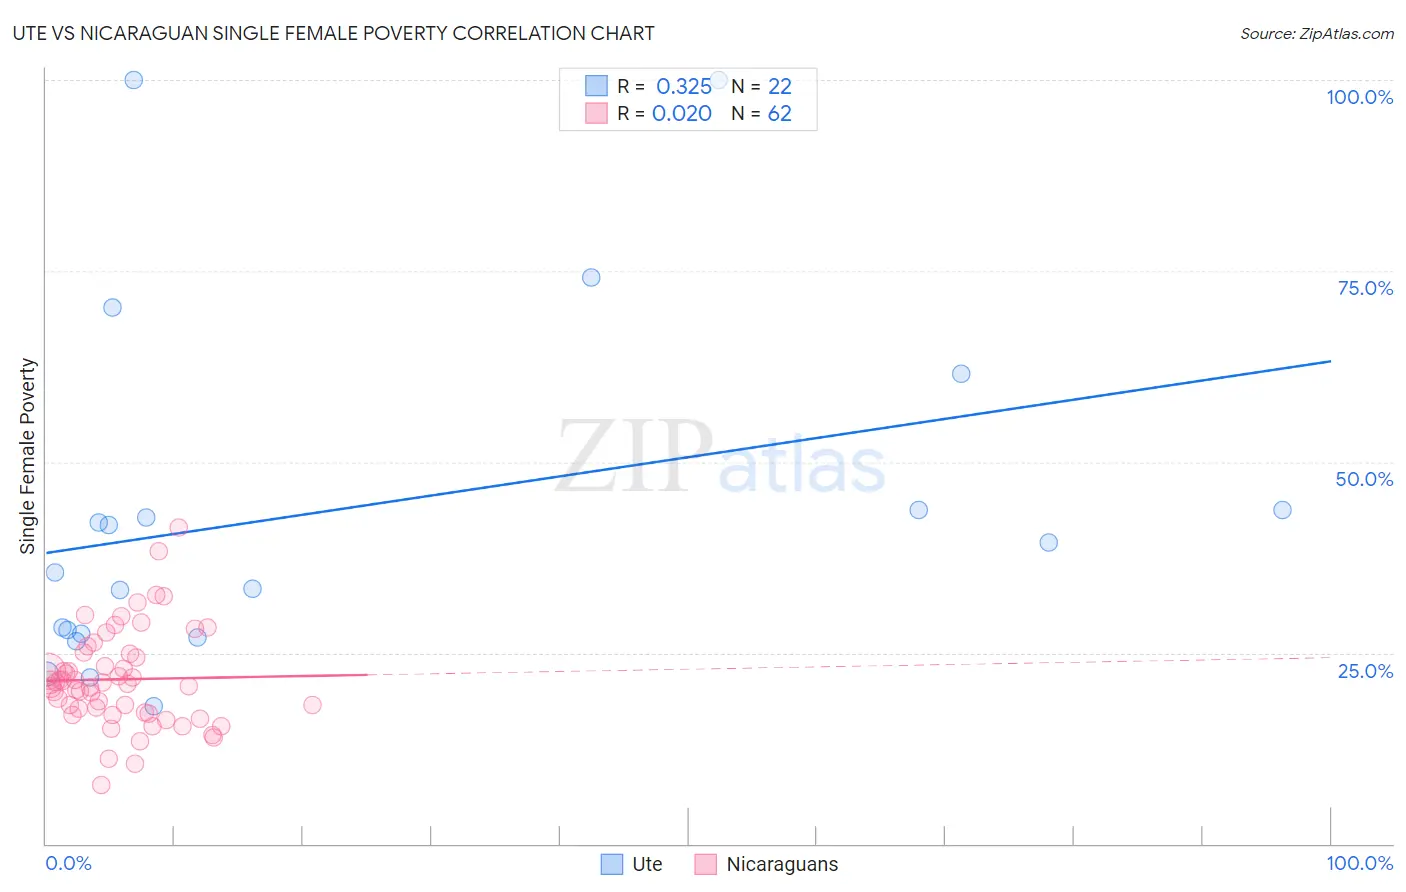
Ute vs Nicaraguan Single Female Poverty Correlation Chart
The statistical analysis conducted on geographies consisting of 55,519,789 people shows a mild positive correlation between the proportion of Ute and poverty level among single females in the United States with a correlation coefficient (R) of 0.325 and weighted average of 28.4%. Similarly, the statistical analysis conducted on geographies consisting of 283,867,505 people shows no correlation between the proportion of Nicaraguans and poverty level among single females in the United States with a correlation coefficient (R) of 0.020 and weighted average of 21.3%, a difference of 33.2%.
Single Female Poverty Correlation Summary
| Measurement | Ute | Nicaraguan |
| Minimum | 18.0% | 7.8% |
| Maximum | 100.0% | 41.4% |
| Range | 82.0% | 33.6% |
| Mean | 43.7% | 21.5% |
| Median | 37.5% | 21.1% |
| Interquartile 25% (IQ1) | 27.4% | 17.2% |
| Interquartile 75% (IQ3) | 43.8% | 24.9% |
| Interquartile Range (IQR) | 16.3% | 7.7% |
| Standard Deviation (Sample) | 23.4% | 6.3% |
| Standard Deviation (Population) | 22.9% | 6.3% |
Similar Demographics by Single Female Poverty
Demographics Similar to Ute by Single Female Poverty
In terms of single female poverty, the demographic groups most similar to Ute are Yakama (28.3%, a difference of 0.42%), Native/Alaskan (28.2%, a difference of 0.68%), Pueblo (28.6%, a difference of 0.73%), Hopi (28.0%, a difference of 1.3%), and Immigrants from Yemen (28.9%, a difference of 1.9%).
| Demographics | Rating | Rank | Single Female Poverty |
| Creek | 0.0 /100 | #326 | Tragic 27.4% |
| Dutch West Indians | 0.0 /100 | #327 | Tragic 27.5% |
| Apache | 0.0 /100 | #328 | Tragic 27.7% |
| Menominee | 0.0 /100 | #329 | Tragic 27.8% |
| Hopi | 0.0 /100 | #330 | Tragic 28.0% |
| Natives/Alaskans | 0.0 /100 | #331 | Tragic 28.2% |
| Yakama | 0.0 /100 | #332 | Tragic 28.3% |
| Ute | 0.0 /100 | #333 | Tragic 28.4% |
| Pueblo | 0.0 /100 | #334 | Tragic 28.6% |
| Immigrants | Yemen | 0.0 /100 | #335 | Tragic 28.9% |
| Colville | 0.0 /100 | #336 | Tragic 29.1% |
| Yuman | 0.0 /100 | #337 | Tragic 29.4% |
| Pima | 0.0 /100 | #338 | Tragic 30.3% |
| Cheyenne | 0.0 /100 | #339 | Tragic 30.4% |
| Cajuns | 0.0 /100 | #340 | Tragic 30.6% |
Demographics Similar to Nicaraguans by Single Female Poverty
In terms of single female poverty, the demographic groups most similar to Nicaraguans are Czechoslovakian (21.3%, a difference of 0.010%), Basque (21.3%, a difference of 0.040%), Immigrants from Saudi Arabia (21.3%, a difference of 0.040%), Japanese (21.3%, a difference of 0.090%), and Immigrants from Jamaica (21.3%, a difference of 0.22%).
| Demographics | Rating | Rank | Single Female Poverty |
| Yugoslavians | 35.4 /100 | #188 | Fair 21.2% |
| Immigrants | Cuba | 35.3 /100 | #189 | Fair 21.2% |
| Trinidadians and Tobagonians | 35.2 /100 | #190 | Fair 21.2% |
| Immigrants | Germany | 31.1 /100 | #191 | Fair 21.3% |
| Immigrants | Jamaica | 30.5 /100 | #192 | Fair 21.3% |
| Basques | 28.1 /100 | #193 | Fair 21.3% |
| Czechoslovakians | 27.7 /100 | #194 | Fair 21.3% |
| Nicaraguans | 27.6 /100 | #195 | Fair 21.3% |
| Immigrants | Saudi Arabia | 27.1 /100 | #196 | Fair 21.3% |
| Japanese | 26.4 /100 | #197 | Fair 21.3% |
| Swiss | 24.2 /100 | #198 | Fair 21.4% |
| Immigrants | Immigrants | 22.0 /100 | #199 | Fair 21.4% |
| Irish | 21.4 /100 | #200 | Fair 21.4% |
| Nigerians | 20.9 /100 | #201 | Fair 21.4% |
| Immigrants | Kenya | 20.7 /100 | #202 | Fair 21.4% |