Turkish vs Immigrants from West Indies Female Poverty
COMPARE
Turkish
Immigrants from West Indies
Female Poverty
Female Poverty Comparison
Turks
Immigrants from West Indies
11.9%
FEMALE POVERTY
99.2/ 100
METRIC RATING
46th/ 347
METRIC RANK
16.1%
FEMALE POVERTY
0.0/ 100
METRIC RATING
278th/ 347
METRIC RANK
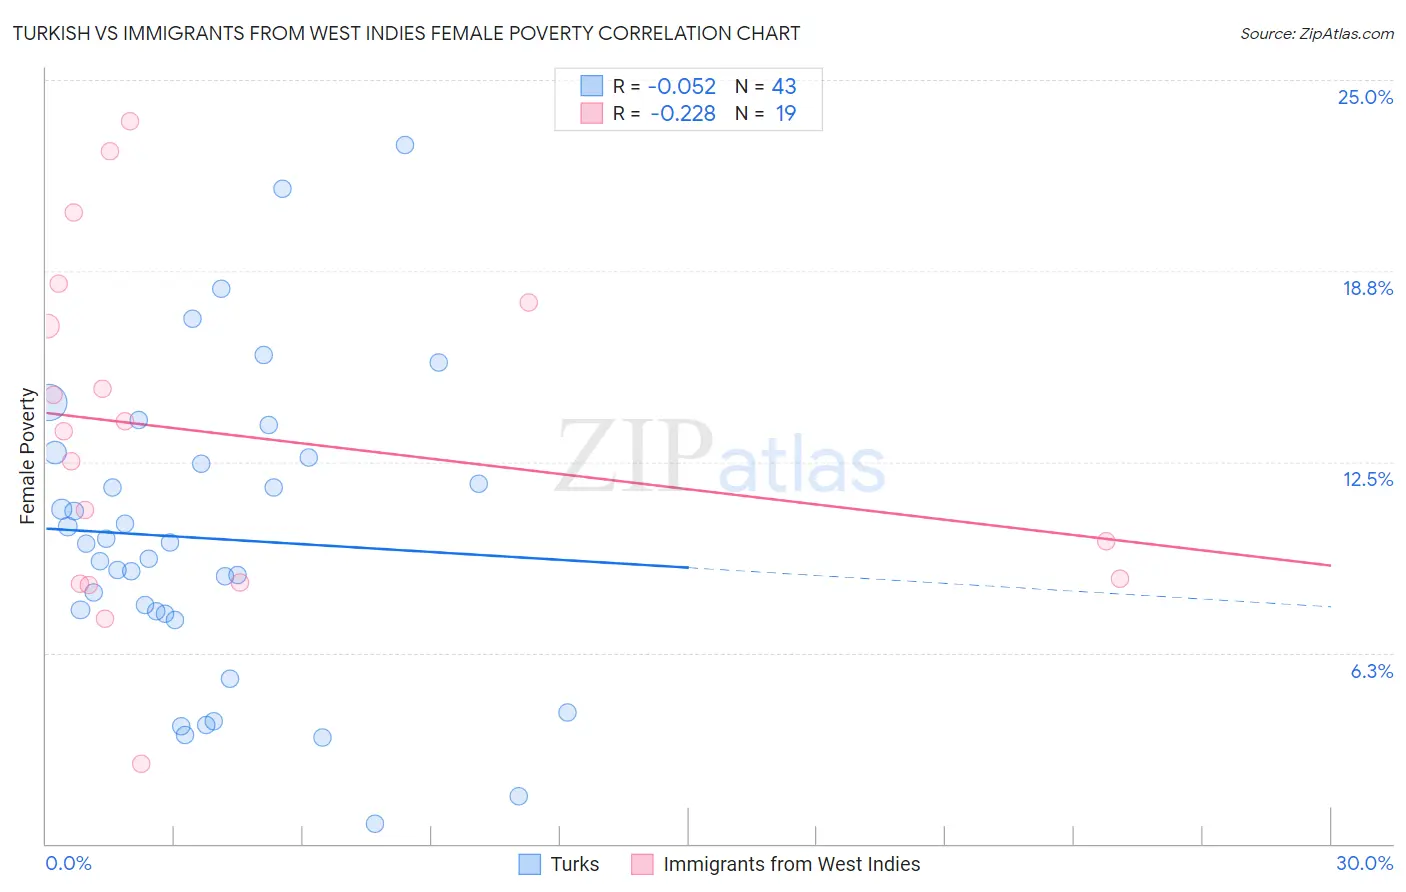
Turkish vs Immigrants from West Indies Female Poverty Correlation Chart
The statistical analysis conducted on geographies consisting of 271,658,978 people shows a slight negative correlation between the proportion of Turks and poverty level among females in the United States with a correlation coefficient (R) of -0.052 and weighted average of 11.9%. Similarly, the statistical analysis conducted on geographies consisting of 72,454,628 people shows a weak negative correlation between the proportion of Immigrants from West Indies and poverty level among females in the United States with a correlation coefficient (R) of -0.228 and weighted average of 16.1%, a difference of 34.9%.
Female Poverty Correlation Summary
| Measurement | Turkish | Immigrants from West Indies |
| Minimum | 0.67% | 2.6% |
| Maximum | 22.9% | 23.6% |
| Range | 22.2% | 21.0% |
| Mean | 10.0% | 13.4% |
| Median | 9.8% | 13.5% |
| Interquartile 25% (IQ1) | 7.5% | 8.5% |
| Interquartile 75% (IQ3) | 12.6% | 17.7% |
| Interquartile Range (IQR) | 5.1% | 9.2% |
| Standard Deviation (Sample) | 4.9% | 5.6% |
| Standard Deviation (Population) | 4.8% | 5.5% |
Similar Demographics by Female Poverty
Demographics Similar to Turks by Female Poverty
In terms of female poverty, the demographic groups most similar to Turks are Immigrants from Czechoslovakia (11.9%, a difference of 0.0%), Tongan (11.9%, a difference of 0.10%), Korean (11.9%, a difference of 0.16%), Czech (11.9%, a difference of 0.20%), and Immigrants from Moldova (11.9%, a difference of 0.20%).
| Demographics | Rating | Rank | Female Poverty |
| Immigrants | Poland | 99.3 /100 | #39 | Exceptional 11.8% |
| Macedonians | 99.3 /100 | #40 | Exceptional 11.8% |
| Czechs | 99.2 /100 | #41 | Exceptional 11.9% |
| Immigrants | Moldova | 99.2 /100 | #42 | Exceptional 11.9% |
| Koreans | 99.2 /100 | #43 | Exceptional 11.9% |
| Tongans | 99.2 /100 | #44 | Exceptional 11.9% |
| Immigrants | Czechoslovakia | 99.2 /100 | #45 | Exceptional 11.9% |
| Turks | 99.2 /100 | #46 | Exceptional 11.9% |
| Asians | 99.1 /100 | #47 | Exceptional 11.9% |
| Immigrants | Japan | 99.0 /100 | #48 | Exceptional 11.9% |
| Immigrants | Romania | 99.0 /100 | #49 | Exceptional 12.0% |
| Slovenes | 98.9 /100 | #50 | Exceptional 12.0% |
| Immigrants | Bulgaria | 98.9 /100 | #51 | Exceptional 12.0% |
| Immigrants | Croatia | 98.7 /100 | #52 | Exceptional 12.0% |
| Immigrants | Austria | 98.7 /100 | #53 | Exceptional 12.0% |
Demographics Similar to Immigrants from West Indies by Female Poverty
In terms of female poverty, the demographic groups most similar to Immigrants from West Indies are Immigrants from Bahamas (16.1%, a difference of 0.12%), Bangladeshi (16.0%, a difference of 0.31%), Vietnamese (16.1%, a difference of 0.35%), West Indian (16.1%, a difference of 0.37%), and Central American (16.0%, a difference of 0.50%).
| Demographics | Rating | Rank | Female Poverty |
| Immigrants | St. Vincent and the Grenadines | 0.0 /100 | #271 | Tragic 15.9% |
| Belizeans | 0.0 /100 | #272 | Tragic 15.9% |
| Haitians | 0.0 /100 | #273 | Tragic 15.9% |
| Barbadians | 0.0 /100 | #274 | Tragic 15.9% |
| Immigrants | Barbados | 0.0 /100 | #275 | Tragic 16.0% |
| Central Americans | 0.0 /100 | #276 | Tragic 16.0% |
| Bangladeshis | 0.0 /100 | #277 | Tragic 16.0% |
| Immigrants | West Indies | 0.0 /100 | #278 | Tragic 16.1% |
| Immigrants | Bahamas | 0.0 /100 | #279 | Tragic 16.1% |
| Vietnamese | 0.0 /100 | #280 | Tragic 16.1% |
| West Indians | 0.0 /100 | #281 | Tragic 16.1% |
| Immigrants | Haiti | 0.0 /100 | #282 | Tragic 16.1% |
| Immigrants | Cuba | 0.0 /100 | #283 | Tragic 16.1% |
| Spanish Americans | 0.0 /100 | #284 | Tragic 16.2% |
| Comanche | 0.0 /100 | #285 | Tragic 16.2% |