European vs Immigrants from West Indies Female Poverty
COMPARE
European
Immigrants from West Indies
Female Poverty
Female Poverty Comparison
Europeans
Immigrants from West Indies
12.3%
FEMALE POVERTY
97.4/ 100
METRIC RATING
75th/ 347
METRIC RANK
16.1%
FEMALE POVERTY
0.0/ 100
METRIC RATING
278th/ 347
METRIC RANK
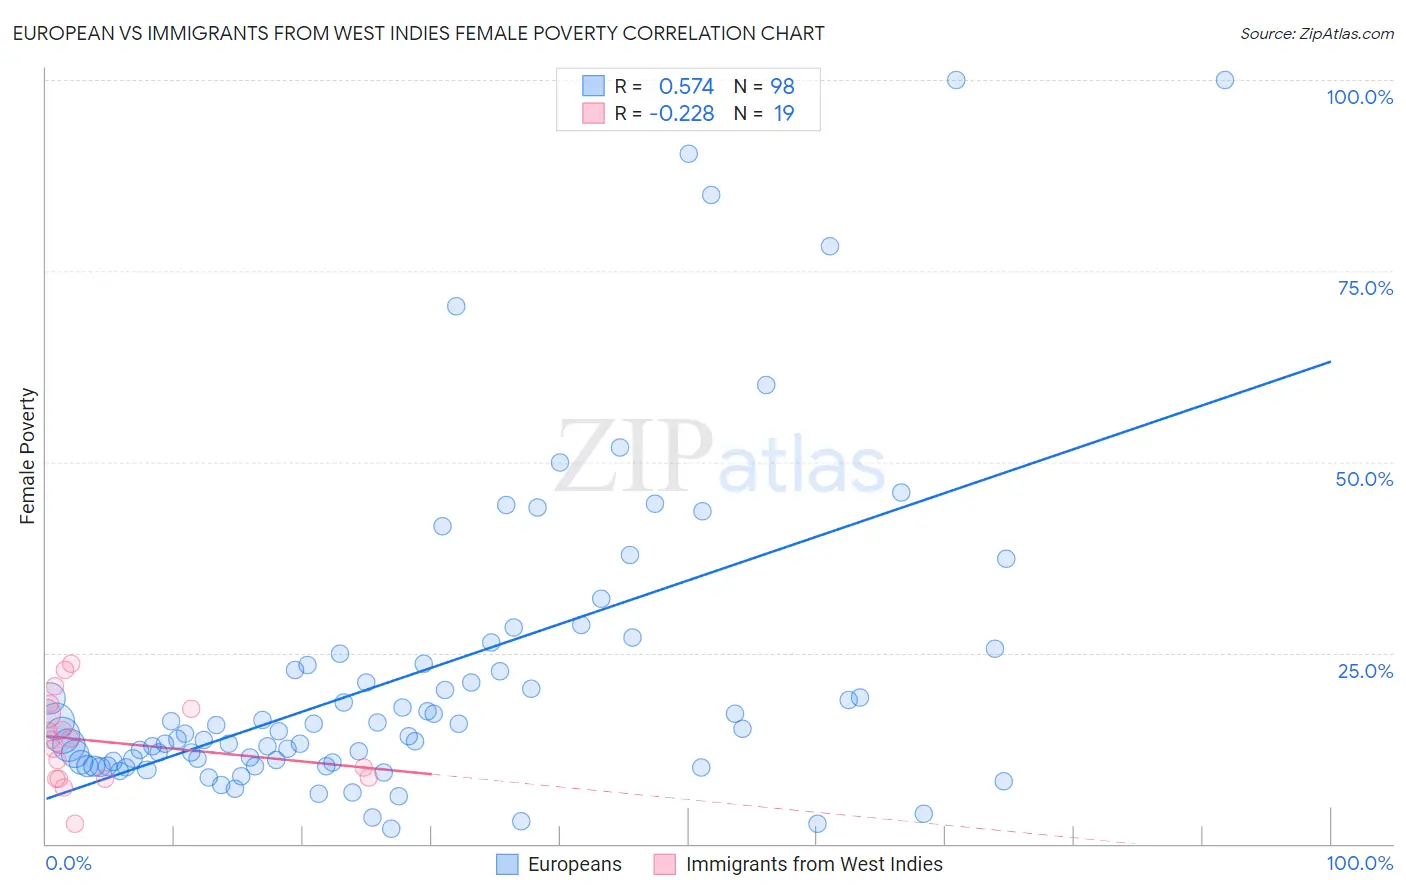
European vs Immigrants from West Indies Female Poverty Correlation Chart
The statistical analysis conducted on geographies consisting of 560,757,214 people shows a substantial positive correlation between the proportion of Europeans and poverty level among females in the United States with a correlation coefficient (R) of 0.574 and weighted average of 12.3%. Similarly, the statistical analysis conducted on geographies consisting of 72,454,628 people shows a weak negative correlation between the proportion of Immigrants from West Indies and poverty level among females in the United States with a correlation coefficient (R) of -0.228 and weighted average of 16.1%, a difference of 30.8%.
Female Poverty Correlation Summary
| Measurement | European | Immigrants from West Indies |
| Minimum | 1.9% | 2.6% |
| Maximum | 100.0% | 23.6% |
| Range | 98.1% | 21.0% |
| Mean | 22.2% | 13.4% |
| Median | 14.5% | 13.5% |
| Interquartile 25% (IQ1) | 10.7% | 8.5% |
| Interquartile 75% (IQ3) | 23.6% | 17.7% |
| Interquartile Range (IQR) | 12.9% | 9.2% |
| Standard Deviation (Sample) | 20.6% | 5.6% |
| Standard Deviation (Population) | 20.5% | 5.5% |
Similar Demographics by Female Poverty
Demographics Similar to Europeans by Female Poverty
In terms of female poverty, the demographic groups most similar to Europeans are Immigrants from Canada (12.3%, a difference of 0.12%), Zimbabwean (12.3%, a difference of 0.13%), Cambodian (12.2%, a difference of 0.15%), Immigrants from Eastern Europe (12.3%, a difference of 0.17%), and Carpatho Rusyn (12.2%, a difference of 0.18%).
| Demographics | Rating | Rank | Female Poverty |
| Immigrants | Netherlands | 97.8 /100 | #68 | Exceptional 12.2% |
| Swiss | 97.7 /100 | #69 | Exceptional 12.2% |
| Immigrants | Belgium | 97.7 /100 | #70 | Exceptional 12.2% |
| Carpatho Rusyns | 97.6 /100 | #71 | Exceptional 12.2% |
| Cambodians | 97.5 /100 | #72 | Exceptional 12.2% |
| Zimbabweans | 97.5 /100 | #73 | Exceptional 12.3% |
| Immigrants | Canada | 97.5 /100 | #74 | Exceptional 12.3% |
| Europeans | 97.4 /100 | #75 | Exceptional 12.3% |
| Immigrants | Eastern Europe | 97.2 /100 | #76 | Exceptional 12.3% |
| Serbians | 97.2 /100 | #77 | Exceptional 12.3% |
| Egyptians | 97.2 /100 | #78 | Exceptional 12.3% |
| Immigrants | North America | 97.1 /100 | #79 | Exceptional 12.3% |
| Slovaks | 97.1 /100 | #80 | Exceptional 12.3% |
| Immigrants | Sweden | 97.1 /100 | #81 | Exceptional 12.3% |
| Jordanians | 97.1 /100 | #82 | Exceptional 12.3% |
Demographics Similar to Immigrants from West Indies by Female Poverty
In terms of female poverty, the demographic groups most similar to Immigrants from West Indies are Immigrants from Bahamas (16.1%, a difference of 0.12%), Bangladeshi (16.0%, a difference of 0.31%), Vietnamese (16.1%, a difference of 0.35%), West Indian (16.1%, a difference of 0.37%), and Central American (16.0%, a difference of 0.50%).
| Demographics | Rating | Rank | Female Poverty |
| Immigrants | St. Vincent and the Grenadines | 0.0 /100 | #271 | Tragic 15.9% |
| Belizeans | 0.0 /100 | #272 | Tragic 15.9% |
| Haitians | 0.0 /100 | #273 | Tragic 15.9% |
| Barbadians | 0.0 /100 | #274 | Tragic 15.9% |
| Immigrants | Barbados | 0.0 /100 | #275 | Tragic 16.0% |
| Central Americans | 0.0 /100 | #276 | Tragic 16.0% |
| Bangladeshis | 0.0 /100 | #277 | Tragic 16.0% |
| Immigrants | West Indies | 0.0 /100 | #278 | Tragic 16.1% |
| Immigrants | Bahamas | 0.0 /100 | #279 | Tragic 16.1% |
| Vietnamese | 0.0 /100 | #280 | Tragic 16.1% |
| West Indians | 0.0 /100 | #281 | Tragic 16.1% |
| Immigrants | Haiti | 0.0 /100 | #282 | Tragic 16.1% |
| Immigrants | Cuba | 0.0 /100 | #283 | Tragic 16.1% |
| Spanish Americans | 0.0 /100 | #284 | Tragic 16.2% |
| Comanche | 0.0 /100 | #285 | Tragic 16.2% |