Turkish vs Immigrants from Uganda Female Poverty
COMPARE
Turkish
Immigrants from Uganda
Female Poverty
Female Poverty Comparison
Turks
Immigrants from Uganda
11.9%
FEMALE POVERTY
99.2/ 100
METRIC RATING
46th/ 347
METRIC RANK
13.7%
FEMALE POVERTY
28.5/ 100
METRIC RATING
198th/ 347
METRIC RANK
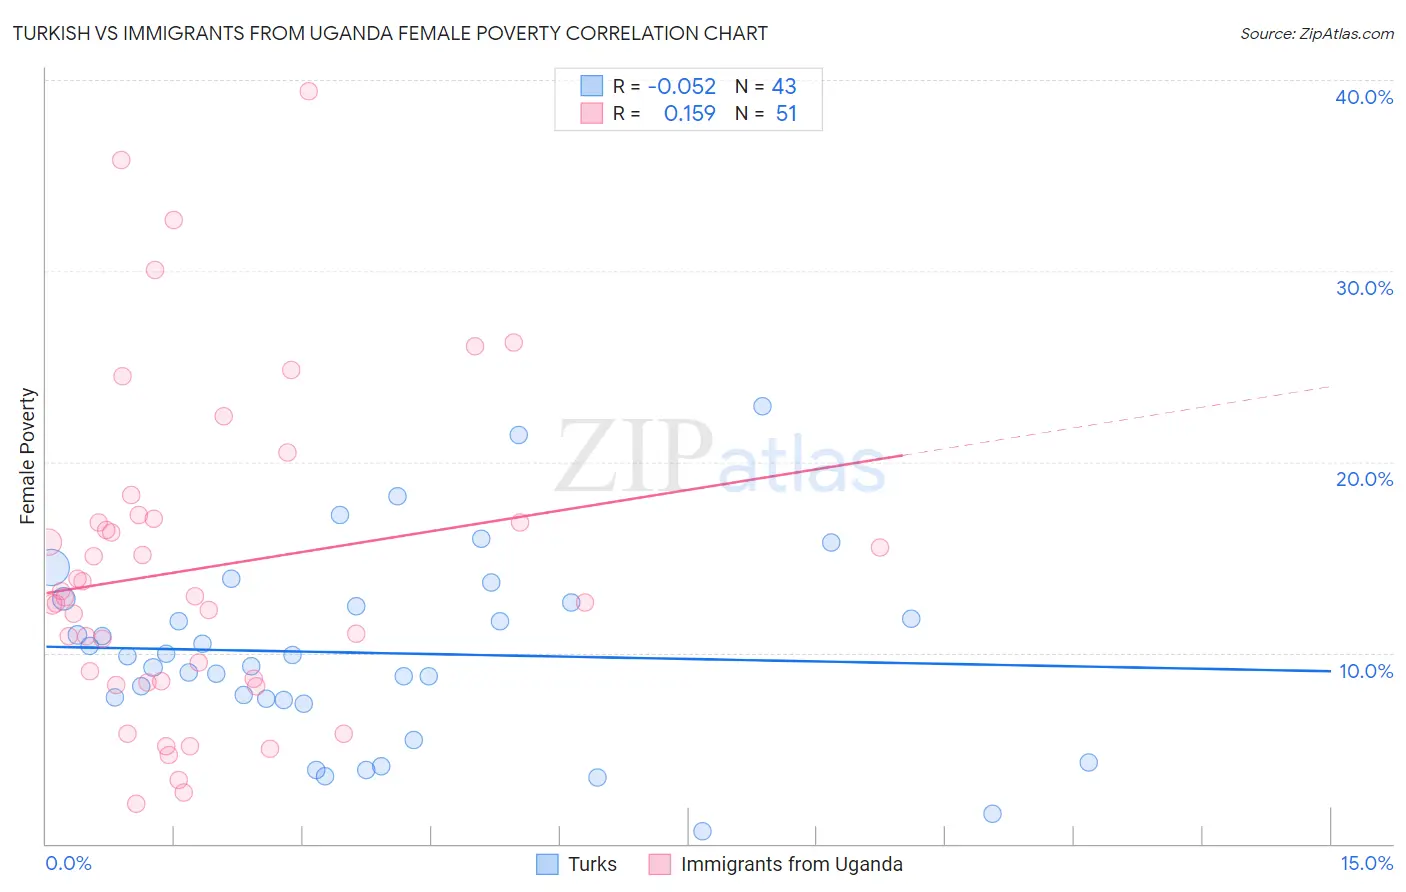
Turkish vs Immigrants from Uganda Female Poverty Correlation Chart
The statistical analysis conducted on geographies consisting of 271,658,978 people shows a slight negative correlation between the proportion of Turks and poverty level among females in the United States with a correlation coefficient (R) of -0.052 and weighted average of 11.9%. Similarly, the statistical analysis conducted on geographies consisting of 125,969,010 people shows a poor positive correlation between the proportion of Immigrants from Uganda and poverty level among females in the United States with a correlation coefficient (R) of 0.159 and weighted average of 13.7%, a difference of 15.5%.
Female Poverty Correlation Summary
| Measurement | Turkish | Immigrants from Uganda |
| Minimum | 0.67% | 2.1% |
| Maximum | 22.9% | 39.4% |
| Range | 22.2% | 37.3% |
| Mean | 10.0% | 14.4% |
| Median | 9.8% | 12.9% |
| Interquartile 25% (IQ1) | 7.5% | 8.5% |
| Interquartile 75% (IQ3) | 12.6% | 17.0% |
| Interquartile Range (IQR) | 5.1% | 8.5% |
| Standard Deviation (Sample) | 4.9% | 8.4% |
| Standard Deviation (Population) | 4.8% | 8.3% |
Similar Demographics by Female Poverty
Demographics Similar to Turks by Female Poverty
In terms of female poverty, the demographic groups most similar to Turks are Immigrants from Czechoslovakia (11.9%, a difference of 0.0%), Tongan (11.9%, a difference of 0.10%), Korean (11.9%, a difference of 0.16%), Czech (11.9%, a difference of 0.20%), and Immigrants from Moldova (11.9%, a difference of 0.20%).
| Demographics | Rating | Rank | Female Poverty |
| Immigrants | Poland | 99.3 /100 | #39 | Exceptional 11.8% |
| Macedonians | 99.3 /100 | #40 | Exceptional 11.8% |
| Czechs | 99.2 /100 | #41 | Exceptional 11.9% |
| Immigrants | Moldova | 99.2 /100 | #42 | Exceptional 11.9% |
| Koreans | 99.2 /100 | #43 | Exceptional 11.9% |
| Tongans | 99.2 /100 | #44 | Exceptional 11.9% |
| Immigrants | Czechoslovakia | 99.2 /100 | #45 | Exceptional 11.9% |
| Turks | 99.2 /100 | #46 | Exceptional 11.9% |
| Asians | 99.1 /100 | #47 | Exceptional 11.9% |
| Immigrants | Japan | 99.0 /100 | #48 | Exceptional 11.9% |
| Immigrants | Romania | 99.0 /100 | #49 | Exceptional 12.0% |
| Slovenes | 98.9 /100 | #50 | Exceptional 12.0% |
| Immigrants | Bulgaria | 98.9 /100 | #51 | Exceptional 12.0% |
| Immigrants | Croatia | 98.7 /100 | #52 | Exceptional 12.0% |
| Immigrants | Austria | 98.7 /100 | #53 | Exceptional 12.0% |
Demographics Similar to Immigrants from Uganda by Female Poverty
In terms of female poverty, the demographic groups most similar to Immigrants from Uganda are Arab (13.7%, a difference of 0.010%), South American Indian (13.7%, a difference of 0.060%), Immigrants from South America (13.7%, a difference of 0.25%), Delaware (13.7%, a difference of 0.30%), and Immigrants from Lebanon (13.8%, a difference of 0.34%).
| Demographics | Rating | Rank | Female Poverty |
| Immigrants | Kuwait | 32.7 /100 | #191 | Fair 13.7% |
| Immigrants | Costa Rica | 31.9 /100 | #192 | Fair 13.7% |
| Iraqis | 31.8 /100 | #193 | Fair 13.7% |
| Delaware | 31.1 /100 | #194 | Fair 13.7% |
| Immigrants | South America | 30.6 /100 | #195 | Fair 13.7% |
| South American Indians | 28.9 /100 | #196 | Fair 13.7% |
| Arabs | 28.6 /100 | #197 | Fair 13.7% |
| Immigrants | Uganda | 28.5 /100 | #198 | Fair 13.7% |
| Immigrants | Lebanon | 25.6 /100 | #199 | Fair 13.8% |
| Spanish | 21.4 /100 | #200 | Fair 13.9% |
| Immigrants | Kenya | 21.1 /100 | #201 | Fair 13.9% |
| Hmong | 21.1 /100 | #202 | Fair 13.9% |
| Immigrants | Western Asia | 20.7 /100 | #203 | Fair 13.9% |
| Spaniards | 18.9 /100 | #204 | Poor 13.9% |
| Ugandans | 15.4 /100 | #205 | Poor 14.0% |