Tlingit-Haida vs Cheyenne Child Poverty Among Girls Under 16
COMPARE
Tlingit-Haida
Cheyenne
Child Poverty Among Girls Under 16
Child Poverty Among Girls Under 16 Comparison
Tlingit-Haida
Cheyenne
14.7%
CHILD POVERTY AMONG GIRLS UNDER 16
97.9/ 100
METRIC RATING
77th/ 347
METRIC RANK
26.3%
CHILD POVERTY AMONG GIRLS UNDER 16
0.0/ 100
METRIC RATING
338th/ 347
METRIC RANK
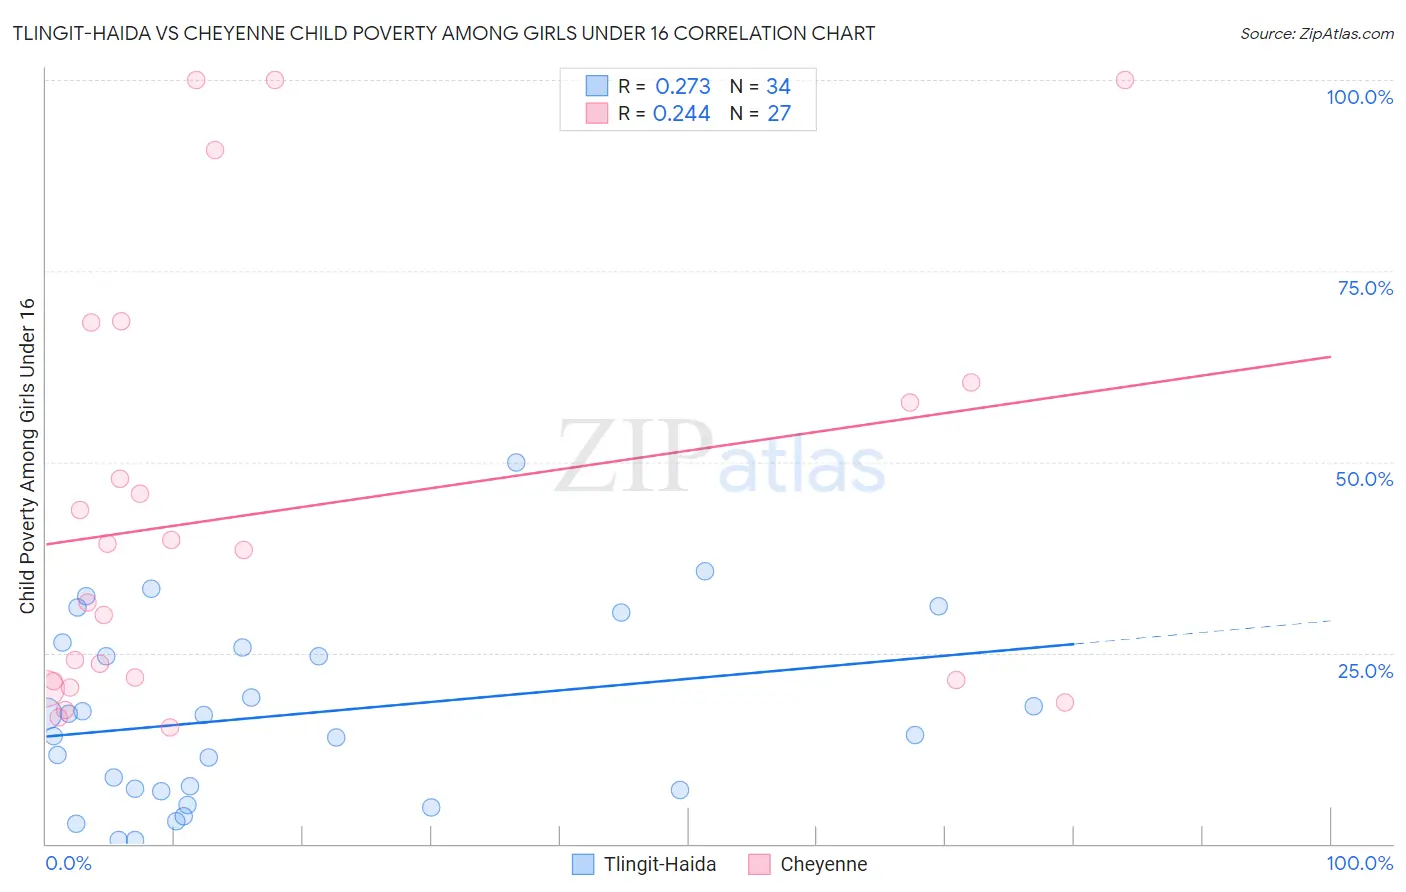
Tlingit-Haida vs Cheyenne Child Poverty Among Girls Under 16 Correlation Chart
The statistical analysis conducted on geographies consisting of 60,606,017 people shows a weak positive correlation between the proportion of Tlingit-Haida and poverty level among girls under the age of 16 in the United States with a correlation coefficient (R) of 0.273 and weighted average of 14.7%. Similarly, the statistical analysis conducted on geographies consisting of 80,342,731 people shows a weak positive correlation between the proportion of Cheyenne and poverty level among girls under the age of 16 in the United States with a correlation coefficient (R) of 0.244 and weighted average of 26.3%, a difference of 79.3%.
Child Poverty Among Girls Under 16 Correlation Summary
| Measurement | Tlingit-Haida | Cheyenne |
| Minimum | 0.43% | 15.2% |
| Maximum | 50.0% | 100.0% |
| Range | 49.6% | 84.8% |
| Mean | 16.8% | 43.8% |
| Median | 15.6% | 38.5% |
| Interquartile 25% (IQ1) | 7.0% | 21.3% |
| Interquartile 75% (IQ3) | 25.7% | 60.4% |
| Interquartile Range (IQR) | 18.7% | 39.1% |
| Standard Deviation (Sample) | 12.0% | 27.8% |
| Standard Deviation (Population) | 11.8% | 27.3% |
Similar Demographics by Child Poverty Among Girls Under 16
Demographics Similar to Tlingit-Haida by Child Poverty Among Girls Under 16
In terms of child poverty among girls under 16, the demographic groups most similar to Tlingit-Haida are Immigrants from Russia (14.7%, a difference of 0.010%), Argentinean (14.7%, a difference of 0.010%), Immigrants from Turkey (14.7%, a difference of 0.020%), Egyptian (14.7%, a difference of 0.030%), and Immigrants from Eastern Europe (14.6%, a difference of 0.16%).
| Demographics | Rating | Rank | Child Poverty Among Girls Under 16 |
| Europeans | 98.1 /100 | #70 | Exceptional 14.6% |
| Slovenes | 98.1 /100 | #71 | Exceptional 14.6% |
| Immigrants | Netherlands | 98.1 /100 | #72 | Exceptional 14.6% |
| Immigrants | Austria | 98.0 /100 | #73 | Exceptional 14.6% |
| Taiwanese | 98.0 /100 | #74 | Exceptional 14.6% |
| Immigrants | Eastern Europe | 98.0 /100 | #75 | Exceptional 14.6% |
| Immigrants | Russia | 97.9 /100 | #76 | Exceptional 14.7% |
| Tlingit-Haida | 97.9 /100 | #77 | Exceptional 14.7% |
| Argentineans | 97.9 /100 | #78 | Exceptional 14.7% |
| Immigrants | Turkey | 97.9 /100 | #79 | Exceptional 14.7% |
| Egyptians | 97.9 /100 | #80 | Exceptional 14.7% |
| Ukrainians | 97.7 /100 | #81 | Exceptional 14.7% |
| Macedonians | 97.6 /100 | #82 | Exceptional 14.7% |
| Immigrants | Italy | 97.4 /100 | #83 | Exceptional 14.8% |
| Soviet Union | 97.3 /100 | #84 | Exceptional 14.8% |
Demographics Similar to Cheyenne by Child Poverty Among Girls Under 16
In terms of child poverty among girls under 16, the demographic groups most similar to Cheyenne are Crow (26.4%, a difference of 0.34%), Yup'ik (25.8%, a difference of 1.8%), Sioux (25.6%, a difference of 2.7%), Yuman (27.1%, a difference of 3.1%), and Pueblo (25.2%, a difference of 4.3%).
| Demographics | Rating | Rank | Child Poverty Among Girls Under 16 |
| Apache | 0.0 /100 | #331 | Tragic 23.8% |
| Natives/Alaskans | 0.0 /100 | #332 | Tragic 24.0% |
| Blacks/African Americans | 0.0 /100 | #333 | Tragic 24.7% |
| Menominee | 0.0 /100 | #334 | Tragic 25.0% |
| Pueblo | 0.0 /100 | #335 | Tragic 25.2% |
| Sioux | 0.0 /100 | #336 | Tragic 25.6% |
| Yup'ik | 0.0 /100 | #337 | Tragic 25.8% |
| Cheyenne | 0.0 /100 | #338 | Tragic 26.3% |
| Crow | 0.0 /100 | #339 | Tragic 26.4% |
| Yuman | 0.0 /100 | #340 | Tragic 27.1% |
| Hopi | 0.0 /100 | #341 | Tragic 27.9% |
| Pima | 0.0 /100 | #342 | Tragic 28.2% |
| Immigrants | Yemen | 0.0 /100 | #343 | Tragic 29.5% |
| Navajo | 0.0 /100 | #344 | Tragic 30.5% |
| Lumbee | 0.0 /100 | #345 | Tragic 30.7% |