Australian vs Immigrants from Morocco Single Female Poverty
COMPARE
Australian
Immigrants from Morocco
Single Female Poverty
Single Female Poverty Comparison
Australians
Immigrants from Morocco
20.3%
SINGLE FEMALE POVERTY
88.4/ 100
METRIC RATING
143rd/ 347
METRIC RANK
20.2%
SINGLE FEMALE POVERTY
92.4/ 100
METRIC RATING
129th/ 347
METRIC RANK
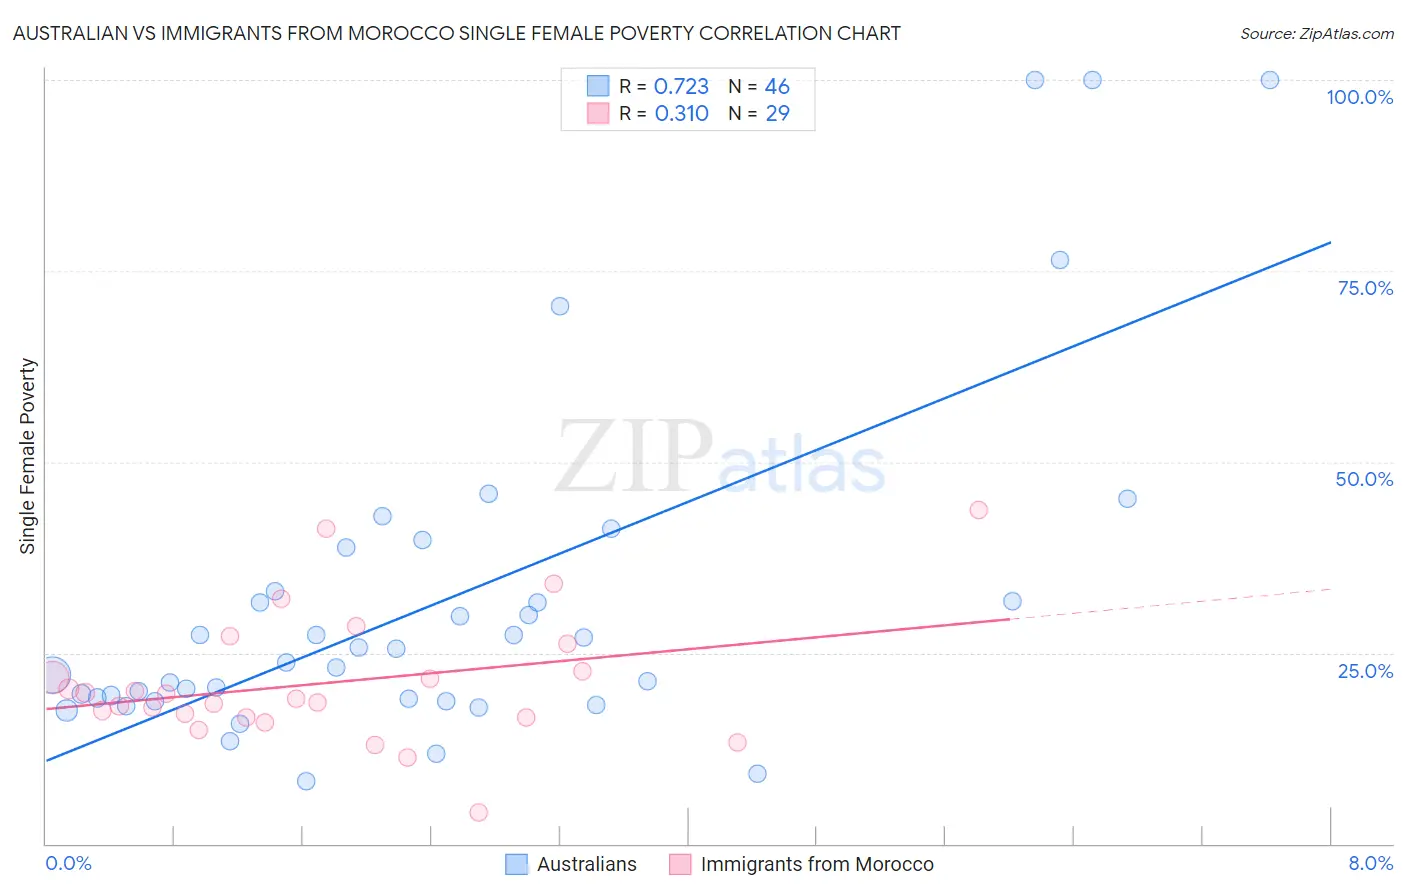
Australian vs Immigrants from Morocco Single Female Poverty Correlation Chart
The statistical analysis conducted on geographies consisting of 221,875,753 people shows a strong positive correlation between the proportion of Australians and poverty level among single females in the United States with a correlation coefficient (R) of 0.723 and weighted average of 20.3%. Similarly, the statistical analysis conducted on geographies consisting of 177,779,990 people shows a mild positive correlation between the proportion of Immigrants from Morocco and poverty level among single females in the United States with a correlation coefficient (R) of 0.310 and weighted average of 20.2%, a difference of 0.77%.
Single Female Poverty Correlation Summary
| Measurement | Australian | Immigrants from Morocco |
| Minimum | 8.1% | 4.1% |
| Maximum | 100.0% | 43.8% |
| Range | 91.9% | 39.6% |
| Mean | 31.8% | 21.0% |
| Median | 24.7% | 18.9% |
| Interquartile 25% (IQ1) | 19.0% | 16.5% |
| Interquartile 75% (IQ3) | 33.1% | 24.4% |
| Interquartile Range (IQR) | 14.1% | 7.9% |
| Standard Deviation (Sample) | 22.6% | 8.5% |
| Standard Deviation (Population) | 22.4% | 8.4% |
Demographics Similar to Australians and Immigrants from Morocco by Single Female Poverty
In terms of single female poverty, the demographic groups most similar to Australians are Immigrants from Uzbekistan (20.3%, a difference of 0.010%), Immigrants from Uganda (20.3%, a difference of 0.12%), Immigrants from North America (20.3%, a difference of 0.19%), Syrian (20.3%, a difference of 0.34%), and Immigrants from Kuwait (20.3%, a difference of 0.35%). Similarly, the demographic groups most similar to Immigrants from Morocco are Immigrants from Hungary (20.2%, a difference of 0.030%), Immigrants from Spain (20.2%, a difference of 0.080%), Pakistani (20.2%, a difference of 0.080%), Uruguayan (20.2%, a difference of 0.080%), and Immigrants from England (20.2%, a difference of 0.11%).
| Demographics | Rating | Rank | Single Female Poverty |
| Serbians | 93.3 /100 | #126 | Exceptional 20.1% |
| Mongolians | 93.2 /100 | #127 | Exceptional 20.2% |
| Immigrants | Spain | 92.7 /100 | #128 | Exceptional 20.2% |
| Immigrants | Morocco | 92.4 /100 | #129 | Exceptional 20.2% |
| Immigrants | Hungary | 92.3 /100 | #130 | Exceptional 20.2% |
| Pakistanis | 92.1 /100 | #131 | Exceptional 20.2% |
| Uruguayans | 92.1 /100 | #132 | Exceptional 20.2% |
| Immigrants | England | 91.9 /100 | #133 | Exceptional 20.2% |
| Immigrants | Venezuela | 91.5 /100 | #134 | Exceptional 20.2% |
| Immigrants | Iraq | 91.2 /100 | #135 | Exceptional 20.2% |
| Immigrants | Canada | 91.2 /100 | #136 | Exceptional 20.2% |
| Immigrants | Nepal | 90.6 /100 | #137 | Exceptional 20.3% |
| Slovenes | 90.5 /100 | #138 | Exceptional 20.3% |
| Immigrants | Kuwait | 90.4 /100 | #139 | Exceptional 20.3% |
| Syrians | 90.4 /100 | #140 | Exceptional 20.3% |
| Immigrants | North America | 89.5 /100 | #141 | Excellent 20.3% |
| Immigrants | Uganda | 89.1 /100 | #142 | Excellent 20.3% |
| Australians | 88.4 /100 | #143 | Excellent 20.3% |
| Immigrants | Uzbekistan | 88.3 /100 | #144 | Excellent 20.3% |
| Austrians | 85.8 /100 | #145 | Excellent 20.4% |
| Venezuelans | 85.5 /100 | #146 | Excellent 20.4% |