Ghanaian vs South African Family Poverty
COMPARE
Ghanaian
South African
Family Poverty
Family Poverty Comparison
Ghanaians
South Africans
10.3%
FAMILY POVERTY
1.3/ 100
METRIC RATING
241st/ 347
METRIC RANK
8.2%
FAMILY POVERTY
93.4/ 100
METRIC RATING
116th/ 347
METRIC RANK
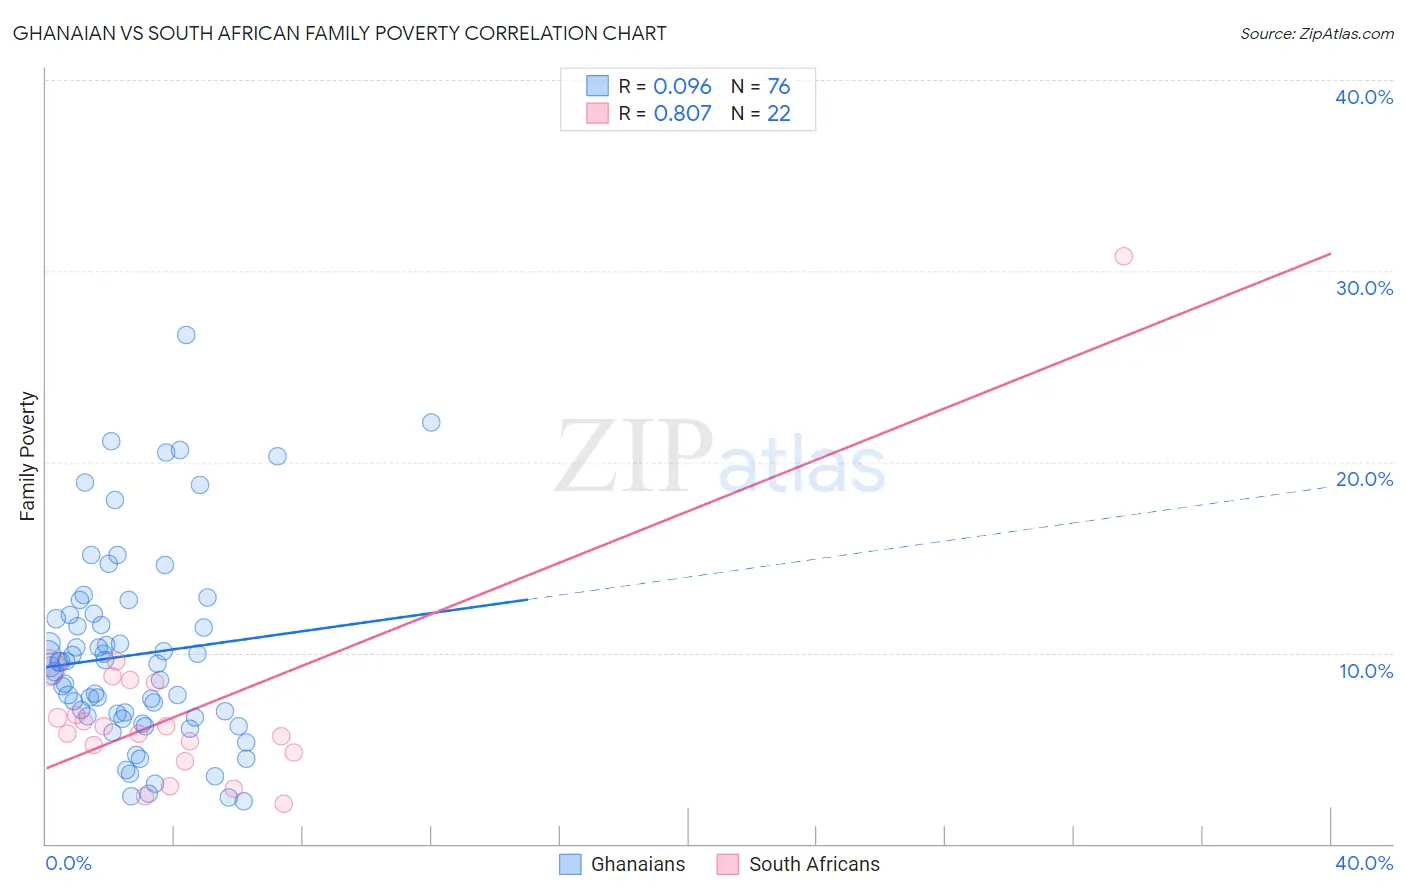
Ghanaian vs South African Family Poverty Correlation Chart
The statistical analysis conducted on geographies consisting of 190,166,438 people shows a slight positive correlation between the proportion of Ghanaians and poverty level among families in the United States with a correlation coefficient (R) of 0.096 and weighted average of 10.3%. Similarly, the statistical analysis conducted on geographies consisting of 182,354,069 people shows a very strong positive correlation between the proportion of South Africans and poverty level among families in the United States with a correlation coefficient (R) of 0.807 and weighted average of 8.2%, a difference of 24.9%.
Family Poverty Correlation Summary
| Measurement | Ghanaian | South African |
| Minimum | 2.3% | 2.1% |
| Maximum | 26.7% | 30.8% |
| Range | 24.4% | 28.7% |
| Mean | 9.9% | 7.0% |
| Median | 9.3% | 6.0% |
| Interquartile 25% (IQ1) | 6.6% | 4.8% |
| Interquartile 75% (IQ3) | 11.9% | 8.4% |
| Interquartile Range (IQR) | 5.3% | 3.7% |
| Standard Deviation (Sample) | 5.1% | 5.7% |
| Standard Deviation (Population) | 5.1% | 5.6% |
Similar Demographics by Family Poverty
Demographics Similar to Ghanaians by Family Poverty
In terms of family poverty, the demographic groups most similar to Ghanaians are Immigrants from the Azores (10.3%, a difference of 0.090%), Potawatomi (10.2%, a difference of 0.39%), French American Indian (10.2%, a difference of 0.43%), Immigrants from Laos (10.2%, a difference of 0.80%), and Alaska Native (10.4%, a difference of 0.86%).
| Demographics | Rating | Rank | Family Poverty |
| Immigrants | Middle Africa | 2.1 /100 | #234 | Tragic 10.1% |
| Nigerians | 2.0 /100 | #235 | Tragic 10.1% |
| Immigrants | Nigeria | 1.9 /100 | #236 | Tragic 10.2% |
| Immigrants | Laos | 1.7 /100 | #237 | Tragic 10.2% |
| French American Indians | 1.5 /100 | #238 | Tragic 10.2% |
| Potawatomi | 1.5 /100 | #239 | Tragic 10.2% |
| Immigrants | Azores | 1.4 /100 | #240 | Tragic 10.3% |
| Ghanaians | 1.3 /100 | #241 | Tragic 10.3% |
| Alaska Natives | 1.0 /100 | #242 | Tragic 10.4% |
| Nepalese | 0.8 /100 | #243 | Tragic 10.4% |
| Cree | 0.7 /100 | #244 | Tragic 10.5% |
| Immigrants | Burma/Myanmar | 0.6 /100 | #245 | Tragic 10.5% |
| Cherokee | 0.5 /100 | #246 | Tragic 10.6% |
| Liberians | 0.4 /100 | #247 | Tragic 10.6% |
| Nicaraguans | 0.4 /100 | #248 | Tragic 10.6% |
Demographics Similar to South Africans by Family Poverty
In terms of family poverty, the demographic groups most similar to South Africans are Immigrants from Israel (8.2%, a difference of 0.060%), Immigrants from Russia (8.2%, a difference of 0.070%), Immigrants from Western Europe (8.2%, a difference of 0.26%), French (8.3%, a difference of 0.33%), and Immigrants from Zimbabwe (8.2%, a difference of 0.41%).
| Demographics | Rating | Rank | Family Poverty |
| Jordanians | 94.8 /100 | #109 | Exceptional 8.2% |
| Romanians | 94.7 /100 | #110 | Exceptional 8.2% |
| Taiwanese | 94.6 /100 | #111 | Exceptional 8.2% |
| Immigrants | France | 94.4 /100 | #112 | Exceptional 8.2% |
| Canadians | 94.2 /100 | #113 | Exceptional 8.2% |
| Immigrants | Zimbabwe | 94.0 /100 | #114 | Exceptional 8.2% |
| Immigrants | Israel | 93.5 /100 | #115 | Exceptional 8.2% |
| South Africans | 93.4 /100 | #116 | Exceptional 8.2% |
| Immigrants | Russia | 93.2 /100 | #117 | Exceptional 8.2% |
| Immigrants | Western Europe | 92.9 /100 | #118 | Exceptional 8.2% |
| French | 92.8 /100 | #119 | Exceptional 8.3% |
| Immigrants | Egypt | 91.6 /100 | #120 | Exceptional 8.3% |
| Native Hawaiians | 91.3 /100 | #121 | Exceptional 8.3% |
| Paraguayans | 91.2 /100 | #122 | Exceptional 8.3% |
| Palestinians | 91.1 /100 | #123 | Exceptional 8.3% |