Swiss vs Immigrants from Iran Male Poverty
COMPARE
Swiss
Immigrants from Iran
Male Poverty
Male Poverty Comparison
Swiss
Immigrants from Iran
10.2%
MALE POVERTY
97.5/ 100
METRIC RATING
64th/ 347
METRIC RANK
9.9%
MALE POVERTY
99.1/ 100
METRIC RATING
42nd/ 347
METRIC RANK
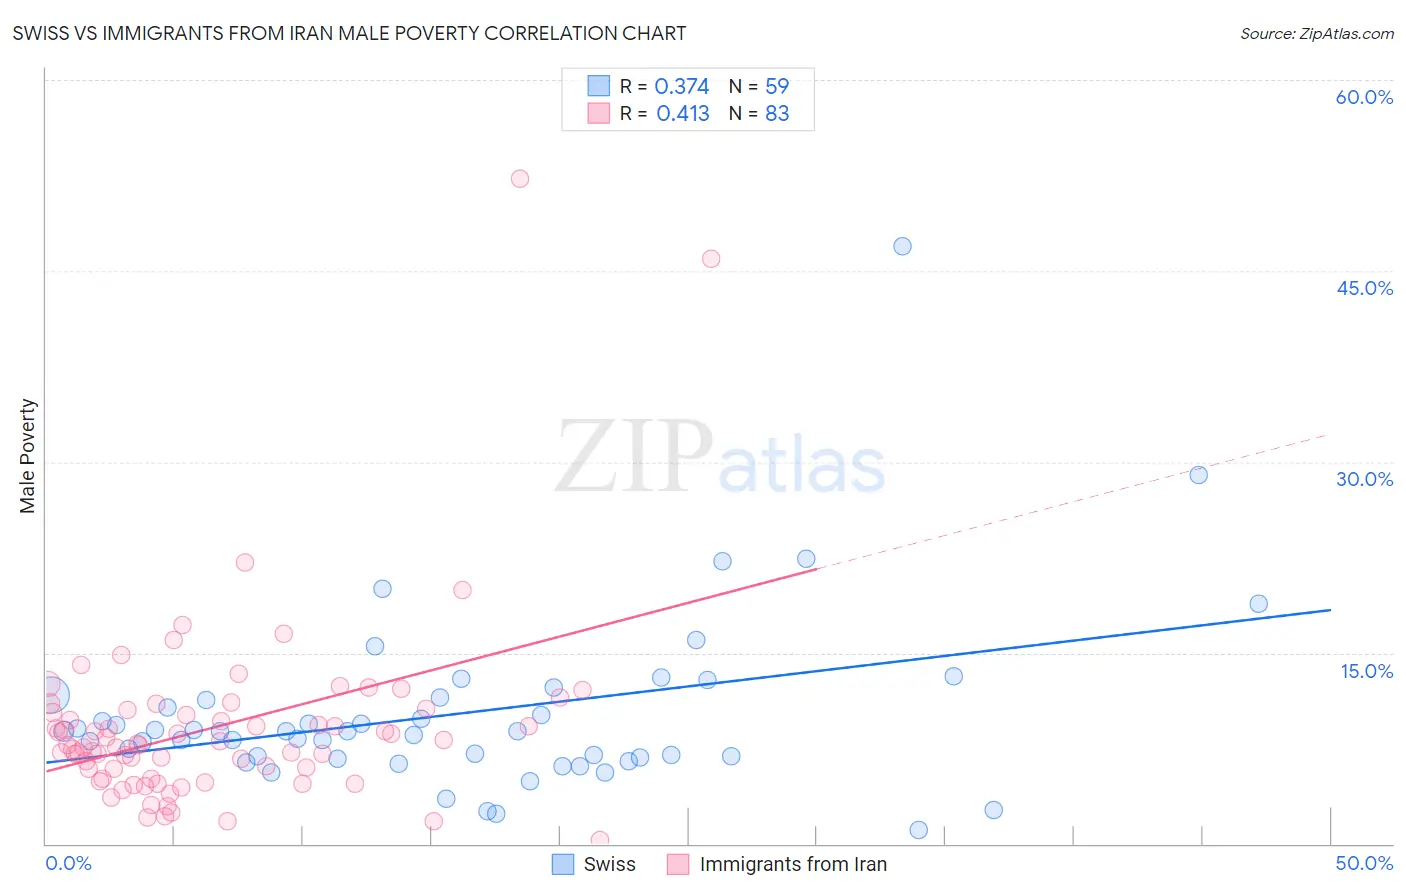
Swiss vs Immigrants from Iran Male Poverty Correlation Chart
The statistical analysis conducted on geographies consisting of 464,423,995 people shows a mild positive correlation between the proportion of Swiss and poverty level among males in the United States with a correlation coefficient (R) of 0.374 and weighted average of 10.2%. Similarly, the statistical analysis conducted on geographies consisting of 279,773,882 people shows a moderate positive correlation between the proportion of Immigrants from Iran and poverty level among males in the United States with a correlation coefficient (R) of 0.413 and weighted average of 9.9%, a difference of 2.9%.
Male Poverty Correlation Summary
| Measurement | Swiss | Immigrants from Iran |
| Minimum | 1.1% | 0.33% |
| Maximum | 47.0% | 52.3% |
| Range | 45.9% | 51.9% |
| Mean | 10.2% | 9.2% |
| Median | 8.8% | 7.8% |
| Interquartile 25% (IQ1) | 6.8% | 5.1% |
| Interquartile 75% (IQ3) | 11.4% | 10.5% |
| Interquartile Range (IQR) | 4.7% | 5.4% |
| Standard Deviation (Sample) | 7.0% | 7.5% |
| Standard Deviation (Population) | 6.9% | 7.4% |
Similar Demographics by Male Poverty
Demographics Similar to Swiss by Male Poverty
In terms of male poverty, the demographic groups most similar to Swiss are Zimbabwean (10.2%, a difference of 0.070%), Serbian (10.2%, a difference of 0.080%), Slovak (10.2%, a difference of 0.24%), Immigrants from Netherlands (10.2%, a difference of 0.25%), and Immigrants from Italy (10.2%, a difference of 0.28%).
| Demographics | Rating | Rank | Male Poverty |
| Estonians | 98.1 /100 | #57 | Exceptional 10.1% |
| Scandinavians | 98.0 /100 | #58 | Exceptional 10.1% |
| Immigrants | Europe | 97.9 /100 | #59 | Exceptional 10.1% |
| Ukrainians | 97.9 /100 | #60 | Exceptional 10.1% |
| Austrians | 97.8 /100 | #61 | Exceptional 10.1% |
| Immigrants | Italy | 97.8 /100 | #62 | Exceptional 10.2% |
| Slovaks | 97.7 /100 | #63 | Exceptional 10.2% |
| Swiss | 97.5 /100 | #64 | Exceptional 10.2% |
| Zimbabweans | 97.5 /100 | #65 | Exceptional 10.2% |
| Serbians | 97.5 /100 | #66 | Exceptional 10.2% |
| Immigrants | Netherlands | 97.3 /100 | #67 | Exceptional 10.2% |
| Immigrants | Sri Lanka | 97.2 /100 | #68 | Exceptional 10.2% |
| Immigrants | Australia | 97.1 /100 | #69 | Exceptional 10.2% |
| Paraguayans | 97.1 /100 | #70 | Exceptional 10.2% |
| Europeans | 97.1 /100 | #71 | Exceptional 10.2% |
Demographics Similar to Immigrants from Iran by Male Poverty
In terms of male poverty, the demographic groups most similar to Immigrants from Iran are Korean (9.9%, a difference of 0.24%), Immigrants from Moldova (9.9%, a difference of 0.26%), Cypriot (9.9%, a difference of 0.34%), Immigrants from Pakistan (9.9%, a difference of 0.42%), and Russian (9.9%, a difference of 0.42%).
| Demographics | Rating | Rank | Male Poverty |
| Iranians | 99.4 /100 | #35 | Exceptional 9.8% |
| Czechs | 99.4 /100 | #36 | Exceptional 9.8% |
| Immigrants | Greece | 99.3 /100 | #37 | Exceptional 9.8% |
| Immigrants | Pakistan | 99.2 /100 | #38 | Exceptional 9.9% |
| Russians | 99.2 /100 | #39 | Exceptional 9.9% |
| Cypriots | 99.2 /100 | #40 | Exceptional 9.9% |
| Koreans | 99.2 /100 | #41 | Exceptional 9.9% |
| Immigrants | Iran | 99.1 /100 | #42 | Exceptional 9.9% |
| Immigrants | Moldova | 99.0 /100 | #43 | Exceptional 9.9% |
| Immigrants | Romania | 98.9 /100 | #44 | Exceptional 9.9% |
| Immigrants | Serbia | 98.9 /100 | #45 | Exceptional 10.0% |
| Turks | 98.9 /100 | #46 | Exceptional 10.0% |
| Immigrants | Singapore | 98.8 /100 | #47 | Exceptional 10.0% |
| Immigrants | Japan | 98.8 /100 | #48 | Exceptional 10.0% |
| Slovenes | 98.8 /100 | #49 | Exceptional 10.0% |