Alsatian vs Immigrants from Iran Male Poverty

COMPARE

Alsatian
Race
Ancestry
AfghanAfricanAlaska NativeAlaskan AthabascanAlbanianAleutAlsatianAmericanApacheArabArapahoArgentineanArmenianAssyrian/Chaldean/SyriacAustralianAustrianBahamianBangladeshiBarbadianBasqueBelgianBelizeanBermudanBhutaneseBlackfeetBolivianBrazilianBritishBritish West IndianBulgarianBurmeseCajunCambodianCanadianCape VerdeanCarpatho RusynCelticCentral AmericanCentral American IndianCherokeeCheyenneChickasawChileanChineseChippewaChoctawColombianColvilleComancheCosta RicanCreeCreekCroatianCrowCubanCypriotCzechCzechoslovakianDanishDelawareDominicanDutchDutch West IndianEastern EuropeanEcuadorianEgyptianEnglishEstonianEthiopianEuropeanFijianFilipinoFinnishFrenchFrench American IndianFrench CanadianGermanGerman RussianGhanaianGreekGuamanian/ChamorroGuatemalanGuyaneseHaitianHmongHonduranHopiHoumaHungarianIcelanderIndian (Asian)IndonesianInupiatIranianIraqiIrishIroquoisIsraeliItalianJamaicanJapaneseJordanianKenyanKiowaKoreanLaotianLatvianLebaneseLiberianLithuanianLumbeeLuxembourgerMacedonianMalaysianMalteseMarshalleseMenomineeMexicanMexican American IndianMongolianMoroccanNative HawaiianNavajoNepaleseNew ZealanderNicaraguanNigerianNorthern EuropeanNorwegianOkinawanOsageOttawaPaiutePakistaniPalestinianPanamanianParaguayanPennsylvania GermanPeruvianPimaPolishPortuguesePotawatomiPuebloPuerto RicanPuget Sound SalishRomanianRussianSalvadoranSamoanScandinavianScotch-IrishScottishSeminoleSenegaleseSerbianShoshoneSierra LeoneanSiouxSlavicSlovakSloveneSomaliSouth AfricanSouth AmericanSouth American IndianSoviet UnionSpaniardSpanishSpanish AmericanSpanish American IndianSri LankanSubsaharan AfricanSudaneseSwedishSwissSyrianTaiwaneseThaiTlingit-HaidaTohono O'OdhamTonganTrinidadian and TobagonianTsimshianTurkishU.S. Virgin IslanderUgandanUkrainianUruguayanUteVenezuelanVietnameseWelshWest IndianYakamaYaquiYugoslavianYumanYup'ikZimbabwean
Immigration
NonimmigrantsImmigrantsAfghanistanAfricaAlbaniaArgentinaArmeniaAsiaAustraliaAustriaBahamasBangladeshBarbadosBelarusBelgiumBelizeBoliviaBosnia and HerzegovinaBrazilBulgariaBurma/MyanmarCabo VerdeCambodiaCameroonCanadaCaribbeanCentral AmericaChileChinaColombiaCongoCosta RicaCroatiaCubaCzechoslovakiaDenmarkDominicaDominican RepublicEastern AfricaEastern AsiaEastern EuropeEcuadorEgyptEl SalvadorEnglandEritreaEthiopiaEuropeFijiFranceGermanyGhanaGreeceGrenadaGuatemalaGuyanaHaitiHondurasHong KongHungaryIndiaIndonesiaIraqIrelandIsraelItalyJamaicaJapanJordanKazakhstanKenyaKoreaKuwaitLaosLatin AmericaLatviaLebanonLiberiaLithuaniaMalaysiaMexicoMicronesiaMiddle AfricaMoldovaMoroccoNepalNetherlandsNicaraguaNigeriaNorth AmericaNorth MacedoniaNorthern AfricaNorthern EuropeNorwayOceaniaPakistanPanamaPeruPhilippinesPolandPortugalRomaniaRussiaSaudi ArabiaScotlandSenegalSerbiaSierra LeoneSingaporeSomaliaSouth AfricaSouth AmericaSouth Central AsiaSouth Eastern AsiaSouthern EuropeSpainSri LankaSt. Vincent and the GrenadinesSudanSwedenSwitzerlandSyriaTaiwanThailandTrinidad and TobagoTurkeyUgandaUkraineUruguayUzbekistanVenezuelaVietnamWest IndiesWestern AfricaWestern AsiaWestern EuropeYemenZaireZimbabweAzores
Immigrants from Iran
Race
Ancestry
AfghanAfricanAlaska NativeAlaskan AthabascanAlbanianAleutAmericanApacheArabArapahoArgentineanArmenianAssyrian/Chaldean/SyriacAustralianAustrianBahamianBangladeshiBarbadianBasqueBelgianBelizeanBermudanBhutaneseBlackfeetBolivianBrazilianBritishBritish West IndianBulgarianBurmeseCajunCambodianCanadianCape VerdeanCarpatho RusynCelticCentral AmericanCentral American IndianCherokeeCheyenneChickasawChileanChineseChippewaChoctawColombianColvilleComancheCosta RicanCreeCreekCroatianCrowCubanCypriotCzechCzechoslovakianDanishDelawareDominicanDutchDutch West IndianEastern EuropeanEcuadorianEgyptianEnglishEstonianEthiopianEuropeanFijianFilipinoFinnishFrenchFrench American IndianFrench CanadianGermanGerman RussianGhanaianGreekGuamanian/ChamorroGuatemalanGuyaneseHaitianHmongHonduranHopiHoumaHungarianIcelanderIndian (Asian)IndonesianInupiatIranianIraqiIrishIroquoisIsraeliItalianJamaicanJapaneseJordanianKenyanKiowaKoreanLaotianLatvianLebaneseLiberianLithuanianLumbeeLuxembourgerMacedonianMalaysianMalteseMarshalleseMenomineeMexicanMexican American IndianMongolianMoroccanNative HawaiianNavajoNepaleseNew ZealanderNicaraguanNigerianNorthern EuropeanNorwegianOkinawanOsageOttawaPaiutePakistaniPalestinianPanamanianParaguayanPennsylvania GermanPeruvianPimaPolishPortuguesePotawatomiPuebloPuerto RicanPuget Sound SalishRomanianRussianSalvadoranSamoanScandinavianScotch-IrishScottishSeminoleSenegaleseSerbianShoshoneSierra LeoneanSiouxSlavicSlovakSloveneSomaliSouth AfricanSouth AmericanSouth American IndianSoviet UnionSpaniardSpanishSpanish AmericanSpanish American IndianSri LankanSubsaharan AfricanSudaneseSwedishSwissSyrianTaiwaneseThaiTlingit-HaidaTohono O'OdhamTonganTrinidadian and TobagonianTsimshianTurkishU.S. Virgin IslanderUgandanUkrainianUruguayanUteVenezuelanVietnameseWelshWest IndianYakamaYaquiYugoslavianYumanYup'ikZimbabwean
Immigration
NonimmigrantsImmigrantsAfghanistanAfricaAlbaniaArgentinaArmeniaAsiaAustraliaAustriaBahamasBangladeshBarbadosBelarusBelgiumBelizeBoliviaBosnia and HerzegovinaBrazilBulgariaBurma/MyanmarCabo VerdeCambodiaCameroonCanadaCaribbeanCentral AmericaChileChinaColombiaCongoCosta RicaCroatiaCubaCzechoslovakiaDenmarkDominicaDominican RepublicEastern AfricaEastern AsiaEastern EuropeEcuadorEgyptEl SalvadorEnglandEritreaEthiopiaEuropeFijiFranceGermanyGhanaGreeceGrenadaGuatemalaGuyanaHaitiHondurasHong KongHungaryIndiaIndonesiaIranIraqIrelandIsraelItalyJamaicaJapanJordanKazakhstanKenyaKoreaKuwaitLaosLatin AmericaLatviaLebanonLiberiaLithuaniaMalaysiaMexicoMicronesiaMiddle AfricaMoldovaMoroccoNepalNetherlandsNicaraguaNigeriaNorth AmericaNorth MacedoniaNorthern AfricaNorthern EuropeNorwayOceaniaPakistanPanamaPeruPhilippinesPolandPortugalRomaniaRussiaSaudi ArabiaScotlandSenegalSerbiaSierra LeoneSingaporeSomaliaSouth AfricaSouth AmericaSouth Central AsiaSouth Eastern AsiaSouthern EuropeSpainSri LankaSt. Vincent and the GrenadinesSudanSwedenSwitzerlandSyriaTaiwanThailandTrinidad and TobagoTurkeyUgandaUkraineUruguayUzbekistanVenezuelaVietnamWest IndiesWestern AfricaWestern AsiaWestern EuropeYemenZaireZimbabweAzores
Male Poverty
Income
Poverty
Unemployment
Labor Participation
Family Structure
Vehicle Availability
Education Level
Disability

Male Poverty Comparison

Alsatians

Immigrants from Iran

Tragic
Exceptional
12.4%
MALE POVERTY
1.3/ 100
METRIC RATING
228th/ 347
METRIC RANK
9.9%
MALE POVERTY
99.1/ 100
METRIC RATING
42nd/ 347
METRIC RANK

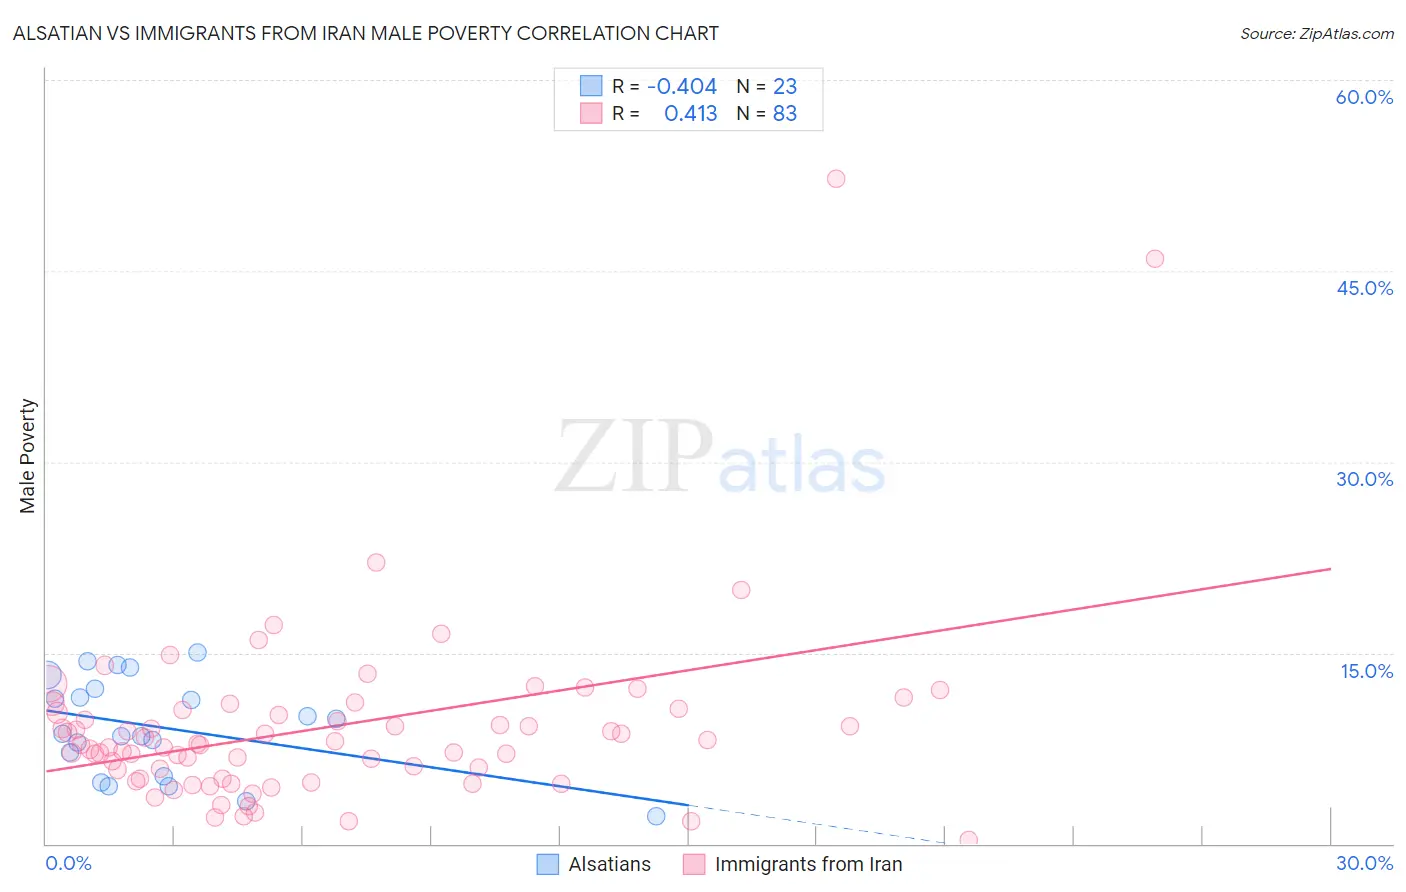
Alsatian vs Immigrants from Iran Male Poverty Correlation Chart

The statistical analysis conducted on geographies consisting of 82,673,926 people shows a moderate negative correlation between the proportion of Alsatians and poverty level among males in the United States with a correlation coefficient (R) of -0.404 and weighted average of 12.4%. Similarly, the statistical analysis conducted on geographies consisting of 279,773,882 people shows a moderate positive correlation between the proportion of Immigrants from Iran and poverty level among males in the United States with a correlation coefficient (R) of 0.413 and weighted average of 9.9%, a difference of 24.9%.
Alsatian vs Immigrants from Iran Male Poverty

Male Poverty Correlation Summary

MeasurementAlsatianImmigrants from Iran
Minimum2.1%0.33%
Maximum15.0%52.3%
Range12.9%51.9%
Mean9.1%9.2%
Median8.6%7.8%
Interquartile 25% (IQ1)5.3%5.1%
Interquartile 75% (IQ3)12.2%10.5%
Interquartile Range (IQR)6.9%5.4%
Standard Deviation (Sample)3.8%7.5%
Standard Deviation (Population)3.7%7.4%

Similar Demographics by Male Poverty

Demographics Similar to Alsatians by Male Poverty

In terms of male poverty, the demographic groups most similar to Alsatians are Alaska Native (12.4%, a difference of 0.040%), Cuban (12.4%, a difference of 0.090%), Nigerian (12.3%, a difference of 0.13%), Osage (12.3%, a difference of 0.30%), and Immigrants from Nigeria (12.3%, a difference of 0.36%).
DemographicsRating | RankMale Poverty
Ugandans
2.2
/100
|
#221
Tragic
12.2%
Immigrants | Africa
2.1
/100
|
#222
Tragic
12.2%
Immigrants | Micronesia
2.1
/100
|
#223
Tragic
12.2%
Immigrants | Nigeria
1.6
/100
|
#224
Tragic
12.3%
Osage
1.5
/100
|
#225
Tragic
12.3%
Nigerians
1.4
/100
|
#226
Tragic
12.3%
Alaska Natives
1.4
/100
|
#227
Tragic
12.4%
Alsatians
1.3
/100
|
#228
Tragic
12.4%
Cubans
1.3
/100
|
#229
Tragic
12.4%
Marshallese
0.8
/100
|
#230
Tragic
12.5%
Salvadorans
0.6
/100
|
#231
Tragic
12.6%
Nicaraguans
0.6
/100
|
#232
Tragic
12.6%
Fijians
0.6
/100
|
#233
Tragic
12.6%
Immigrants | Armenia
0.6
/100
|
#234
Tragic
12.6%
Immigrants | Laos
0.5
/100
|
#235
Tragic
12.6%

Demographics Similar to Immigrants from Iran by Male Poverty

In terms of male poverty, the demographic groups most similar to Immigrants from Iran are Korean (9.9%, a difference of 0.24%), Immigrants from Moldova (9.9%, a difference of 0.26%), Cypriot (9.9%, a difference of 0.34%), Immigrants from Pakistan (9.9%, a difference of 0.42%), and Russian (9.9%, a difference of 0.42%).
DemographicsRating | RankMale Poverty
Iranians
99.4
/100
|
#35
Exceptional
9.8%
Czechs
99.4
/100
|
#36
Exceptional
9.8%
Immigrants | Greece
99.3
/100
|
#37
Exceptional
9.8%
Immigrants | Pakistan
99.2
/100
|
#38
Exceptional
9.9%
Russians
99.2
/100
|
#39
Exceptional
9.9%
Cypriots
99.2
/100
|
#40
Exceptional
9.9%
Koreans
99.2
/100
|
#41
Exceptional
9.9%
Immigrants | Iran
99.1
/100
|
#42
Exceptional
9.9%
Immigrants | Moldova
99.0
/100
|
#43
Exceptional
9.9%
Immigrants | Romania
98.9
/100
|
#44
Exceptional
9.9%
Immigrants | Serbia
98.9
/100
|
#45
Exceptional
10.0%
Turks
98.9
/100
|
#46
Exceptional
10.0%
Immigrants | Singapore
98.8
/100
|
#47
Exceptional
10.0%
Immigrants | Japan
98.8
/100
|
#48
Exceptional
10.0%
Slovenes
98.8
/100
|
#49
Exceptional
10.0%