Bolivian vs Immigrants from Eritrea Female Poverty
COMPARE
Bolivian
Immigrants from Eritrea
Female Poverty
Female Poverty Comparison
Bolivians
Immigrants from Eritrea
11.5%
FEMALE POVERTY
99.8/ 100
METRIC RATING
17th/ 347
METRIC RANK
14.6%
FEMALE POVERTY
2.4/ 100
METRIC RATING
226th/ 347
METRIC RANK
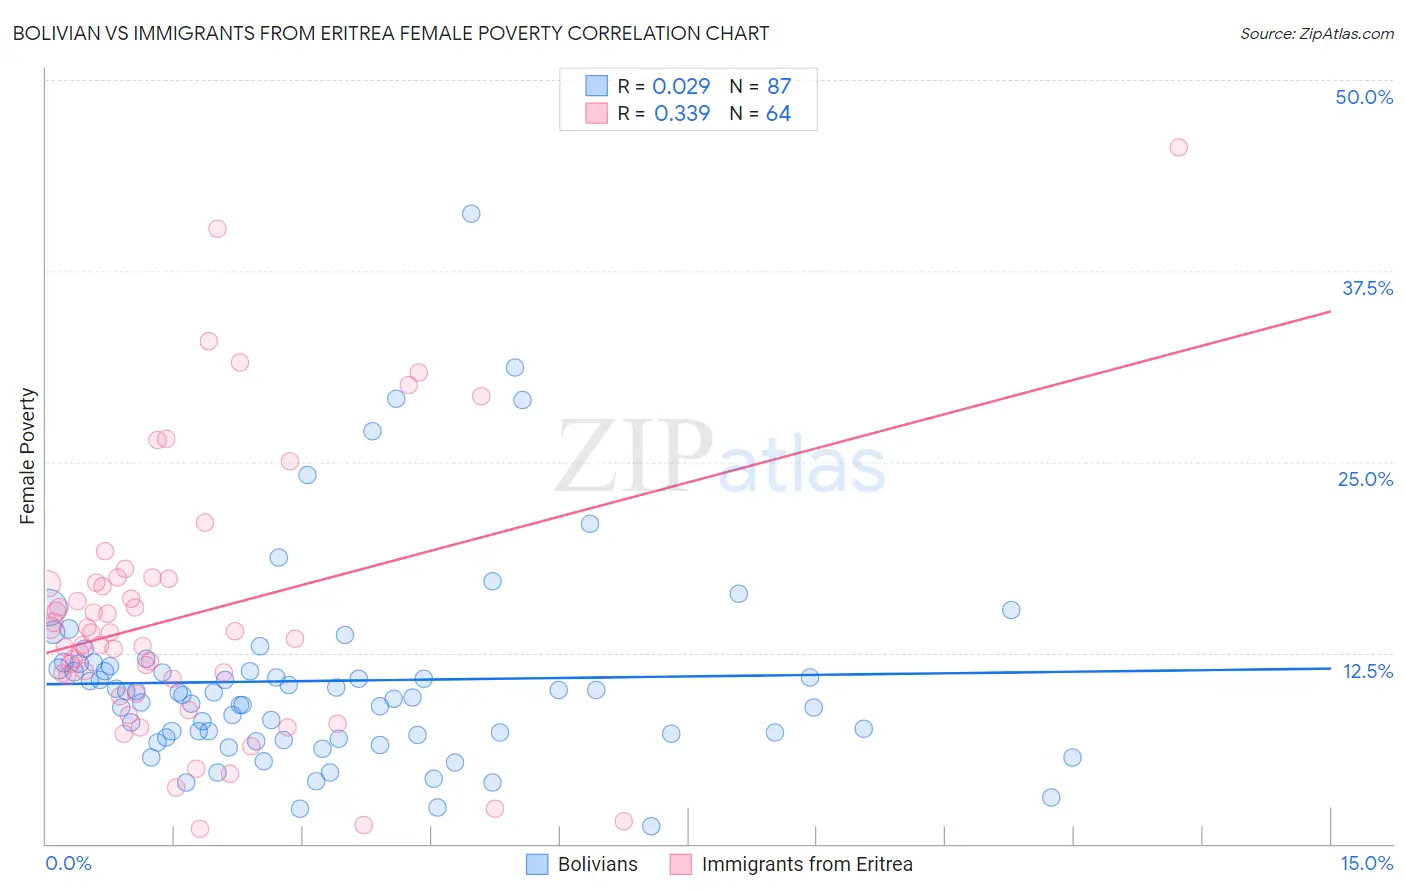
Bolivian vs Immigrants from Eritrea Female Poverty Correlation Chart
The statistical analysis conducted on geographies consisting of 184,615,505 people shows no correlation between the proportion of Bolivians and poverty level among females in the United States with a correlation coefficient (R) of 0.029 and weighted average of 11.5%. Similarly, the statistical analysis conducted on geographies consisting of 104,846,826 people shows a mild positive correlation between the proportion of Immigrants from Eritrea and poverty level among females in the United States with a correlation coefficient (R) of 0.339 and weighted average of 14.6%, a difference of 27.4%.
Female Poverty Correlation Summary
| Measurement | Bolivian | Immigrants from Eritrea |
| Minimum | 1.1% | 1.0% |
| Maximum | 41.2% | 45.6% |
| Range | 40.1% | 44.6% |
| Mean | 10.7% | 15.0% |
| Median | 9.7% | 13.6% |
| Interquartile 25% (IQ1) | 6.9% | 10.3% |
| Interquartile 75% (IQ3) | 11.6% | 17.2% |
| Interquartile Range (IQR) | 4.7% | 6.9% |
| Standard Deviation (Sample) | 6.6% | 8.9% |
| Standard Deviation (Population) | 6.5% | 8.8% |
Similar Demographics by Female Poverty
Demographics Similar to Bolivians by Female Poverty
In terms of female poverty, the demographic groups most similar to Bolivians are Immigrants from Scotland (11.5%, a difference of 0.050%), Immigrants from Bolivia (11.5%, a difference of 0.070%), Norwegian (11.5%, a difference of 0.090%), Eastern European (11.5%, a difference of 0.32%), and Latvian (11.4%, a difference of 0.54%).
| Demographics | Rating | Rank | Female Poverty |
| Immigrants | Hong Kong | 99.9 /100 | #10 | Exceptional 11.2% |
| Maltese | 99.9 /100 | #11 | Exceptional 11.2% |
| Bhutanese | 99.9 /100 | #12 | Exceptional 11.3% |
| Immigrants | Lithuania | 99.9 /100 | #13 | Exceptional 11.3% |
| Lithuanians | 99.8 /100 | #14 | Exceptional 11.4% |
| Latvians | 99.8 /100 | #15 | Exceptional 11.4% |
| Immigrants | Bolivia | 99.8 /100 | #16 | Exceptional 11.5% |
| Bolivians | 99.8 /100 | #17 | Exceptional 11.5% |
| Immigrants | Scotland | 99.8 /100 | #18 | Exceptional 11.5% |
| Norwegians | 99.8 /100 | #19 | Exceptional 11.5% |
| Eastern Europeans | 99.7 /100 | #20 | Exceptional 11.5% |
| Italians | 99.7 /100 | #21 | Exceptional 11.6% |
| Swedes | 99.7 /100 | #22 | Exceptional 11.6% |
| Burmese | 99.7 /100 | #23 | Exceptional 11.6% |
| Luxembourgers | 99.7 /100 | #24 | Exceptional 11.6% |
Demographics Similar to Immigrants from Eritrea by Female Poverty
In terms of female poverty, the demographic groups most similar to Immigrants from Eritrea are Immigrants from Nigeria (14.7%, a difference of 0.31%), American (14.6%, a difference of 0.33%), Immigrants from Micronesia (14.6%, a difference of 0.33%), German Russian (14.7%, a difference of 0.45%), and Ghanaian (14.7%, a difference of 0.52%).
| Demographics | Rating | Rank | Female Poverty |
| Japanese | 4.1 /100 | #219 | Tragic 14.5% |
| Alsatians | 4.0 /100 | #220 | Tragic 14.5% |
| Immigrants | Cambodia | 3.7 /100 | #221 | Tragic 14.5% |
| Immigrants | Nonimmigrants | 3.7 /100 | #222 | Tragic 14.5% |
| Immigrants | Africa | 3.3 /100 | #223 | Tragic 14.5% |
| Americans | 2.8 /100 | #224 | Tragic 14.6% |
| Immigrants | Micronesia | 2.8 /100 | #225 | Tragic 14.6% |
| Immigrants | Eritrea | 2.4 /100 | #226 | Tragic 14.6% |
| Immigrants | Nigeria | 2.1 /100 | #227 | Tragic 14.7% |
| German Russians | 2.0 /100 | #228 | Tragic 14.7% |
| Ghanaians | 1.9 /100 | #229 | Tragic 14.7% |
| Alaska Natives | 1.8 /100 | #230 | Tragic 14.7% |
| Nigerians | 1.7 /100 | #231 | Tragic 14.8% |
| Osage | 1.5 /100 | #232 | Tragic 14.8% |
| Immigrants | Saudi Arabia | 1.4 /100 | #233 | Tragic 14.8% |