Immigrants from Asia vs Immigrants from Costa Rica Family Poverty
COMPARE
Immigrants from Asia
Immigrants from Costa Rica
Family Poverty
Family Poverty Comparison
Immigrants from Asia
Immigrants from Costa Rica
7.9%
FAMILY POVERTY
97.4/ 100
METRIC RATING
85th/ 347
METRIC RANK
9.4%
FAMILY POVERTY
21.7/ 100
METRIC RATING
200th/ 347
METRIC RANK
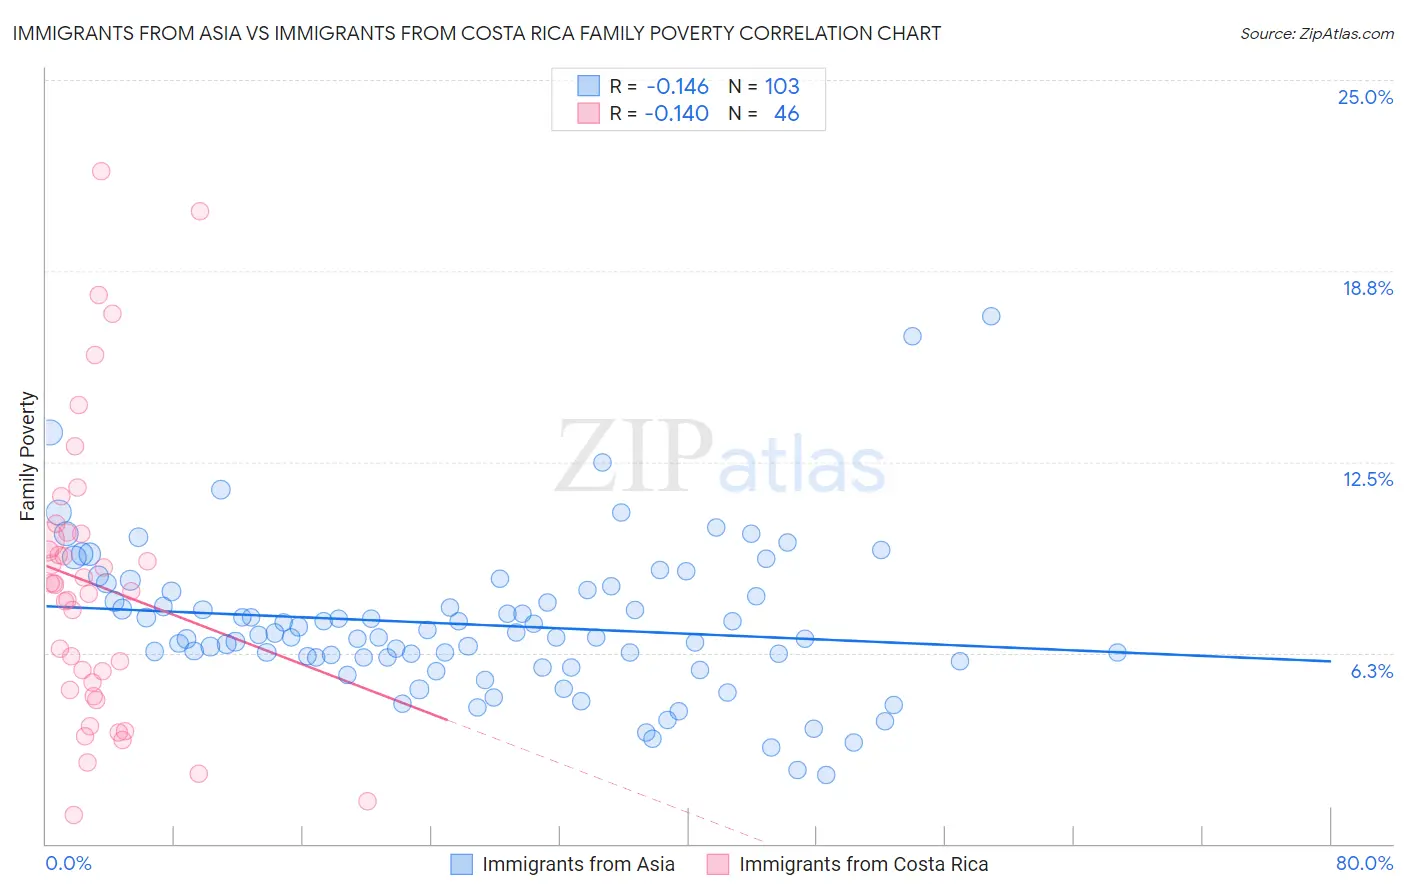
Immigrants from Asia vs Immigrants from Costa Rica Family Poverty Correlation Chart
The statistical analysis conducted on geographies consisting of 545,488,463 people shows a poor negative correlation between the proportion of Immigrants from Asia and poverty level among families in the United States with a correlation coefficient (R) of -0.146 and weighted average of 7.9%. Similarly, the statistical analysis conducted on geographies consisting of 204,115,485 people shows a poor negative correlation between the proportion of Immigrants from Costa Rica and poverty level among families in the United States with a correlation coefficient (R) of -0.140 and weighted average of 9.4%, a difference of 18.2%.
Family Poverty Correlation Summary
| Measurement | Immigrants from Asia | Immigrants from Costa Rica |
| Minimum | 2.2% | 0.92% |
| Maximum | 17.3% | 22.0% |
| Range | 15.0% | 21.1% |
| Mean | 7.2% | 8.5% |
| Median | 6.8% | 8.4% |
| Interquartile 25% (IQ1) | 6.1% | 5.0% |
| Interquartile 75% (IQ3) | 8.3% | 10.2% |
| Interquartile Range (IQR) | 2.2% | 5.1% |
| Standard Deviation (Sample) | 2.5% | 4.8% |
| Standard Deviation (Population) | 2.5% | 4.7% |
Similar Demographics by Family Poverty
Demographics Similar to Immigrants from Asia by Family Poverty
In terms of family poverty, the demographic groups most similar to Immigrants from Asia are Scottish (7.9%, a difference of 0.040%), Belgian (8.0%, a difference of 0.13%), Serbian (8.0%, a difference of 0.20%), British (7.9%, a difference of 0.24%), and Immigrants from Denmark (8.0%, a difference of 0.34%).
| Demographics | Rating | Rank | Family Poverty |
| Immigrants | North America | 97.9 /100 | #78 | Exceptional 7.9% |
| Immigrants | Europe | 97.8 /100 | #79 | Exceptional 7.9% |
| English | 97.8 /100 | #80 | Exceptional 7.9% |
| Irish | 97.8 /100 | #81 | Exceptional 7.9% |
| Immigrants | Poland | 97.8 /100 | #82 | Exceptional 7.9% |
| Slovaks | 97.7 /100 | #83 | Exceptional 7.9% |
| British | 97.5 /100 | #84 | Exceptional 7.9% |
| Immigrants | Asia | 97.4 /100 | #85 | Exceptional 7.9% |
| Scottish | 97.3 /100 | #86 | Exceptional 7.9% |
| Belgians | 97.3 /100 | #87 | Exceptional 8.0% |
| Serbians | 97.2 /100 | #88 | Exceptional 8.0% |
| Immigrants | Denmark | 97.1 /100 | #89 | Exceptional 8.0% |
| Immigrants | England | 97.1 /100 | #90 | Exceptional 8.0% |
| Immigrants | Italy | 97.0 /100 | #91 | Exceptional 8.0% |
| Czechoslovakians | 96.8 /100 | #92 | Exceptional 8.0% |
Demographics Similar to Immigrants from Costa Rica by Family Poverty
In terms of family poverty, the demographic groups most similar to Immigrants from Costa Rica are Spaniard (9.4%, a difference of 0.19%), Immigrants from Portugal (9.4%, a difference of 0.23%), Immigrants from Sierra Leone (9.4%, a difference of 0.40%), Iraqi (9.3%, a difference of 0.44%), and German Russian (9.4%, a difference of 0.44%).
| Demographics | Rating | Rank | Family Poverty |
| Immigrants | Western Asia | 28.2 /100 | #193 | Fair 9.3% |
| South Americans | 28.1 /100 | #194 | Fair 9.3% |
| Venezuelans | 27.4 /100 | #195 | Fair 9.3% |
| Immigrants | Venezuela | 26.1 /100 | #196 | Fair 9.3% |
| Immigrants | Colombia | 24.4 /100 | #197 | Fair 9.3% |
| Iraqis | 24.2 /100 | #198 | Fair 9.3% |
| Spaniards | 22.8 /100 | #199 | Fair 9.4% |
| Immigrants | Costa Rica | 21.7 /100 | #200 | Fair 9.4% |
| Immigrants | Portugal | 20.5 /100 | #201 | Fair 9.4% |
| Immigrants | Sierra Leone | 19.6 /100 | #202 | Poor 9.4% |
| German Russians | 19.4 /100 | #203 | Poor 9.4% |
| Immigrants | Lebanon | 18.9 /100 | #204 | Poor 9.4% |
| Aleuts | 18.0 /100 | #205 | Poor 9.5% |
| Immigrants | South America | 18.0 /100 | #206 | Poor 9.5% |
| Sierra Leoneans | 15.6 /100 | #207 | Poor 9.5% |