Swiss vs French Canadian Child Poverty Among Boys Under 16
COMPARE
Swiss
French Canadian
Child Poverty Among Boys Under 16
Child Poverty Among Boys Under 16 Comparison
Swiss
French Canadians
14.8%
CHILD POVERTY AMONG BOYS UNDER 16
97.3/ 100
METRIC RATING
84th/ 347
METRIC RANK
15.9%
CHILD POVERTY AMONG BOYS UNDER 16
76.6/ 100
METRIC RATING
155th/ 347
METRIC RANK
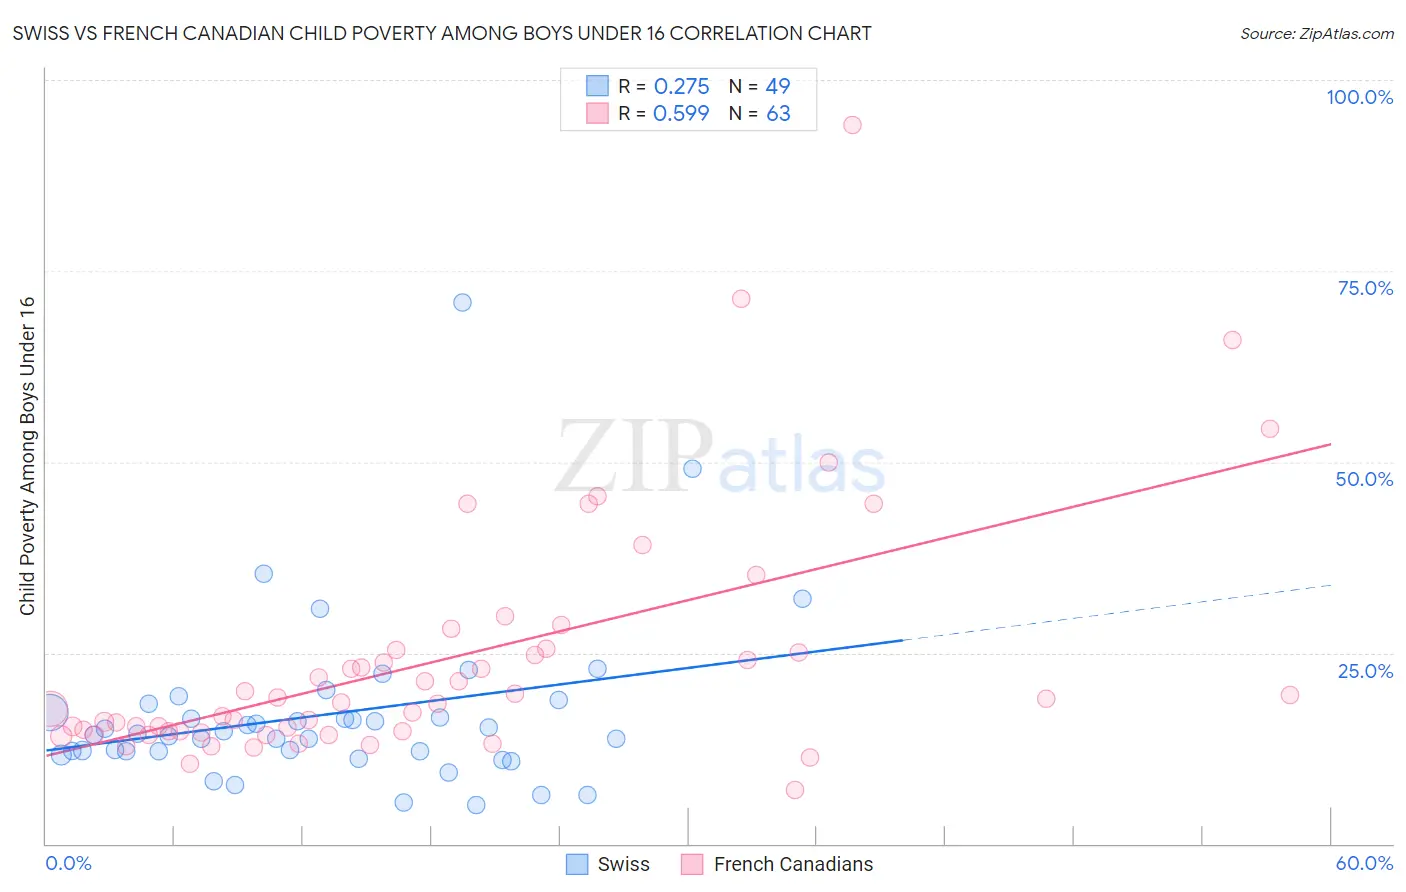
Swiss vs French Canadian Child Poverty Among Boys Under 16 Correlation Chart
The statistical analysis conducted on geographies consisting of 453,201,840 people shows a weak positive correlation between the proportion of Swiss and poverty level among boys under the age of 16 in the United States with a correlation coefficient (R) of 0.275 and weighted average of 14.8%. Similarly, the statistical analysis conducted on geographies consisting of 488,484,984 people shows a substantial positive correlation between the proportion of French Canadians and poverty level among boys under the age of 16 in the United States with a correlation coefficient (R) of 0.599 and weighted average of 15.9%, a difference of 7.4%.
Child Poverty Among Boys Under 16 Correlation Summary
| Measurement | Swiss | French Canadian |
| Minimum | 5.0% | 7.1% |
| Maximum | 70.8% | 94.2% |
| Range | 65.8% | 87.1% |
| Mean | 16.9% | 24.1% |
| Median | 14.4% | 18.5% |
| Interquartile 25% (IQ1) | 12.1% | 14.7% |
| Interquartile 75% (IQ3) | 17.7% | 25.4% |
| Interquartile Range (IQR) | 5.6% | 10.6% |
| Standard Deviation (Sample) | 11.1% | 16.0% |
| Standard Deviation (Population) | 11.0% | 15.9% |
Similar Demographics by Child Poverty Among Boys Under 16
Demographics Similar to Swiss by Child Poverty Among Boys Under 16
In terms of child poverty among boys under 16, the demographic groups most similar to Swiss are Taiwanese (14.8%, a difference of 0.040%), German (14.8%, a difference of 0.11%), Immigrants from South Africa (14.8%, a difference of 0.12%), Northern European (14.8%, a difference of 0.16%), and Immigrants from North America (14.8%, a difference of 0.18%).
| Demographics | Rating | Rank | Child Poverty Among Boys Under 16 |
| Macedonians | 97.9 /100 | #77 | Exceptional 14.7% |
| Egyptians | 97.8 /100 | #78 | Exceptional 14.7% |
| Immigrants | Eastern Europe | 97.8 /100 | #79 | Exceptional 14.7% |
| Immigrants | Russia | 97.7 /100 | #80 | Exceptional 14.7% |
| Immigrants | Canada | 97.6 /100 | #81 | Exceptional 14.7% |
| Ukrainians | 97.6 /100 | #82 | Exceptional 14.7% |
| Immigrants | South Africa | 97.4 /100 | #83 | Exceptional 14.8% |
| Swiss | 97.3 /100 | #84 | Exceptional 14.8% |
| Taiwanese | 97.3 /100 | #85 | Exceptional 14.8% |
| Germans | 97.2 /100 | #86 | Exceptional 14.8% |
| Northern Europeans | 97.2 /100 | #87 | Exceptional 14.8% |
| Immigrants | North America | 97.1 /100 | #88 | Exceptional 14.8% |
| Immigrants | Argentina | 97.1 /100 | #89 | Exceptional 14.8% |
| Austrians | 97.1 /100 | #90 | Exceptional 14.8% |
| Paraguayans | 96.8 /100 | #91 | Exceptional 14.9% |
Demographics Similar to French Canadians by Child Poverty Among Boys Under 16
In terms of child poverty among boys under 16, the demographic groups most similar to French Canadians are Israeli (15.9%, a difference of 0.010%), Immigrants from Nepal (15.9%, a difference of 0.10%), Yugoslavian (15.9%, a difference of 0.11%), Syrian (15.9%, a difference of 0.15%), and Immigrants from Chile (15.9%, a difference of 0.28%).
| Demographics | Rating | Rank | Child Poverty Among Boys Under 16 |
| Brazilians | 81.0 /100 | #148 | Excellent 15.8% |
| Slovaks | 80.3 /100 | #149 | Excellent 15.8% |
| Immigrants | Jordan | 80.2 /100 | #150 | Excellent 15.8% |
| Puget Sound Salish | 79.8 /100 | #151 | Good 15.8% |
| Immigrants | Venezuela | 79.5 /100 | #152 | Good 15.8% |
| French | 78.7 /100 | #153 | Good 15.8% |
| Syrians | 77.5 /100 | #154 | Good 15.9% |
| French Canadians | 76.6 /100 | #155 | Good 15.9% |
| Israelis | 76.5 /100 | #156 | Good 15.9% |
| Immigrants | Nepal | 76.0 /100 | #157 | Good 15.9% |
| Yugoslavians | 75.9 /100 | #158 | Good 15.9% |
| Immigrants | Chile | 74.8 /100 | #159 | Good 15.9% |
| Immigrants | Northern Africa | 71.3 /100 | #160 | Good 16.0% |
| Immigrants | Oceania | 71.3 /100 | #161 | Good 16.0% |
| Guamanians/Chamorros | 69.6 /100 | #162 | Good 16.1% |