Yuman vs French Canadian Child Poverty Among Boys Under 16
COMPARE
Yuman
French Canadian
Child Poverty Among Boys Under 16
Child Poverty Among Boys Under 16 Comparison
Yuman
French Canadians
30.6%
CHILD POVERTY AMONG BOYS UNDER 16
0.0/ 100
METRIC RATING
344th/ 347
METRIC RANK
15.9%
CHILD POVERTY AMONG BOYS UNDER 16
76.6/ 100
METRIC RATING
155th/ 347
METRIC RANK
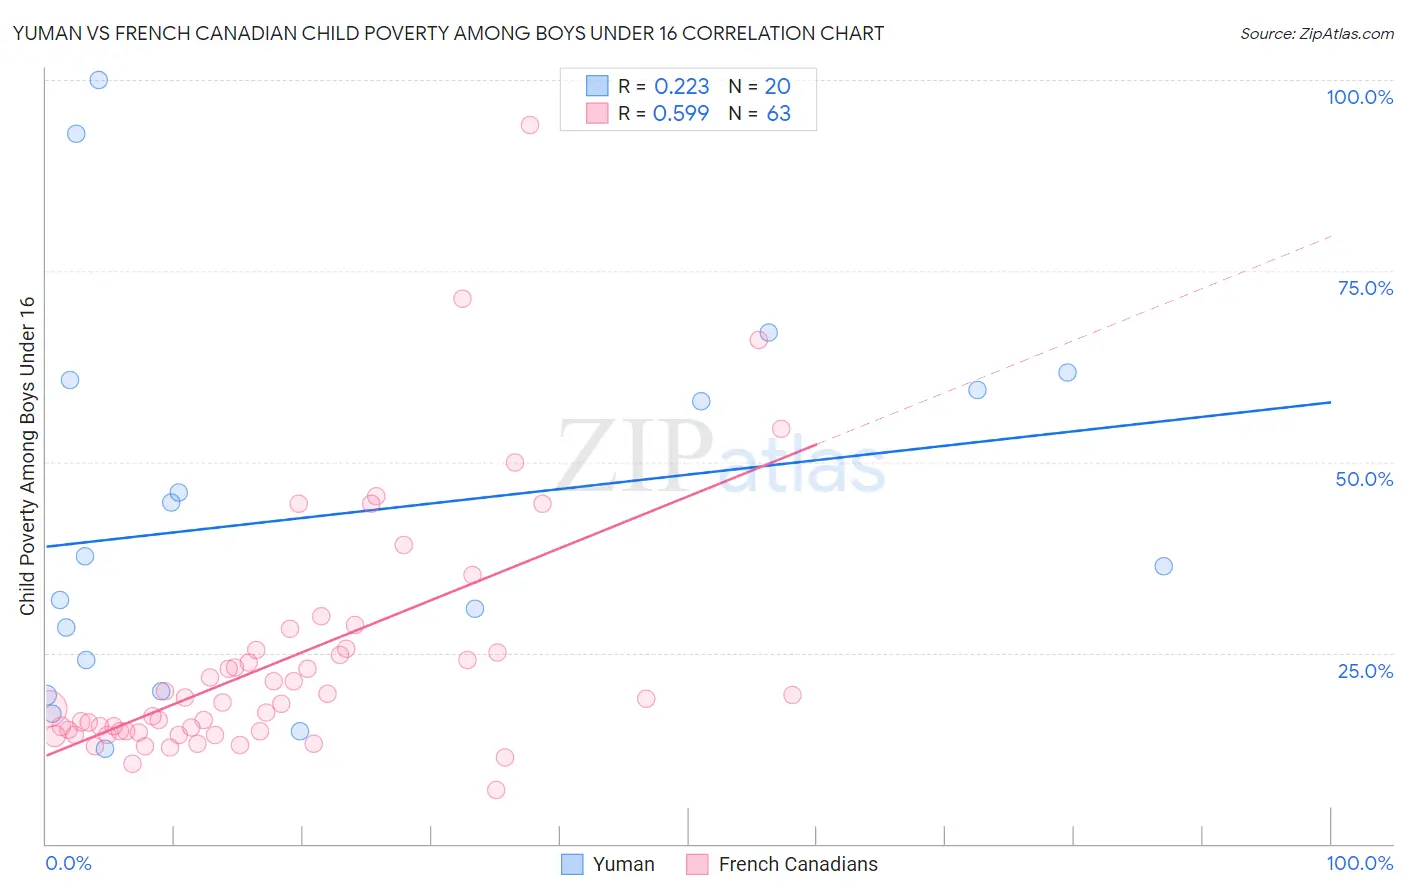
Yuman vs French Canadian Child Poverty Among Boys Under 16 Correlation Chart
The statistical analysis conducted on geographies consisting of 40,605,786 people shows a weak positive correlation between the proportion of Yuman and poverty level among boys under the age of 16 in the United States with a correlation coefficient (R) of 0.223 and weighted average of 30.6%. Similarly, the statistical analysis conducted on geographies consisting of 488,484,984 people shows a substantial positive correlation between the proportion of French Canadians and poverty level among boys under the age of 16 in the United States with a correlation coefficient (R) of 0.599 and weighted average of 15.9%, a difference of 92.8%.
Child Poverty Among Boys Under 16 Correlation Summary
| Measurement | Yuman | French Canadian |
| Minimum | 12.5% | 7.1% |
| Maximum | 100.0% | 94.2% |
| Range | 87.5% | 87.1% |
| Mean | 43.2% | 24.1% |
| Median | 37.0% | 18.5% |
| Interquartile 25% (IQ1) | 22.0% | 14.7% |
| Interquartile 75% (IQ3) | 60.0% | 25.4% |
| Interquartile Range (IQR) | 38.0% | 10.6% |
| Standard Deviation (Sample) | 25.0% | 16.0% |
| Standard Deviation (Population) | 24.4% | 15.9% |
Similar Demographics by Child Poverty Among Boys Under 16
Demographics Similar to Yuman by Child Poverty Among Boys Under 16
In terms of child poverty among boys under 16, the demographic groups most similar to Yuman are Navajo (30.3%, a difference of 1.2%), Tohono O'odham (31.6%, a difference of 3.0%), Pima (29.7%, a difference of 3.0%), Lumbee (31.9%, a difference of 4.2%), and Immigrants from Yemen (28.9%, a difference of 6.2%).
| Demographics | Rating | Rank | Child Poverty Among Boys Under 16 |
| Apache | 0.0 /100 | #333 | Tragic 24.5% |
| Blacks/African Americans | 0.0 /100 | #334 | Tragic 24.5% |
| Yup'ik | 0.0 /100 | #335 | Tragic 24.7% |
| Sioux | 0.0 /100 | #336 | Tragic 25.3% |
| Cheyenne | 0.0 /100 | #337 | Tragic 25.8% |
| Hopi | 0.0 /100 | #338 | Tragic 25.9% |
| Houma | 0.0 /100 | #339 | Tragic 26.2% |
| Crow | 0.0 /100 | #340 | Tragic 26.3% |
| Immigrants | Yemen | 0.0 /100 | #341 | Tragic 28.9% |
| Pima | 0.0 /100 | #342 | Tragic 29.7% |
| Navajo | 0.0 /100 | #343 | Tragic 30.3% |
| Yuman | 0.0 /100 | #344 | Tragic 30.6% |
| Tohono O'odham | 0.0 /100 | #345 | Tragic 31.6% |
| Lumbee | 0.0 /100 | #346 | Tragic 31.9% |
| Puerto Ricans | 0.0 /100 | #347 | Tragic 32.8% |
Demographics Similar to French Canadians by Child Poverty Among Boys Under 16
In terms of child poverty among boys under 16, the demographic groups most similar to French Canadians are Israeli (15.9%, a difference of 0.010%), Immigrants from Nepal (15.9%, a difference of 0.10%), Yugoslavian (15.9%, a difference of 0.11%), Syrian (15.9%, a difference of 0.15%), and Immigrants from Chile (15.9%, a difference of 0.28%).
| Demographics | Rating | Rank | Child Poverty Among Boys Under 16 |
| Brazilians | 81.0 /100 | #148 | Excellent 15.8% |
| Slovaks | 80.3 /100 | #149 | Excellent 15.8% |
| Immigrants | Jordan | 80.2 /100 | #150 | Excellent 15.8% |
| Puget Sound Salish | 79.8 /100 | #151 | Good 15.8% |
| Immigrants | Venezuela | 79.5 /100 | #152 | Good 15.8% |
| French | 78.7 /100 | #153 | Good 15.8% |
| Syrians | 77.5 /100 | #154 | Good 15.9% |
| French Canadians | 76.6 /100 | #155 | Good 15.9% |
| Israelis | 76.5 /100 | #156 | Good 15.9% |
| Immigrants | Nepal | 76.0 /100 | #157 | Good 15.9% |
| Yugoslavians | 75.9 /100 | #158 | Good 15.9% |
| Immigrants | Chile | 74.8 /100 | #159 | Good 15.9% |
| Immigrants | Northern Africa | 71.3 /100 | #160 | Good 16.0% |
| Immigrants | Oceania | 71.3 /100 | #161 | Good 16.0% |
| Guamanians/Chamorros | 69.6 /100 | #162 | Good 16.1% |