Immigrants from Hungary vs French Canadian Child Poverty Among Boys Under 16
COMPARE
Immigrants from Hungary
French Canadian
Child Poverty Among Boys Under 16
Child Poverty Among Boys Under 16 Comparison
Immigrants from Hungary
French Canadians
15.7%
CHILD POVERTY AMONG BOYS UNDER 16
84.1/ 100
METRIC RATING
142nd/ 347
METRIC RANK
15.9%
CHILD POVERTY AMONG BOYS UNDER 16
76.6/ 100
METRIC RATING
155th/ 347
METRIC RANK
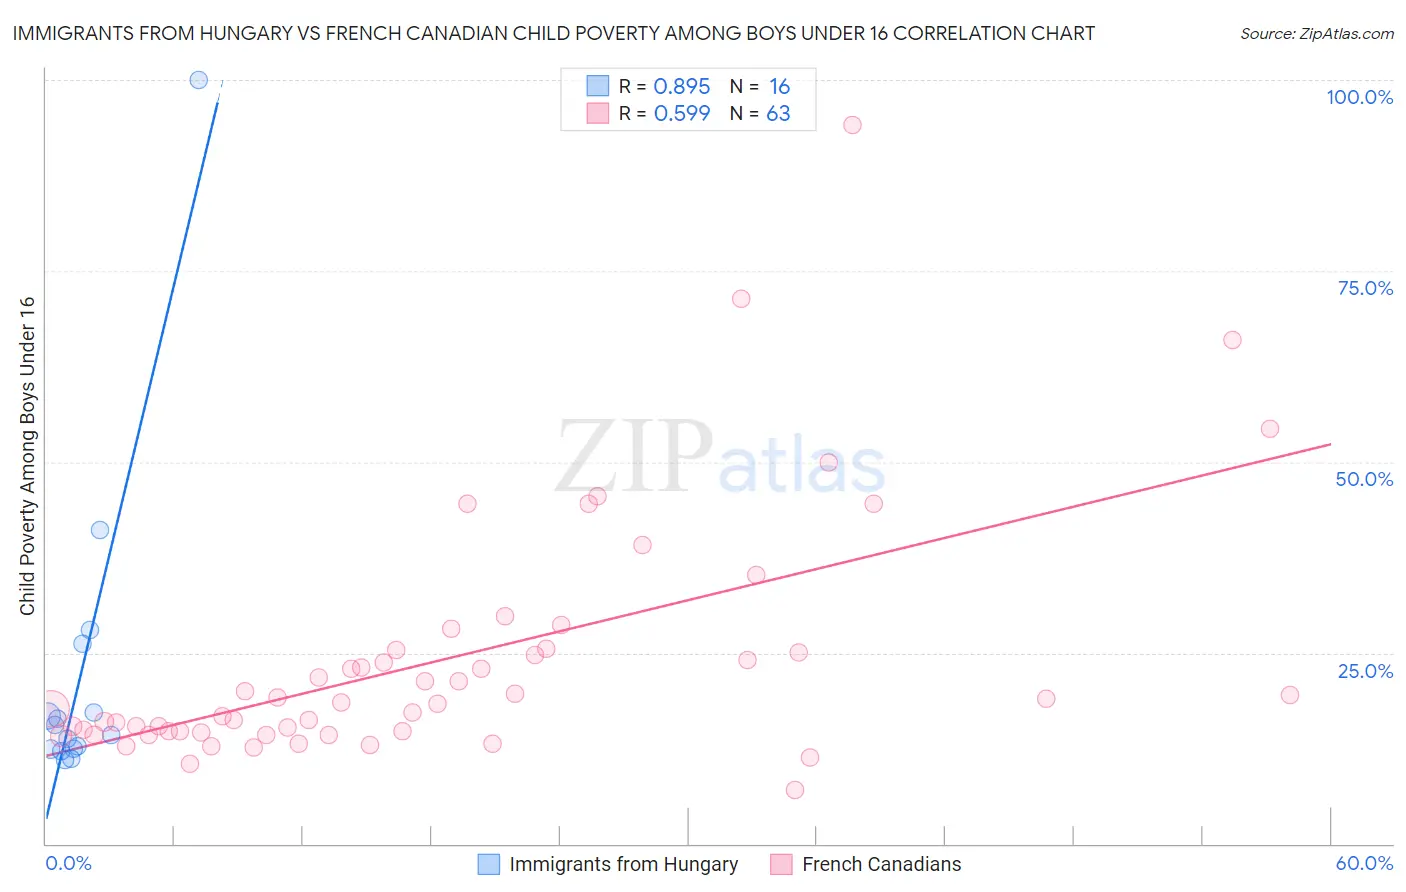
Immigrants from Hungary vs French Canadian Child Poverty Among Boys Under 16 Correlation Chart
The statistical analysis conducted on geographies consisting of 193,561,492 people shows a very strong positive correlation between the proportion of Immigrants from Hungary and poverty level among boys under the age of 16 in the United States with a correlation coefficient (R) of 0.895 and weighted average of 15.7%. Similarly, the statistical analysis conducted on geographies consisting of 488,484,984 people shows a substantial positive correlation between the proportion of French Canadians and poverty level among boys under the age of 16 in the United States with a correlation coefficient (R) of 0.599 and weighted average of 15.9%, a difference of 1.4%.
Child Poverty Among Boys Under 16 Correlation Summary
| Measurement | Immigrants from Hungary | French Canadian |
| Minimum | 10.9% | 7.1% |
| Maximum | 100.0% | 94.2% |
| Range | 89.1% | 87.1% |
| Mean | 22.5% | 24.1% |
| Median | 14.9% | 18.5% |
| Interquartile 25% (IQ1) | 12.4% | 14.7% |
| Interquartile 75% (IQ3) | 21.6% | 25.4% |
| Interquartile Range (IQR) | 9.2% | 10.6% |
| Standard Deviation (Sample) | 22.1% | 16.0% |
| Standard Deviation (Population) | 21.4% | 15.9% |
Demographics Similar to Immigrants from Hungary and French Canadians by Child Poverty Among Boys Under 16
In terms of child poverty among boys under 16, the demographic groups most similar to Immigrants from Hungary are Slavic (15.7%, a difference of 0.090%), Immigrants from Fiji (15.7%, a difference of 0.11%), Immigrants from Peru (15.7%, a difference of 0.13%), Samoan (15.7%, a difference of 0.18%), and New Zealander (15.7%, a difference of 0.34%). Similarly, the demographic groups most similar to French Canadians are Israeli (15.9%, a difference of 0.010%), Immigrants from Nepal (15.9%, a difference of 0.10%), Yugoslavian (15.9%, a difference of 0.11%), Syrian (15.9%, a difference of 0.15%), and French (15.8%, a difference of 0.35%).
| Demographics | Rating | Rank | Child Poverty Among Boys Under 16 |
| Immigrants | Southern Europe | 86.5 /100 | #138 | Excellent 15.6% |
| Albanians | 86.5 /100 | #139 | Excellent 15.6% |
| Immigrants | Kuwait | 85.6 /100 | #140 | Excellent 15.6% |
| Slavs | 84.5 /100 | #141 | Excellent 15.7% |
| Immigrants | Hungary | 84.1 /100 | #142 | Excellent 15.7% |
| Immigrants | Fiji | 83.6 /100 | #143 | Excellent 15.7% |
| Immigrants | Peru | 83.5 /100 | #144 | Excellent 15.7% |
| Samoans | 83.2 /100 | #145 | Excellent 15.7% |
| New Zealanders | 82.4 /100 | #146 | Excellent 15.7% |
| Venezuelans | 82.1 /100 | #147 | Excellent 15.7% |
| Brazilians | 81.0 /100 | #148 | Excellent 15.8% |
| Slovaks | 80.3 /100 | #149 | Excellent 15.8% |
| Immigrants | Jordan | 80.2 /100 | #150 | Excellent 15.8% |
| Puget Sound Salish | 79.8 /100 | #151 | Good 15.8% |
| Immigrants | Venezuela | 79.5 /100 | #152 | Good 15.8% |
| French | 78.7 /100 | #153 | Good 15.8% |
| Syrians | 77.5 /100 | #154 | Good 15.9% |
| French Canadians | 76.6 /100 | #155 | Good 15.9% |
| Israelis | 76.5 /100 | #156 | Good 15.9% |
| Immigrants | Nepal | 76.0 /100 | #157 | Good 15.9% |
| Yugoslavians | 75.9 /100 | #158 | Good 15.9% |