Swiss vs Cuban Child Poverty Among Boys Under 16
COMPARE
Swiss
Cuban
Child Poverty Among Boys Under 16
Child Poverty Among Boys Under 16 Comparison
Swiss
Cubans
14.8%
CHILD POVERTY AMONG BOYS UNDER 16
97.3/ 100
METRIC RATING
84th/ 347
METRIC RANK
17.9%
CHILD POVERTY AMONG BOYS UNDER 16
3.8/ 100
METRIC RATING
223rd/ 347
METRIC RANK
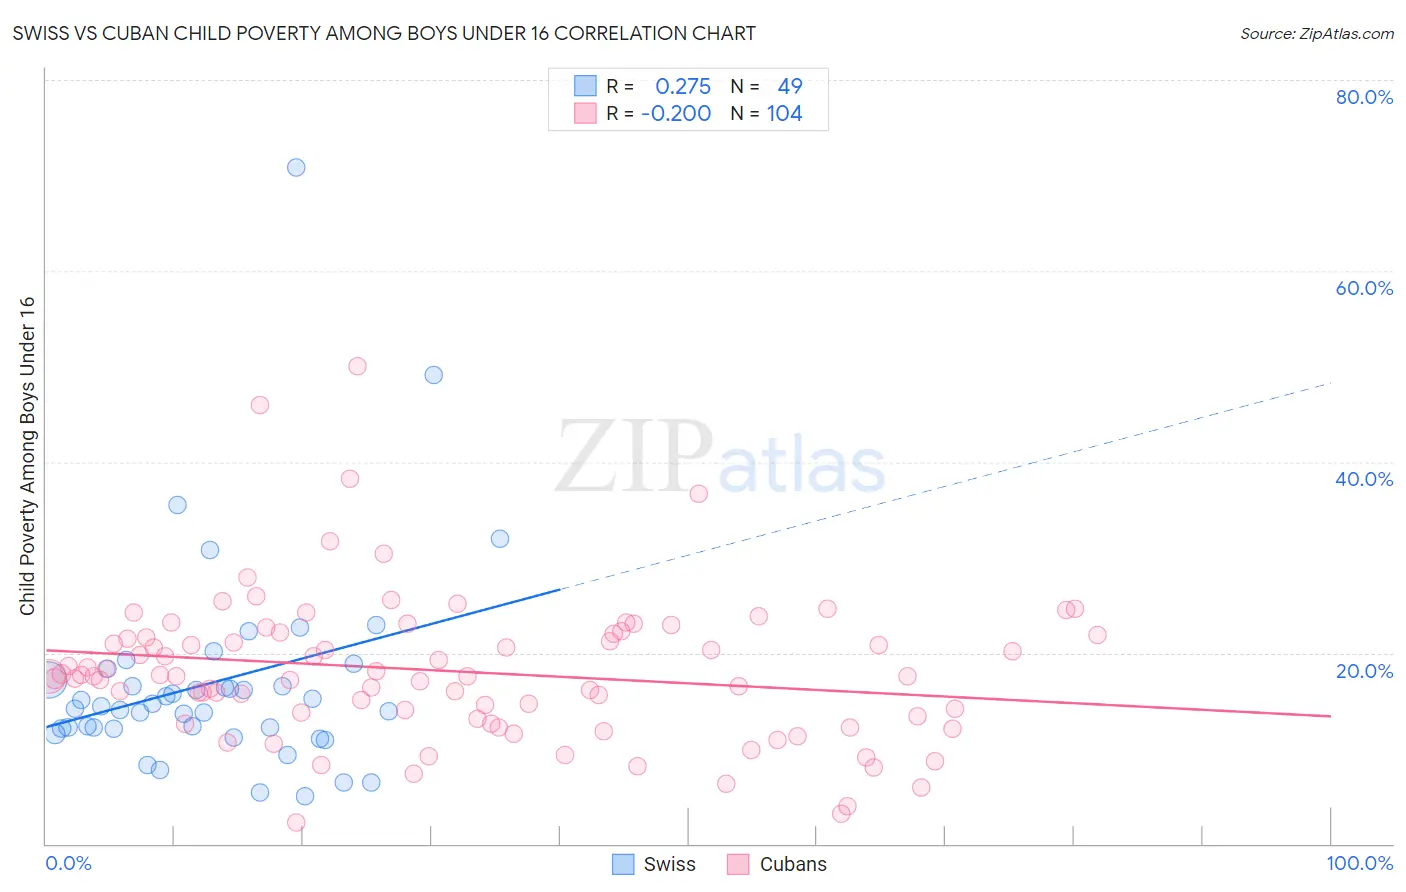
Swiss vs Cuban Child Poverty Among Boys Under 16 Correlation Chart
The statistical analysis conducted on geographies consisting of 453,201,840 people shows a weak positive correlation between the proportion of Swiss and poverty level among boys under the age of 16 in the United States with a correlation coefficient (R) of 0.275 and weighted average of 14.8%. Similarly, the statistical analysis conducted on geographies consisting of 441,055,508 people shows a poor negative correlation between the proportion of Cubans and poverty level among boys under the age of 16 in the United States with a correlation coefficient (R) of -0.200 and weighted average of 17.9%, a difference of 21.1%.
Child Poverty Among Boys Under 16 Correlation Summary
| Measurement | Swiss | Cuban |
| Minimum | 5.0% | 2.3% |
| Maximum | 70.8% | 50.0% |
| Range | 65.8% | 47.7% |
| Mean | 16.9% | 18.1% |
| Median | 14.4% | 17.6% |
| Interquartile 25% (IQ1) | 12.1% | 13.2% |
| Interquartile 75% (IQ3) | 17.7% | 21.9% |
| Interquartile Range (IQR) | 5.6% | 8.7% |
| Standard Deviation (Sample) | 11.1% | 7.7% |
| Standard Deviation (Population) | 11.0% | 7.7% |
Similar Demographics by Child Poverty Among Boys Under 16
Demographics Similar to Swiss by Child Poverty Among Boys Under 16
In terms of child poverty among boys under 16, the demographic groups most similar to Swiss are Taiwanese (14.8%, a difference of 0.040%), German (14.8%, a difference of 0.11%), Immigrants from South Africa (14.8%, a difference of 0.12%), Northern European (14.8%, a difference of 0.16%), and Immigrants from North America (14.8%, a difference of 0.18%).
| Demographics | Rating | Rank | Child Poverty Among Boys Under 16 |
| Macedonians | 97.9 /100 | #77 | Exceptional 14.7% |
| Egyptians | 97.8 /100 | #78 | Exceptional 14.7% |
| Immigrants | Eastern Europe | 97.8 /100 | #79 | Exceptional 14.7% |
| Immigrants | Russia | 97.7 /100 | #80 | Exceptional 14.7% |
| Immigrants | Canada | 97.6 /100 | #81 | Exceptional 14.7% |
| Ukrainians | 97.6 /100 | #82 | Exceptional 14.7% |
| Immigrants | South Africa | 97.4 /100 | #83 | Exceptional 14.8% |
| Swiss | 97.3 /100 | #84 | Exceptional 14.8% |
| Taiwanese | 97.3 /100 | #85 | Exceptional 14.8% |
| Germans | 97.2 /100 | #86 | Exceptional 14.8% |
| Northern Europeans | 97.2 /100 | #87 | Exceptional 14.8% |
| Immigrants | North America | 97.1 /100 | #88 | Exceptional 14.8% |
| Immigrants | Argentina | 97.1 /100 | #89 | Exceptional 14.8% |
| Austrians | 97.1 /100 | #90 | Exceptional 14.8% |
| Paraguayans | 96.8 /100 | #91 | Exceptional 14.9% |
Demographics Similar to Cubans by Child Poverty Among Boys Under 16
In terms of child poverty among boys under 16, the demographic groups most similar to Cubans are Pennsylvania German (17.9%, a difference of 0.090%), Immigrants from Panama (17.9%, a difference of 0.32%), Nepalese (18.0%, a difference of 0.47%), Immigrants from Cambodia (17.8%, a difference of 0.79%), and Inupiat (18.1%, a difference of 0.89%).
| Demographics | Rating | Rank | Child Poverty Among Boys Under 16 |
| Moroccans | 5.6 /100 | #216 | Tragic 17.7% |
| Japanese | 5.5 /100 | #217 | Tragic 17.7% |
| Iraqis | 5.5 /100 | #218 | Tragic 17.7% |
| Sierra Leoneans | 5.3 /100 | #219 | Tragic 17.8% |
| Immigrants | Cambodia | 5.1 /100 | #220 | Tragic 17.8% |
| Immigrants | Panama | 4.3 /100 | #221 | Tragic 17.9% |
| Pennsylvania Germans | 3.9 /100 | #222 | Tragic 17.9% |
| Cubans | 3.8 /100 | #223 | Tragic 17.9% |
| Nepalese | 3.2 /100 | #224 | Tragic 18.0% |
| Inupiat | 2.7 /100 | #225 | Tragic 18.1% |
| Immigrants | Africa | 2.6 /100 | #226 | Tragic 18.1% |
| Bermudans | 2.5 /100 | #227 | Tragic 18.1% |
| Immigrants | Nonimmigrants | 2.2 /100 | #228 | Tragic 18.2% |
| Immigrants | Micronesia | 1.8 /100 | #229 | Tragic 18.3% |
| Fijians | 1.8 /100 | #230 | Tragic 18.3% |