Subsaharan African vs Dutch West Indian Single Female Poverty
COMPARE
Subsaharan African
Dutch West Indian
Single Female Poverty
Single Female Poverty Comparison
Sub-Saharan Africans
Dutch West Indians
23.2%
SINGLE FEMALE POVERTY
0.1/ 100
METRIC RATING
271st/ 347
METRIC RANK
27.5%
SINGLE FEMALE POVERTY
0.0/ 100
METRIC RATING
327th/ 347
METRIC RANK
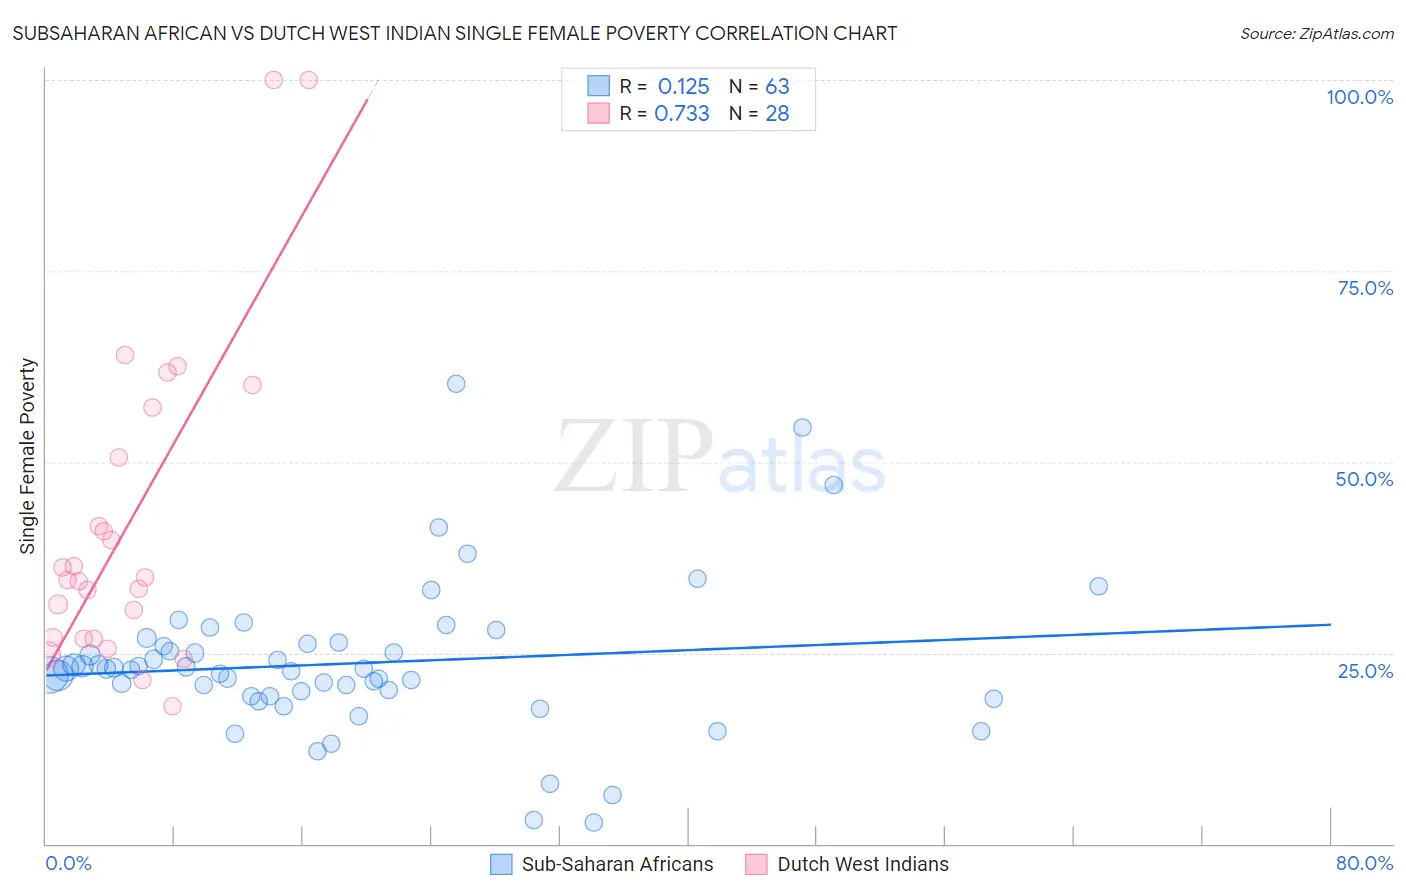
Subsaharan African vs Dutch West Indian Single Female Poverty Correlation Chart
The statistical analysis conducted on geographies consisting of 498,393,739 people shows a poor positive correlation between the proportion of Sub-Saharan Africans and poverty level among single females in the United States with a correlation coefficient (R) of 0.125 and weighted average of 23.2%. Similarly, the statistical analysis conducted on geographies consisting of 85,533,400 people shows a strong positive correlation between the proportion of Dutch West Indians and poverty level among single females in the United States with a correlation coefficient (R) of 0.733 and weighted average of 27.5%, a difference of 18.4%.
Single Female Poverty Correlation Summary
| Measurement | Subsaharan African | Dutch West Indian |
| Minimum | 2.8% | 18.0% |
| Maximum | 60.3% | 100.0% |
| Range | 57.5% | 82.0% |
| Mean | 23.6% | 42.0% |
| Median | 22.9% | 34.7% |
| Interquartile 25% (IQ1) | 19.3% | 27.0% |
| Interquartile 75% (IQ3) | 26.2% | 53.9% |
| Interquartile Range (IQR) | 6.9% | 26.9% |
| Standard Deviation (Sample) | 9.9% | 21.0% |
| Standard Deviation (Population) | 9.8% | 20.6% |
Similar Demographics by Single Female Poverty
Demographics Similar to Sub-Saharan Africans by Single Female Poverty
In terms of single female poverty, the demographic groups most similar to Sub-Saharan Africans are Immigrants from Senegal (23.2%, a difference of 0.19%), Inupiat (23.1%, a difference of 0.25%), Alaska Native (23.3%, a difference of 0.44%), Marshallese (23.3%, a difference of 0.45%), and Hmong (23.1%, a difference of 0.50%).
| Demographics | Rating | Rank | Single Female Poverty |
| Immigrants | Laos | 0.3 /100 | #264 | Tragic 22.9% |
| Central Americans | 0.2 /100 | #265 | Tragic 23.0% |
| Immigrants | Micronesia | 0.2 /100 | #266 | Tragic 23.0% |
| Senegalese | 0.2 /100 | #267 | Tragic 23.0% |
| Fijians | 0.2 /100 | #268 | Tragic 23.1% |
| Hmong | 0.2 /100 | #269 | Tragic 23.1% |
| Inupiat | 0.2 /100 | #270 | Tragic 23.1% |
| Sub-Saharan Africans | 0.1 /100 | #271 | Tragic 23.2% |
| Immigrants | Senegal | 0.1 /100 | #272 | Tragic 23.2% |
| Alaska Natives | 0.1 /100 | #273 | Tragic 23.3% |
| Marshallese | 0.1 /100 | #274 | Tragic 23.3% |
| Mexican American Indians | 0.1 /100 | #275 | Tragic 23.4% |
| Immigrants | Azores | 0.0 /100 | #276 | Tragic 23.5% |
| Pennsylvania Germans | 0.0 /100 | #277 | Tragic 23.6% |
| Immigrants | Nonimmigrants | 0.0 /100 | #278 | Tragic 23.6% |
Demographics Similar to Dutch West Indians by Single Female Poverty
In terms of single female poverty, the demographic groups most similar to Dutch West Indians are Creek (27.4%, a difference of 0.080%), Apache (27.7%, a difference of 0.91%), Choctaw (27.2%, a difference of 0.96%), Menominee (27.8%, a difference of 1.4%), and Kiowa (26.9%, a difference of 1.9%).
| Demographics | Rating | Rank | Single Female Poverty |
| Arapaho | 0.0 /100 | #320 | Tragic 26.4% |
| Yup'ik | 0.0 /100 | #321 | Tragic 26.6% |
| Seminole | 0.0 /100 | #322 | Tragic 26.8% |
| Chippewa | 0.0 /100 | #323 | Tragic 26.8% |
| Kiowa | 0.0 /100 | #324 | Tragic 26.9% |
| Choctaw | 0.0 /100 | #325 | Tragic 27.2% |
| Creek | 0.0 /100 | #326 | Tragic 27.4% |
| Dutch West Indians | 0.0 /100 | #327 | Tragic 27.5% |
| Apache | 0.0 /100 | #328 | Tragic 27.7% |
| Menominee | 0.0 /100 | #329 | Tragic 27.8% |
| Hopi | 0.0 /100 | #330 | Tragic 28.0% |
| Natives/Alaskans | 0.0 /100 | #331 | Tragic 28.2% |
| Yakama | 0.0 /100 | #332 | Tragic 28.3% |
| Ute | 0.0 /100 | #333 | Tragic 28.4% |
| Pueblo | 0.0 /100 | #334 | Tragic 28.6% |