Bahamian vs Dutch West Indian Single Female Poverty
COMPARE
Bahamian
Dutch West Indian
Single Female Poverty
Single Female Poverty Comparison
Bahamians
Dutch West Indians
22.7%
SINGLE FEMALE POVERTY
0.6/ 100
METRIC RATING
258th/ 347
METRIC RANK
27.5%
SINGLE FEMALE POVERTY
0.0/ 100
METRIC RATING
327th/ 347
METRIC RANK
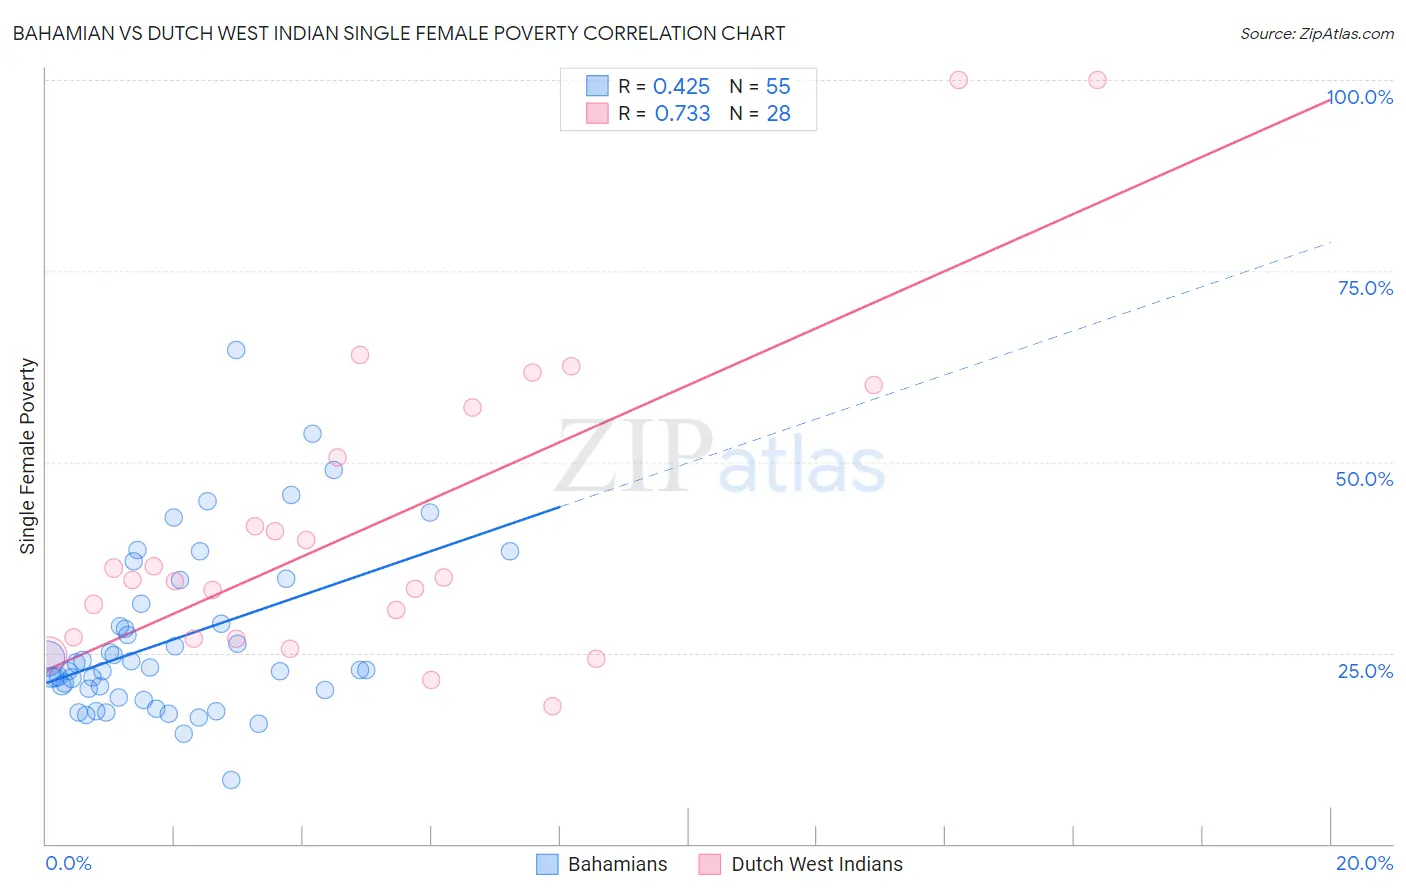
Bahamian vs Dutch West Indian Single Female Poverty Correlation Chart
The statistical analysis conducted on geographies consisting of 112,361,785 people shows a moderate positive correlation between the proportion of Bahamians and poverty level among single females in the United States with a correlation coefficient (R) of 0.425 and weighted average of 22.7%. Similarly, the statistical analysis conducted on geographies consisting of 85,533,400 people shows a strong positive correlation between the proportion of Dutch West Indians and poverty level among single females in the United States with a correlation coefficient (R) of 0.733 and weighted average of 27.5%, a difference of 21.1%.
Single Female Poverty Correlation Summary
| Measurement | Bahamian | Dutch West Indian |
| Minimum | 8.3% | 18.0% |
| Maximum | 64.6% | 100.0% |
| Range | 56.3% | 82.0% |
| Mean | 26.7% | 42.0% |
| Median | 22.7% | 34.7% |
| Interquartile 25% (IQ1) | 20.2% | 27.0% |
| Interquartile 75% (IQ3) | 31.5% | 53.9% |
| Interquartile Range (IQR) | 11.3% | 26.9% |
| Standard Deviation (Sample) | 10.9% | 21.0% |
| Standard Deviation (Population) | 10.8% | 20.6% |
Similar Demographics by Single Female Poverty
Demographics Similar to Bahamians by Single Female Poverty
In terms of single female poverty, the demographic groups most similar to Bahamians are White/Caucasian (22.7%, a difference of 0.14%), Sudanese (22.6%, a difference of 0.20%), Celtic (22.7%, a difference of 0.21%), Immigrants from Belize (22.6%, a difference of 0.34%), and Immigrants from Cabo Verde (22.8%, a difference of 0.48%).
| Demographics | Rating | Rank | Single Female Poverty |
| Immigrants | West Indies | 1.0 /100 | #251 | Tragic 22.5% |
| Delaware | 1.0 /100 | #252 | Tragic 22.5% |
| Immigrants | Liberia | 0.9 /100 | #253 | Tragic 22.5% |
| Immigrants | Burma/Myanmar | 0.8 /100 | #254 | Tragic 22.6% |
| Immigrants | Sudan | 0.8 /100 | #255 | Tragic 22.6% |
| Immigrants | Belize | 0.8 /100 | #256 | Tragic 22.6% |
| Sudanese | 0.7 /100 | #257 | Tragic 22.6% |
| Bahamians | 0.6 /100 | #258 | Tragic 22.7% |
| Whites/Caucasians | 0.6 /100 | #259 | Tragic 22.7% |
| Celtics | 0.5 /100 | #260 | Tragic 22.7% |
| Immigrants | Cabo Verde | 0.4 /100 | #261 | Tragic 22.8% |
| British West Indians | 0.4 /100 | #262 | Tragic 22.8% |
| Scotch-Irish | 0.3 /100 | #263 | Tragic 22.9% |
| Immigrants | Laos | 0.3 /100 | #264 | Tragic 22.9% |
| Central Americans | 0.2 /100 | #265 | Tragic 23.0% |
Demographics Similar to Dutch West Indians by Single Female Poverty
In terms of single female poverty, the demographic groups most similar to Dutch West Indians are Creek (27.4%, a difference of 0.080%), Apache (27.7%, a difference of 0.91%), Choctaw (27.2%, a difference of 0.96%), Menominee (27.8%, a difference of 1.4%), and Kiowa (26.9%, a difference of 1.9%).
| Demographics | Rating | Rank | Single Female Poverty |
| Arapaho | 0.0 /100 | #320 | Tragic 26.4% |
| Yup'ik | 0.0 /100 | #321 | Tragic 26.6% |
| Seminole | 0.0 /100 | #322 | Tragic 26.8% |
| Chippewa | 0.0 /100 | #323 | Tragic 26.8% |
| Kiowa | 0.0 /100 | #324 | Tragic 26.9% |
| Choctaw | 0.0 /100 | #325 | Tragic 27.2% |
| Creek | 0.0 /100 | #326 | Tragic 27.4% |
| Dutch West Indians | 0.0 /100 | #327 | Tragic 27.5% |
| Apache | 0.0 /100 | #328 | Tragic 27.7% |
| Menominee | 0.0 /100 | #329 | Tragic 27.8% |
| Hopi | 0.0 /100 | #330 | Tragic 28.0% |
| Natives/Alaskans | 0.0 /100 | #331 | Tragic 28.2% |
| Yakama | 0.0 /100 | #332 | Tragic 28.3% |
| Ute | 0.0 /100 | #333 | Tragic 28.4% |
| Pueblo | 0.0 /100 | #334 | Tragic 28.6% |