Subsaharan African vs Austrian Single Female Poverty
COMPARE
Subsaharan African
Austrian
Single Female Poverty
Single Female Poverty Comparison
Sub-Saharan Africans
Austrians
23.2%
SINGLE FEMALE POVERTY
0.1/ 100
METRIC RATING
271st/ 347
METRIC RANK
20.4%
SINGLE FEMALE POVERTY
85.8/ 100
METRIC RATING
145th/ 347
METRIC RANK
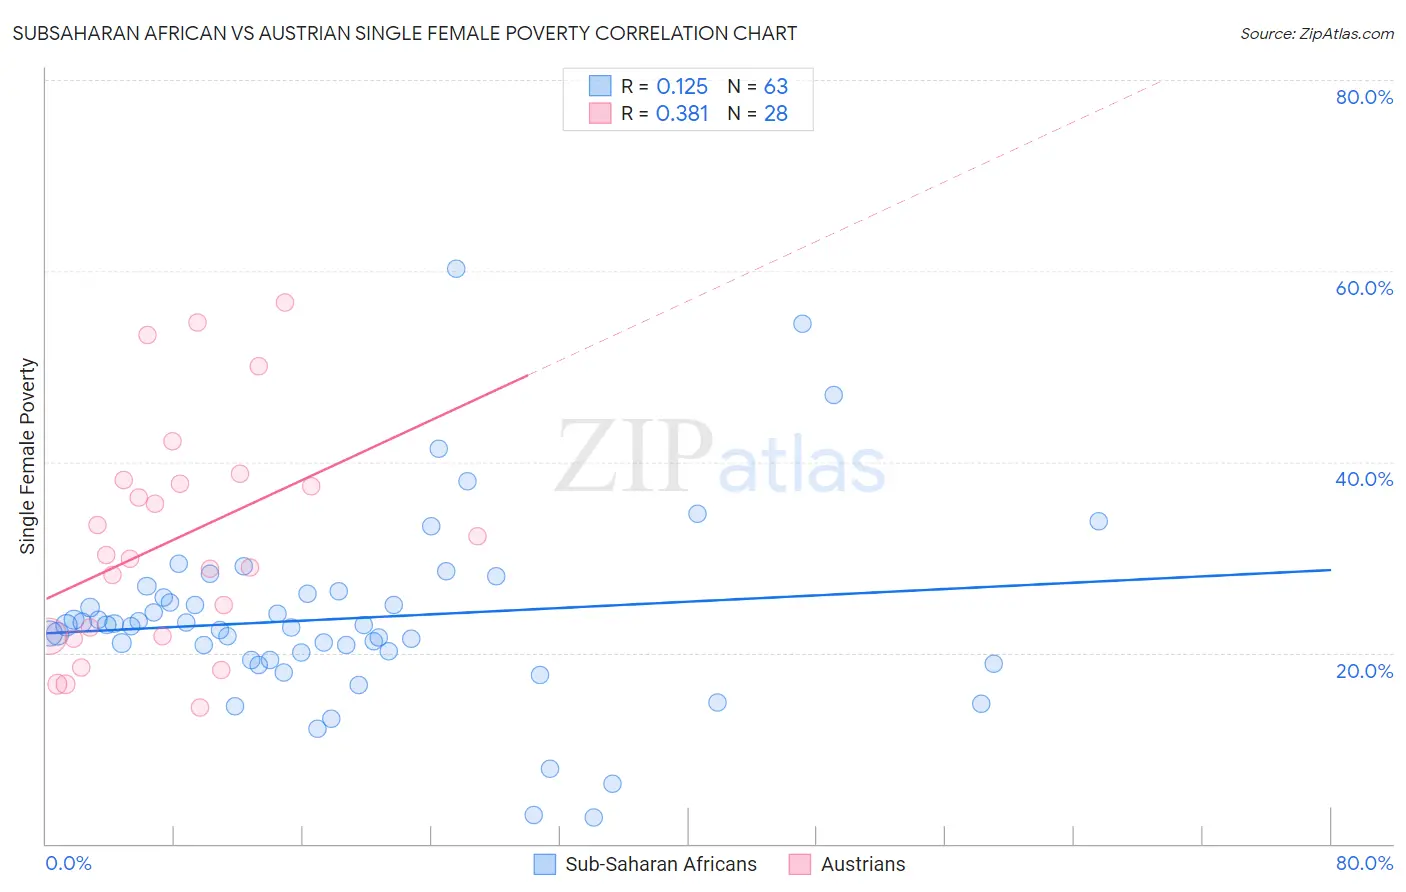
Subsaharan African vs Austrian Single Female Poverty Correlation Chart
The statistical analysis conducted on geographies consisting of 498,393,739 people shows a poor positive correlation between the proportion of Sub-Saharan Africans and poverty level among single females in the United States with a correlation coefficient (R) of 0.125 and weighted average of 23.2%. Similarly, the statistical analysis conducted on geographies consisting of 441,015,533 people shows a mild positive correlation between the proportion of Austrians and poverty level among single females in the United States with a correlation coefficient (R) of 0.381 and weighted average of 20.4%, a difference of 13.6%.
Single Female Poverty Correlation Summary
| Measurement | Subsaharan African | Austrian |
| Minimum | 2.8% | 14.3% |
| Maximum | 60.3% | 56.8% |
| Range | 57.5% | 42.4% |
| Mean | 23.6% | 31.8% |
| Median | 22.9% | 30.1% |
| Interquartile 25% (IQ1) | 19.3% | 21.7% |
| Interquartile 75% (IQ3) | 26.2% | 37.9% |
| Interquartile Range (IQR) | 6.9% | 16.2% |
| Standard Deviation (Sample) | 9.9% | 11.9% |
| Standard Deviation (Population) | 9.8% | 11.7% |
Similar Demographics by Single Female Poverty
Demographics Similar to Sub-Saharan Africans by Single Female Poverty
In terms of single female poverty, the demographic groups most similar to Sub-Saharan Africans are Immigrants from Senegal (23.2%, a difference of 0.19%), Inupiat (23.1%, a difference of 0.25%), Alaska Native (23.3%, a difference of 0.44%), Marshallese (23.3%, a difference of 0.45%), and Hmong (23.1%, a difference of 0.50%).
| Demographics | Rating | Rank | Single Female Poverty |
| Immigrants | Laos | 0.3 /100 | #264 | Tragic 22.9% |
| Central Americans | 0.2 /100 | #265 | Tragic 23.0% |
| Immigrants | Micronesia | 0.2 /100 | #266 | Tragic 23.0% |
| Senegalese | 0.2 /100 | #267 | Tragic 23.0% |
| Fijians | 0.2 /100 | #268 | Tragic 23.1% |
| Hmong | 0.2 /100 | #269 | Tragic 23.1% |
| Inupiat | 0.2 /100 | #270 | Tragic 23.1% |
| Sub-Saharan Africans | 0.1 /100 | #271 | Tragic 23.2% |
| Immigrants | Senegal | 0.1 /100 | #272 | Tragic 23.2% |
| Alaska Natives | 0.1 /100 | #273 | Tragic 23.3% |
| Marshallese | 0.1 /100 | #274 | Tragic 23.3% |
| Mexican American Indians | 0.1 /100 | #275 | Tragic 23.4% |
| Immigrants | Azores | 0.0 /100 | #276 | Tragic 23.5% |
| Pennsylvania Germans | 0.0 /100 | #277 | Tragic 23.6% |
| Immigrants | Nonimmigrants | 0.0 /100 | #278 | Tragic 23.6% |
Demographics Similar to Austrians by Single Female Poverty
In terms of single female poverty, the demographic groups most similar to Austrians are Venezuelan (20.4%, a difference of 0.030%), South African (20.4%, a difference of 0.060%), Luxembourger (20.4%, a difference of 0.11%), Immigrants from Uzbekistan (20.3%, a difference of 0.36%), and Australian (20.3%, a difference of 0.37%).
| Demographics | Rating | Rank | Single Female Poverty |
| Slovenes | 90.5 /100 | #138 | Exceptional 20.3% |
| Immigrants | Kuwait | 90.4 /100 | #139 | Exceptional 20.3% |
| Syrians | 90.4 /100 | #140 | Exceptional 20.3% |
| Immigrants | North America | 89.5 /100 | #141 | Excellent 20.3% |
| Immigrants | Uganda | 89.1 /100 | #142 | Excellent 20.3% |
| Australians | 88.4 /100 | #143 | Excellent 20.3% |
| Immigrants | Uzbekistan | 88.3 /100 | #144 | Excellent 20.3% |
| Austrians | 85.8 /100 | #145 | Excellent 20.4% |
| Venezuelans | 85.5 /100 | #146 | Excellent 20.4% |
| South Africans | 85.3 /100 | #147 | Excellent 20.4% |
| Luxembourgers | 84.9 /100 | #148 | Excellent 20.4% |
| Portuguese | 81.5 /100 | #149 | Excellent 20.5% |
| Immigrants | Denmark | 80.5 /100 | #150 | Excellent 20.5% |
| Puget Sound Salish | 79.6 /100 | #151 | Good 20.6% |
| Immigrants | Uruguay | 77.7 /100 | #152 | Good 20.6% |