Immigrants from Kenya vs Austrian Family Poverty
COMPARE
Immigrants from Kenya
Austrian
Family Poverty
Family Poverty Comparison
Immigrants from Kenya
Austrians
9.2%
FAMILY POVERTY
34.0/ 100
METRIC RATING
188th/ 347
METRIC RANK
7.8%
FAMILY POVERTY
98.2/ 100
METRIC RATING
73rd/ 347
METRIC RANK
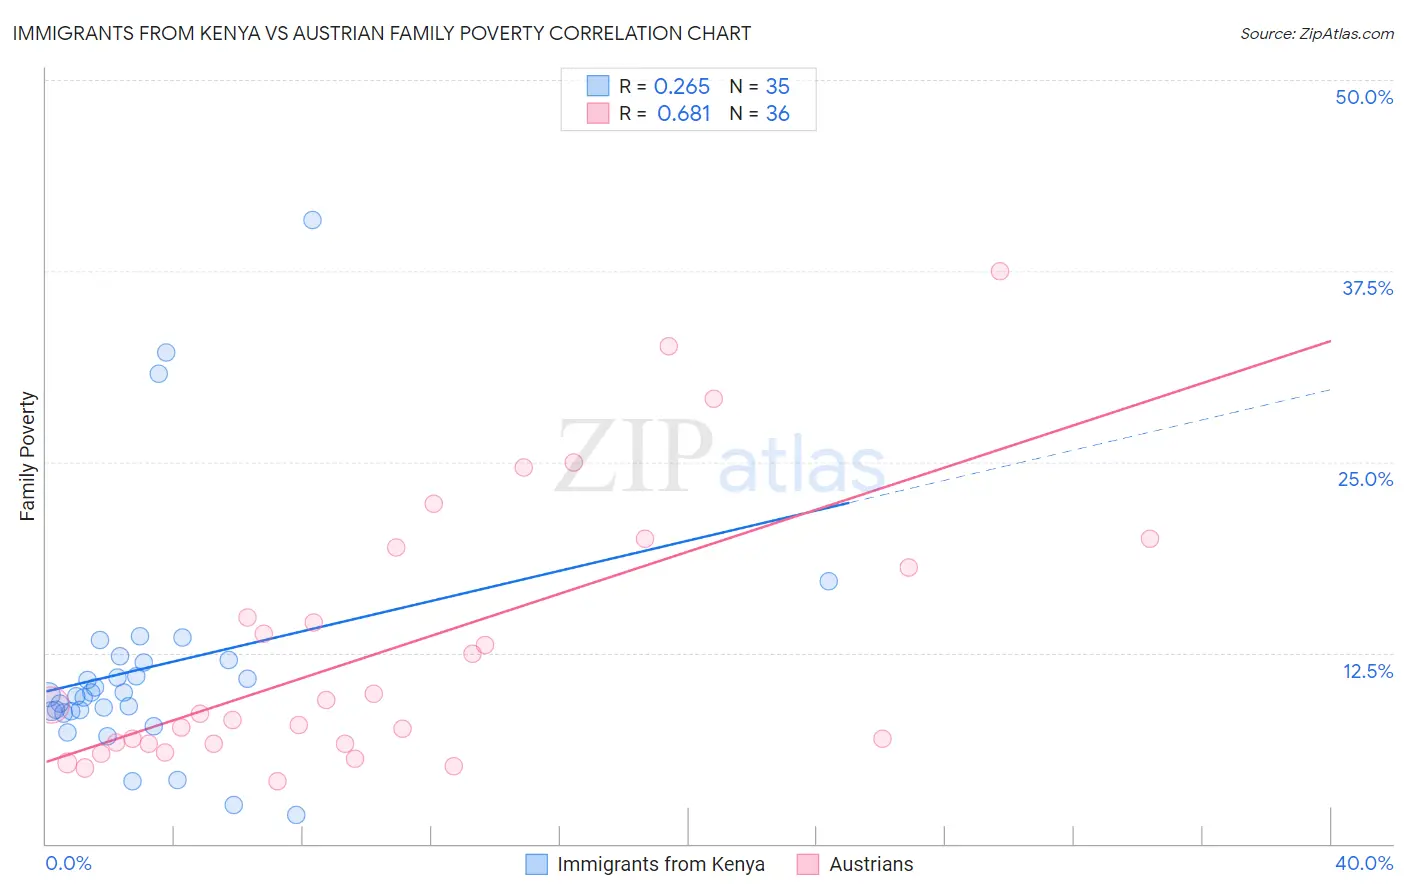
Immigrants from Kenya vs Austrian Family Poverty Correlation Chart
The statistical analysis conducted on geographies consisting of 217,776,212 people shows a weak positive correlation between the proportion of Immigrants from Kenya and poverty level among families in the United States with a correlation coefficient (R) of 0.265 and weighted average of 9.2%. Similarly, the statistical analysis conducted on geographies consisting of 450,050,339 people shows a significant positive correlation between the proportion of Austrians and poverty level among families in the United States with a correlation coefficient (R) of 0.681 and weighted average of 7.8%, a difference of 17.5%.
Family Poverty Correlation Summary
| Measurement | Immigrants from Kenya | Austrian |
| Minimum | 1.9% | 4.1% |
| Maximum | 40.8% | 37.5% |
| Range | 39.0% | 33.4% |
| Mean | 11.6% | 12.8% |
| Median | 9.8% | 8.8% |
| Interquartile 25% (IQ1) | 8.7% | 6.6% |
| Interquartile 75% (IQ3) | 12.0% | 18.8% |
| Interquartile Range (IQR) | 3.3% | 12.2% |
| Standard Deviation (Sample) | 7.9% | 8.6% |
| Standard Deviation (Population) | 7.8% | 8.5% |
Similar Demographics by Family Poverty
Demographics Similar to Immigrants from Kenya by Family Poverty
In terms of family poverty, the demographic groups most similar to Immigrants from Kenya are Delaware (9.2%, a difference of 0.20%), Colombian (9.2%, a difference of 0.29%), Immigrants from Afghanistan (9.2%, a difference of 0.29%), Arab (9.2%, a difference of 0.37%), and Immigrants from Saudi Arabia (9.1%, a difference of 0.63%).
| Demographics | Rating | Rank | Family Poverty |
| Hmong | 40.2 /100 | #181 | Average 9.1% |
| Immigrants | Morocco | 40.2 /100 | #182 | Average 9.1% |
| Uruguayans | 39.2 /100 | #183 | Fair 9.1% |
| South American Indians | 38.7 /100 | #184 | Fair 9.1% |
| Immigrants | Saudi Arabia | 38.6 /100 | #185 | Fair 9.1% |
| Colombians | 36.1 /100 | #186 | Fair 9.2% |
| Delaware | 35.4 /100 | #187 | Fair 9.2% |
| Immigrants | Kenya | 34.0 /100 | #188 | Fair 9.2% |
| Immigrants | Afghanistan | 32.1 /100 | #189 | Fair 9.2% |
| Arabs | 31.5 /100 | #190 | Fair 9.2% |
| Ugandans | 28.7 /100 | #191 | Fair 9.3% |
| Spanish | 28.7 /100 | #192 | Fair 9.3% |
| Immigrants | Western Asia | 28.2 /100 | #193 | Fair 9.3% |
| South Americans | 28.1 /100 | #194 | Fair 9.3% |
| Venezuelans | 27.4 /100 | #195 | Fair 9.3% |
Demographics Similar to Austrians by Family Poverty
In terms of family poverty, the demographic groups most similar to Austrians are Immigrants from Romania (7.8%, a difference of 0.0%), Cambodian (7.8%, a difference of 0.060%), Immigrants from China (7.8%, a difference of 0.070%), Immigrants from Canada (7.8%, a difference of 0.080%), and Immigrants from Belgium (7.8%, a difference of 0.13%).
| Demographics | Rating | Rank | Family Poverty |
| Dutch | 98.3 /100 | #66 | Exceptional 7.8% |
| Northern Europeans | 98.3 /100 | #67 | Exceptional 7.8% |
| Australians | 98.2 /100 | #68 | Exceptional 7.8% |
| Immigrants | Belgium | 98.2 /100 | #69 | Exceptional 7.8% |
| Immigrants | Canada | 98.2 /100 | #70 | Exceptional 7.8% |
| Cambodians | 98.2 /100 | #71 | Exceptional 7.8% |
| Immigrants | Romania | 98.2 /100 | #72 | Exceptional 7.8% |
| Austrians | 98.2 /100 | #73 | Exceptional 7.8% |
| Immigrants | China | 98.1 /100 | #74 | Exceptional 7.8% |
| Immigrants | Croatia | 98.1 /100 | #75 | Exceptional 7.8% |
| Immigrants | Latvia | 98.0 /100 | #76 | Exceptional 7.9% |
| Ukrainians | 98.0 /100 | #77 | Exceptional 7.9% |
| Immigrants | North America | 97.9 /100 | #78 | Exceptional 7.9% |
| Immigrants | Europe | 97.8 /100 | #79 | Exceptional 7.9% |
| English | 97.8 /100 | #80 | Exceptional 7.9% |