Spanish vs Swedish Single Father Poverty
COMPARE
Spanish
Swedish
Single Father Poverty
Single Father Poverty Comparison
Spanish
Swedes
16.7%
SINGLE FATHER POVERTY
10.7/ 100
METRIC RATING
214th/ 347
METRIC RANK
16.3%
SINGLE FATHER POVERTY
50.0/ 100
METRIC RATING
174th/ 347
METRIC RANK
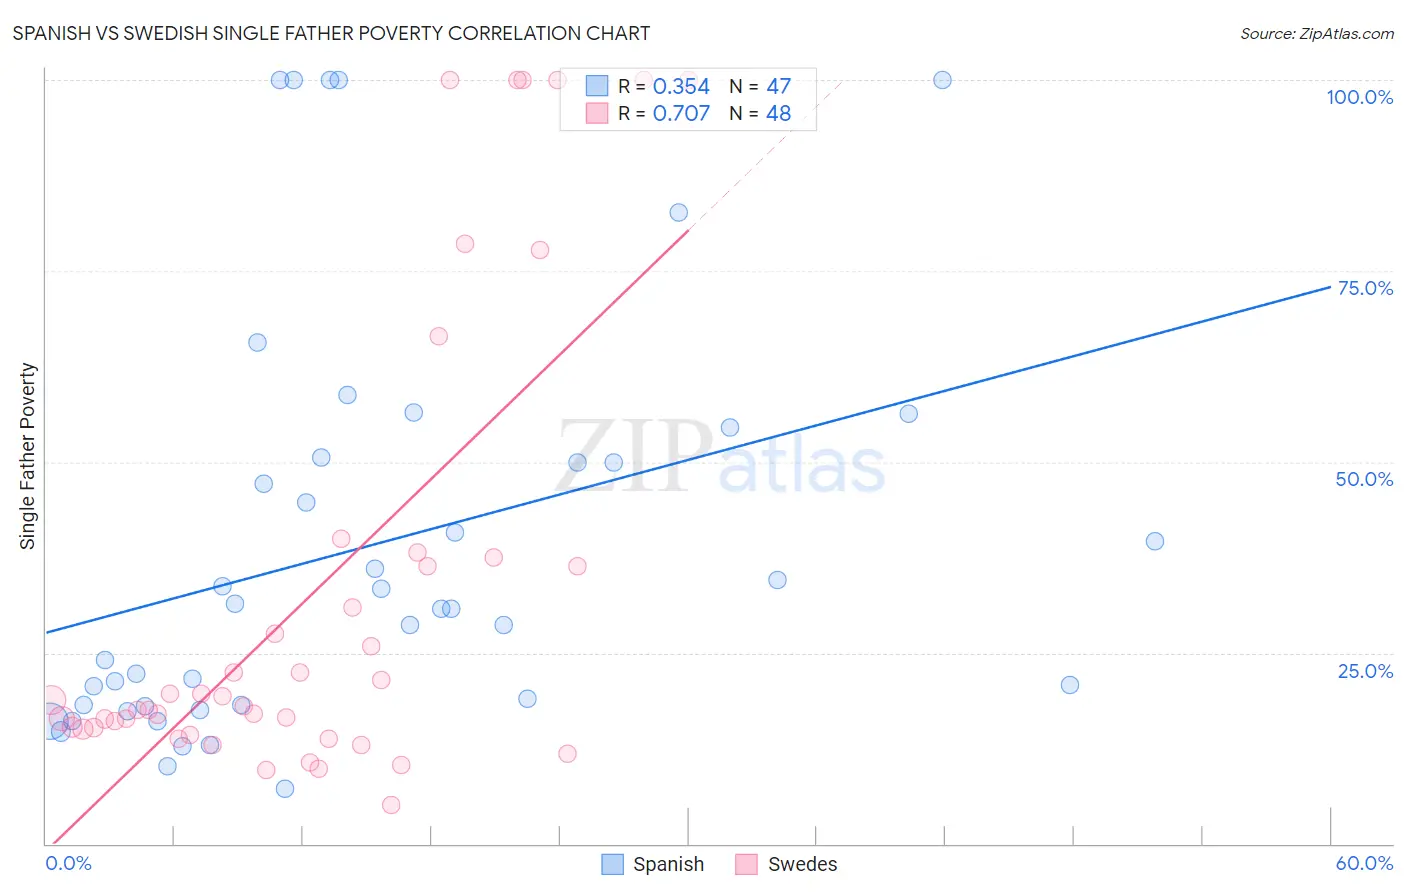
Spanish vs Swedish Single Father Poverty Correlation Chart
The statistical analysis conducted on geographies consisting of 330,244,668 people shows a mild positive correlation between the proportion of Spanish and poverty level among single fathers in the United States with a correlation coefficient (R) of 0.354 and weighted average of 16.7%. Similarly, the statistical analysis conducted on geographies consisting of 390,500,833 people shows a strong positive correlation between the proportion of Swedes and poverty level among single fathers in the United States with a correlation coefficient (R) of 0.707 and weighted average of 16.3%, a difference of 2.3%.
Single Father Poverty Correlation Summary
| Measurement | Spanish | Swedish |
| Minimum | 7.2% | 5.1% |
| Maximum | 100.0% | 100.0% |
| Range | 92.8% | 94.9% |
| Mean | 38.9% | 32.9% |
| Median | 30.8% | 18.4% |
| Interquartile 25% (IQ1) | 18.1% | 15.1% |
| Interquartile 75% (IQ3) | 50.5% | 36.9% |
| Interquartile Range (IQR) | 32.4% | 21.9% |
| Standard Deviation (Sample) | 26.9% | 30.0% |
| Standard Deviation (Population) | 26.6% | 29.7% |
Similar Demographics by Single Father Poverty
Demographics Similar to Spanish by Single Father Poverty
In terms of single father poverty, the demographic groups most similar to Spanish are Ghanaian (16.7%, a difference of 0.040%), Immigrants from Southern Europe (16.7%, a difference of 0.050%), Immigrants from Scotland (16.7%, a difference of 0.13%), Immigrants from England (16.7%, a difference of 0.14%), and Cheyenne (16.7%, a difference of 0.17%).
| Demographics | Rating | Rank | Single Father Poverty |
| New Zealanders | 13.7 /100 | #207 | Poor 16.6% |
| Eastern Europeans | 13.7 /100 | #208 | Poor 16.6% |
| Europeans | 13.2 /100 | #209 | Poor 16.6% |
| Guatemalans | 12.9 /100 | #210 | Poor 16.6% |
| Arabs | 12.8 /100 | #211 | Poor 16.6% |
| Immigrants | Southern Europe | 11.2 /100 | #212 | Poor 16.7% |
| Ghanaians | 11.0 /100 | #213 | Poor 16.7% |
| Spanish | 10.7 /100 | #214 | Poor 16.7% |
| Immigrants | Scotland | 9.6 /100 | #215 | Tragic 16.7% |
| Immigrants | England | 9.5 /100 | #216 | Tragic 16.7% |
| Cheyenne | 9.3 /100 | #217 | Tragic 16.7% |
| Immigrants | Uganda | 8.6 /100 | #218 | Tragic 16.7% |
| Immigrants | Ghana | 8.1 /100 | #219 | Tragic 16.7% |
| Immigrants | Denmark | 8.1 /100 | #220 | Tragic 16.7% |
| Immigrants | Greece | 8.1 /100 | #221 | Tragic 16.7% |
Demographics Similar to Swedes by Single Father Poverty
In terms of single father poverty, the demographic groups most similar to Swedes are Immigrants from Sierra Leone (16.3%, a difference of 0.0%), Immigrants from St. Vincent and the Grenadines (16.3%, a difference of 0.0%), Immigrants from Ecuador (16.3%, a difference of 0.020%), Immigrants from Morocco (16.3%, a difference of 0.030%), and Vietnamese (16.3%, a difference of 0.090%).
| Demographics | Rating | Rank | Single Father Poverty |
| Yugoslavians | 53.9 /100 | #167 | Average 16.3% |
| Costa Ricans | 53.6 /100 | #168 | Average 16.3% |
| Northern Europeans | 52.8 /100 | #169 | Average 16.3% |
| Scandinavians | 52.3 /100 | #170 | Average 16.3% |
| Immigrants | Morocco | 50.7 /100 | #171 | Average 16.3% |
| Immigrants | Sierra Leone | 50.1 /100 | #172 | Average 16.3% |
| Immigrants | St. Vincent and the Grenadines | 50.0 /100 | #173 | Average 16.3% |
| Swedes | 50.0 /100 | #174 | Average 16.3% |
| Immigrants | Ecuador | 49.7 /100 | #175 | Average 16.3% |
| Vietnamese | 48.0 /100 | #176 | Average 16.3% |
| Immigrants | South Africa | 44.2 /100 | #177 | Average 16.3% |
| Immigrants | Cuba | 41.6 /100 | #178 | Average 16.4% |
| Serbians | 40.9 /100 | #179 | Average 16.4% |
| Immigrants | Latin America | 37.2 /100 | #180 | Fair 16.4% |
| Immigrants | Western Africa | 36.0 /100 | #181 | Fair 16.4% |