Spanish vs Immigrants from Singapore Single Father Poverty
COMPARE
Spanish
Immigrants from Singapore
Single Father Poverty
Single Father Poverty Comparison
Spanish
Immigrants from Singapore
16.7%
SINGLE FATHER POVERTY
10.7/ 100
METRIC RATING
214th/ 347
METRIC RANK
14.3%
SINGLE FATHER POVERTY
100.0/ 100
METRIC RATING
20th/ 347
METRIC RANK
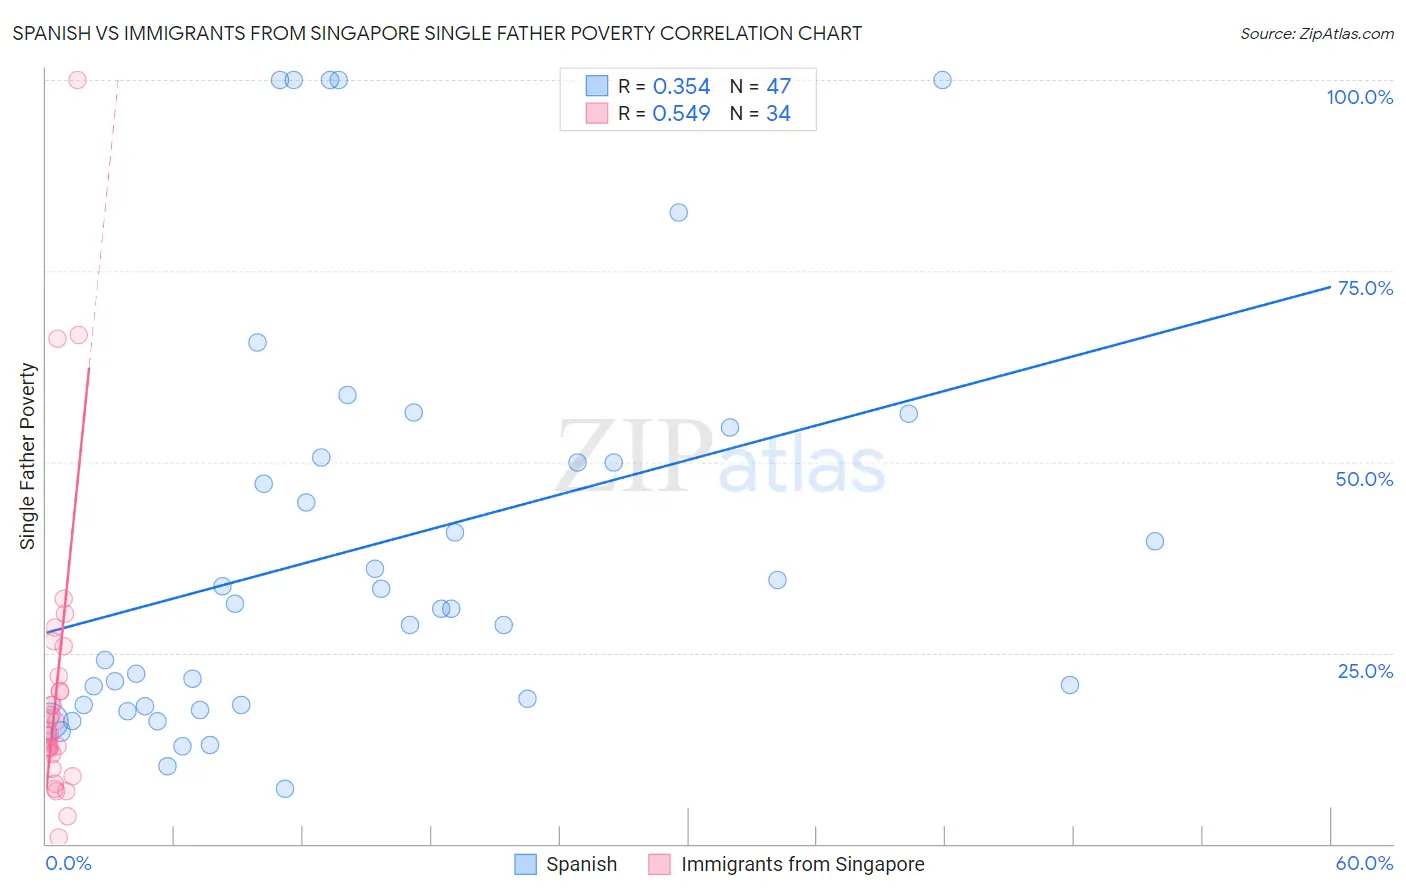
Spanish vs Immigrants from Singapore Single Father Poverty Correlation Chart
The statistical analysis conducted on geographies consisting of 330,244,668 people shows a mild positive correlation between the proportion of Spanish and poverty level among single fathers in the United States with a correlation coefficient (R) of 0.354 and weighted average of 16.7%. Similarly, the statistical analysis conducted on geographies consisting of 118,546,936 people shows a substantial positive correlation between the proportion of Immigrants from Singapore and poverty level among single fathers in the United States with a correlation coefficient (R) of 0.549 and weighted average of 14.3%, a difference of 16.9%.
Single Father Poverty Correlation Summary
| Measurement | Spanish | Immigrants from Singapore |
| Minimum | 7.2% | 0.84% |
| Maximum | 100.0% | 100.0% |
| Range | 92.8% | 99.2% |
| Mean | 38.9% | 20.8% |
| Median | 30.8% | 14.5% |
| Interquartile 25% (IQ1) | 18.1% | 11.8% |
| Interquartile 75% (IQ3) | 50.5% | 21.9% |
| Interquartile Range (IQR) | 32.4% | 10.1% |
| Standard Deviation (Sample) | 26.9% | 19.9% |
| Standard Deviation (Population) | 26.6% | 19.6% |
Similar Demographics by Single Father Poverty
Demographics Similar to Spanish by Single Father Poverty
In terms of single father poverty, the demographic groups most similar to Spanish are Ghanaian (16.7%, a difference of 0.040%), Immigrants from Southern Europe (16.7%, a difference of 0.050%), Immigrants from Scotland (16.7%, a difference of 0.13%), Immigrants from England (16.7%, a difference of 0.14%), and Cheyenne (16.7%, a difference of 0.17%).
| Demographics | Rating | Rank | Single Father Poverty |
| New Zealanders | 13.7 /100 | #207 | Poor 16.6% |
| Eastern Europeans | 13.7 /100 | #208 | Poor 16.6% |
| Europeans | 13.2 /100 | #209 | Poor 16.6% |
| Guatemalans | 12.9 /100 | #210 | Poor 16.6% |
| Arabs | 12.8 /100 | #211 | Poor 16.6% |
| Immigrants | Southern Europe | 11.2 /100 | #212 | Poor 16.7% |
| Ghanaians | 11.0 /100 | #213 | Poor 16.7% |
| Spanish | 10.7 /100 | #214 | Poor 16.7% |
| Immigrants | Scotland | 9.6 /100 | #215 | Tragic 16.7% |
| Immigrants | England | 9.5 /100 | #216 | Tragic 16.7% |
| Cheyenne | 9.3 /100 | #217 | Tragic 16.7% |
| Immigrants | Uganda | 8.6 /100 | #218 | Tragic 16.7% |
| Immigrants | Ghana | 8.1 /100 | #219 | Tragic 16.7% |
| Immigrants | Denmark | 8.1 /100 | #220 | Tragic 16.7% |
| Immigrants | Greece | 8.1 /100 | #221 | Tragic 16.7% |
Demographics Similar to Immigrants from Singapore by Single Father Poverty
In terms of single father poverty, the demographic groups most similar to Immigrants from Singapore are Immigrants from Iraq (14.3%, a difference of 0.040%), Soviet Union (14.3%, a difference of 0.090%), Immigrants from Afghanistan (14.3%, a difference of 0.090%), Immigrants from Hong Kong (14.2%, a difference of 0.11%), and Taiwanese (14.3%, a difference of 0.43%).
| Demographics | Rating | Rank | Single Father Poverty |
| Immigrants | Philippines | 100.0 /100 | #13 | Exceptional 14.0% |
| Immigrants | Vietnam | 100.0 /100 | #14 | Exceptional 14.1% |
| Sri Lankans | 100.0 /100 | #15 | Exceptional 14.2% |
| Immigrants | Iran | 100.0 /100 | #16 | Exceptional 14.2% |
| Immigrants | Hong Kong | 100.0 /100 | #17 | Exceptional 14.2% |
| Soviet Union | 100.0 /100 | #18 | Exceptional 14.3% |
| Immigrants | Iraq | 100.0 /100 | #19 | Exceptional 14.3% |
| Immigrants | Singapore | 100.0 /100 | #20 | Exceptional 14.3% |
| Immigrants | Afghanistan | 100.0 /100 | #21 | Exceptional 14.3% |
| Taiwanese | 100.0 /100 | #22 | Exceptional 14.3% |
| Immigrants | Egypt | 100.0 /100 | #23 | Exceptional 14.4% |
| Immigrants | South Eastern Asia | 100.0 /100 | #24 | Exceptional 14.4% |
| Iranians | 100.0 /100 | #25 | Exceptional 14.4% |
| Spanish American Indians | 100.0 /100 | #26 | Exceptional 14.4% |
| Nepalese | 100.0 /100 | #27 | Exceptional 14.4% |