Danish vs Swedish Single Father Poverty
COMPARE
Danish
Swedish
Single Father Poverty
Single Father Poverty Comparison
Danes
Swedes
15.8%
SINGLE FATHER POVERTY
94.5/ 100
METRIC RATING
113th/ 347
METRIC RANK
16.3%
SINGLE FATHER POVERTY
50.0/ 100
METRIC RATING
174th/ 347
METRIC RANK
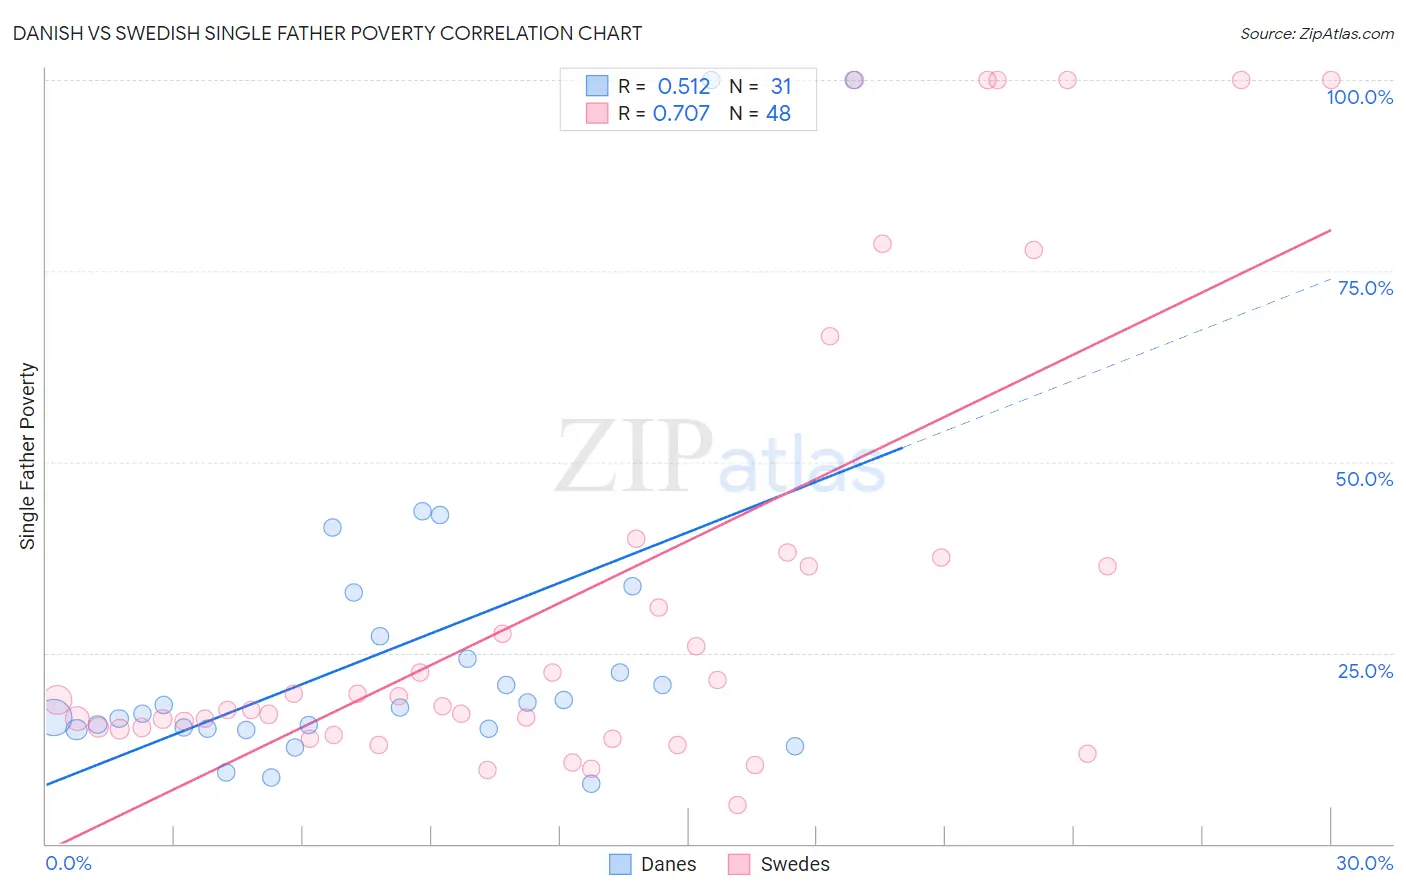
Danish vs Swedish Single Father Poverty Correlation Chart
The statistical analysis conducted on geographies consisting of 352,960,899 people shows a substantial positive correlation between the proportion of Danes and poverty level among single fathers in the United States with a correlation coefficient (R) of 0.512 and weighted average of 15.8%. Similarly, the statistical analysis conducted on geographies consisting of 390,500,833 people shows a strong positive correlation between the proportion of Swedes and poverty level among single fathers in the United States with a correlation coefficient (R) of 0.707 and weighted average of 16.3%, a difference of 3.2%.
Single Father Poverty Correlation Summary
| Measurement | Danish | Swedish |
| Minimum | 7.9% | 5.1% |
| Maximum | 100.0% | 100.0% |
| Range | 92.1% | 94.9% |
| Mean | 25.5% | 32.9% |
| Median | 17.9% | 18.4% |
| Interquartile 25% (IQ1) | 15.1% | 15.1% |
| Interquartile 75% (IQ3) | 27.1% | 36.9% |
| Interquartile Range (IQR) | 12.0% | 21.9% |
| Standard Deviation (Sample) | 22.0% | 30.0% |
| Standard Deviation (Population) | 21.6% | 29.7% |
Similar Demographics by Single Father Poverty
Demographics Similar to Danes by Single Father Poverty
In terms of single father poverty, the demographic groups most similar to Danes are Argentinean (15.8%, a difference of 0.020%), Immigrants from Latvia (15.8%, a difference of 0.040%), Bulgarian (15.8%, a difference of 0.080%), Immigrants from Africa (15.8%, a difference of 0.13%), and Turkish (15.8%, a difference of 0.14%).
| Demographics | Rating | Rank | Single Father Poverty |
| Immigrants | Poland | 95.8 /100 | #106 | Exceptional 15.7% |
| Native Hawaiians | 95.8 /100 | #107 | Exceptional 15.7% |
| Pakistanis | 95.7 /100 | #108 | Exceptional 15.7% |
| Turks | 95.1 /100 | #109 | Exceptional 15.8% |
| Immigrants | Africa | 95.1 /100 | #110 | Exceptional 15.8% |
| Bulgarians | 94.8 /100 | #111 | Exceptional 15.8% |
| Immigrants | Latvia | 94.7 /100 | #112 | Exceptional 15.8% |
| Danes | 94.5 /100 | #113 | Exceptional 15.8% |
| Argentineans | 94.4 /100 | #114 | Exceptional 15.8% |
| Immigrants | Thailand | 93.6 /100 | #115 | Exceptional 15.8% |
| Immigrants | Argentina | 92.8 /100 | #116 | Exceptional 15.8% |
| Immigrants | Colombia | 92.6 /100 | #117 | Exceptional 15.8% |
| Immigrants | Eastern Europe | 92.5 /100 | #118 | Exceptional 15.8% |
| Immigrants | Belarus | 92.4 /100 | #119 | Exceptional 15.8% |
| Uruguayans | 92.1 /100 | #120 | Exceptional 15.9% |
Demographics Similar to Swedes by Single Father Poverty
In terms of single father poverty, the demographic groups most similar to Swedes are Immigrants from Sierra Leone (16.3%, a difference of 0.0%), Immigrants from St. Vincent and the Grenadines (16.3%, a difference of 0.0%), Immigrants from Ecuador (16.3%, a difference of 0.020%), Immigrants from Morocco (16.3%, a difference of 0.030%), and Vietnamese (16.3%, a difference of 0.090%).
| Demographics | Rating | Rank | Single Father Poverty |
| Yugoslavians | 53.9 /100 | #167 | Average 16.3% |
| Costa Ricans | 53.6 /100 | #168 | Average 16.3% |
| Northern Europeans | 52.8 /100 | #169 | Average 16.3% |
| Scandinavians | 52.3 /100 | #170 | Average 16.3% |
| Immigrants | Morocco | 50.7 /100 | #171 | Average 16.3% |
| Immigrants | Sierra Leone | 50.1 /100 | #172 | Average 16.3% |
| Immigrants | St. Vincent and the Grenadines | 50.0 /100 | #173 | Average 16.3% |
| Swedes | 50.0 /100 | #174 | Average 16.3% |
| Immigrants | Ecuador | 49.7 /100 | #175 | Average 16.3% |
| Vietnamese | 48.0 /100 | #176 | Average 16.3% |
| Immigrants | South Africa | 44.2 /100 | #177 | Average 16.3% |
| Immigrants | Cuba | 41.6 /100 | #178 | Average 16.4% |
| Serbians | 40.9 /100 | #179 | Average 16.4% |
| Immigrants | Latin America | 37.2 /100 | #180 | Fair 16.4% |
| Immigrants | Western Africa | 36.0 /100 | #181 | Fair 16.4% |