Spanish vs Palestinian Single Father Poverty
COMPARE
Spanish
Palestinian
Single Father Poverty
Single Father Poverty Comparison
Spanish
Palestinians
16.7%
SINGLE FATHER POVERTY
10.7/ 100
METRIC RATING
214th/ 347
METRIC RANK
15.9%
SINGLE FATHER POVERTY
91.3/ 100
METRIC RATING
123rd/ 347
METRIC RANK
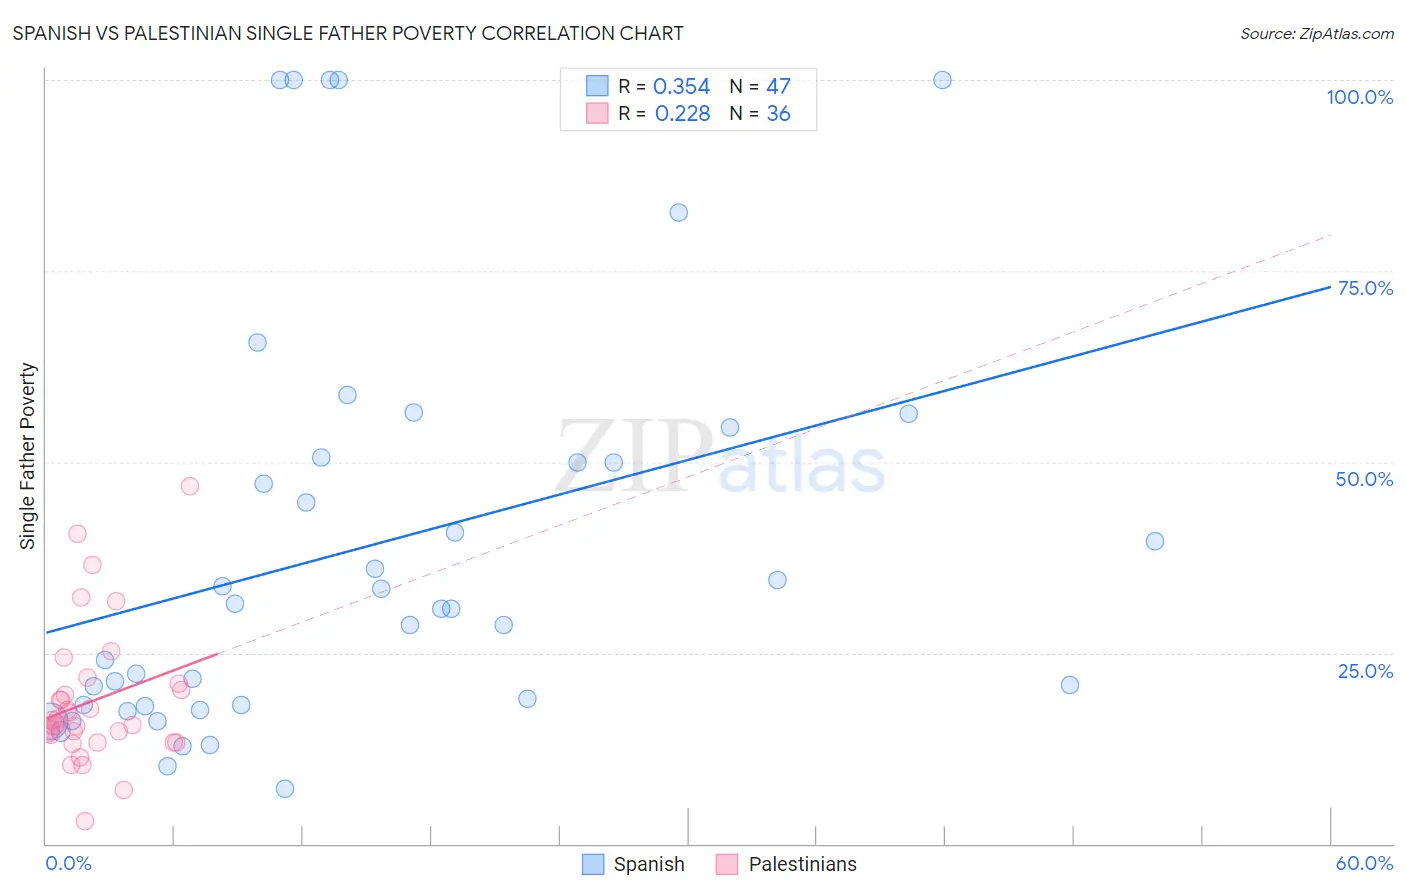
Spanish vs Palestinian Single Father Poverty Correlation Chart
The statistical analysis conducted on geographies consisting of 330,244,668 people shows a mild positive correlation between the proportion of Spanish and poverty level among single fathers in the United States with a correlation coefficient (R) of 0.354 and weighted average of 16.7%. Similarly, the statistical analysis conducted on geographies consisting of 184,724,489 people shows a weak positive correlation between the proportion of Palestinians and poverty level among single fathers in the United States with a correlation coefficient (R) of 0.228 and weighted average of 15.9%, a difference of 5.1%.
Single Father Poverty Correlation Summary
| Measurement | Spanish | Palestinian |
| Minimum | 7.2% | 3.0% |
| Maximum | 100.0% | 46.8% |
| Range | 92.8% | 43.8% |
| Mean | 38.9% | 18.7% |
| Median | 30.8% | 15.9% |
| Interquartile 25% (IQ1) | 18.1% | 13.8% |
| Interquartile 75% (IQ3) | 50.5% | 20.5% |
| Interquartile Range (IQR) | 32.4% | 6.7% |
| Standard Deviation (Sample) | 26.9% | 9.0% |
| Standard Deviation (Population) | 26.6% | 8.9% |
Similar Demographics by Single Father Poverty
Demographics Similar to Spanish by Single Father Poverty
In terms of single father poverty, the demographic groups most similar to Spanish are Ghanaian (16.7%, a difference of 0.040%), Immigrants from Southern Europe (16.7%, a difference of 0.050%), Immigrants from Scotland (16.7%, a difference of 0.13%), Immigrants from England (16.7%, a difference of 0.14%), and Cheyenne (16.7%, a difference of 0.17%).
| Demographics | Rating | Rank | Single Father Poverty |
| New Zealanders | 13.7 /100 | #207 | Poor 16.6% |
| Eastern Europeans | 13.7 /100 | #208 | Poor 16.6% |
| Europeans | 13.2 /100 | #209 | Poor 16.6% |
| Guatemalans | 12.9 /100 | #210 | Poor 16.6% |
| Arabs | 12.8 /100 | #211 | Poor 16.6% |
| Immigrants | Southern Europe | 11.2 /100 | #212 | Poor 16.7% |
| Ghanaians | 11.0 /100 | #213 | Poor 16.7% |
| Spanish | 10.7 /100 | #214 | Poor 16.7% |
| Immigrants | Scotland | 9.6 /100 | #215 | Tragic 16.7% |
| Immigrants | England | 9.5 /100 | #216 | Tragic 16.7% |
| Cheyenne | 9.3 /100 | #217 | Tragic 16.7% |
| Immigrants | Uganda | 8.6 /100 | #218 | Tragic 16.7% |
| Immigrants | Ghana | 8.1 /100 | #219 | Tragic 16.7% |
| Immigrants | Denmark | 8.1 /100 | #220 | Tragic 16.7% |
| Immigrants | Greece | 8.1 /100 | #221 | Tragic 16.7% |
Demographics Similar to Palestinians by Single Father Poverty
In terms of single father poverty, the demographic groups most similar to Palestinians are Immigrants from Panama (15.9%, a difference of 0.010%), Iraqi (15.9%, a difference of 0.020%), Hmong (15.9%, a difference of 0.030%), Sudanese (15.9%, a difference of 0.040%), and Immigrants from Liberia (15.9%, a difference of 0.040%).
| Demographics | Rating | Rank | Single Father Poverty |
| Immigrants | Argentina | 92.8 /100 | #116 | Exceptional 15.8% |
| Immigrants | Colombia | 92.6 /100 | #117 | Exceptional 15.8% |
| Immigrants | Eastern Europe | 92.5 /100 | #118 | Exceptional 15.8% |
| Immigrants | Belarus | 92.4 /100 | #119 | Exceptional 15.8% |
| Uruguayans | 92.1 /100 | #120 | Exceptional 15.9% |
| Immigrants | Immigrants | 91.9 /100 | #121 | Exceptional 15.9% |
| Sudanese | 91.6 /100 | #122 | Exceptional 15.9% |
| Palestinians | 91.3 /100 | #123 | Exceptional 15.9% |
| Immigrants | Panama | 91.3 /100 | #124 | Exceptional 15.9% |
| Iraqis | 91.2 /100 | #125 | Exceptional 15.9% |
| Hmong | 91.1 /100 | #126 | Exceptional 15.9% |
| Immigrants | Liberia | 91.1 /100 | #127 | Exceptional 15.9% |
| Immigrants | Nigeria | 90.8 /100 | #128 | Exceptional 15.9% |
| Immigrants | West Indies | 90.8 /100 | #129 | Exceptional 15.9% |
| Norwegians | 90.2 /100 | #130 | Exceptional 15.9% |